Manufacturing Business Analysis Powerpoint Presentation Slides
Introducing our Manufacturing Business Analysis PowerPoint Presentation Slides to make your task easy and time-efficient. Present a detailed account of your business operations and the challenges faced in manufacturing through our business analytics PPT slides. This quantitative analysis PPT deck lets you cover the key elements, milestones, balance-sheet, and market share of the company to educate your audience about the overall business overview of the company. Engage in performance analysis of the company by highlighting revenue split and sales performance by utilizing our manufacturing-assessment PPT deck. Track the sales, revenue, and engage in quality-control by taking the aid of our production analysis PPT templates. Enlighten your audience about your company’s global presence, vision, mission, goals, and provide an apt comparison of the competitors’ business analysis by employing our marketing analysis PPT presentation. Introduce your team and the key figures responsible for formulating the business strategy utilizing this business assessment PPT slideshow.
Introducing our Manufacturing Business Analysis PowerPoint Presentation Slides to make your task easy and time-efficient. P..
- Google Slides is a new FREE Presentation software from Google.
- All our content is 100% compatible with Google Slides.
- Just download our designs, and upload them to Google Slides and they will work automatically.
- Amaze your audience with SlideTeam and Google Slides.
-
Want Changes to This PPT Slide? Check out our Presentation Design Services
- WideScreen Aspect ratio is becoming a very popular format. When you download this product, the downloaded ZIP will contain this product in both standard and widescreen format.
-

- Some older products that we have may only be in standard format, but they can easily be converted to widescreen.
- To do this, please open the SlideTeam product in Powerpoint, and go to
- Design ( On the top bar) -> Page Setup -> and select "On-screen Show (16:9)” in the drop down for "Slides Sized for".
- The slide or theme will change to widescreen, and all graphics will adjust automatically. You can similarly convert our content to any other desired screen aspect ratio.
Compatible With Google Slides

Get This In WideScreen
You must be logged in to download this presentation.
PowerPoint presentation slides
Presenting our Manufacturing Business Analysis PowerPoint Presentation Slides. This is a 100% editable and adaptable PPT slide. You can save it in different formats like PDF, JPG, and PNG. It can be edited with different color, font, font size, and font type of the template as per your requirements. This template supports the standard (4:3) and widescreen (16:9) format. It is also compatible with Google slides.
People who downloaded this PowerPoint presentation also viewed the following :
Content of this Powerpoint Presentation
Slide 1: This title slide introduces Manufacturing Business Analysis. Add the name of your company here.
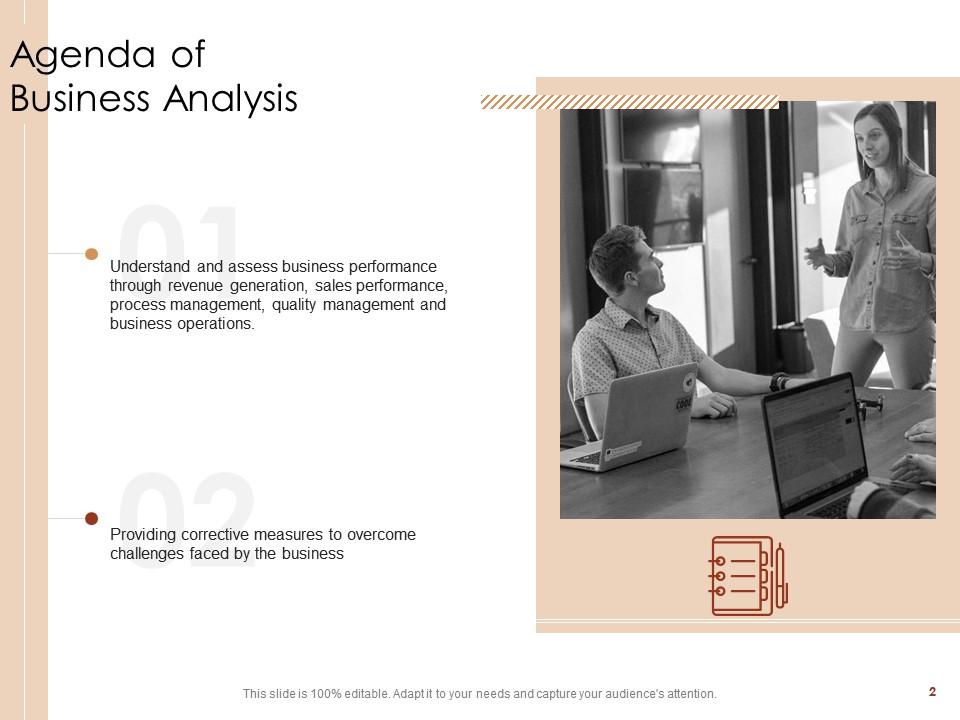
Slide 2: This slide presents the Agenda of Business Analysis. It includes - Understand and assess business performance through revenue generation, sales performance, process management, quality management, and business operations, and Providing corrective measures to overcome challenges faced by the business.
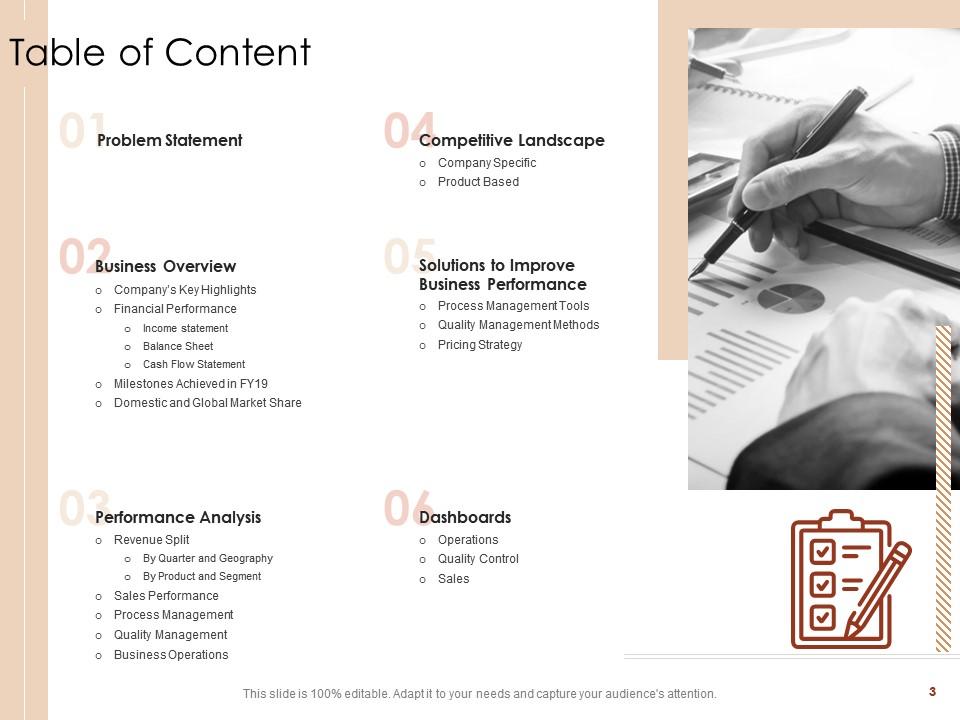
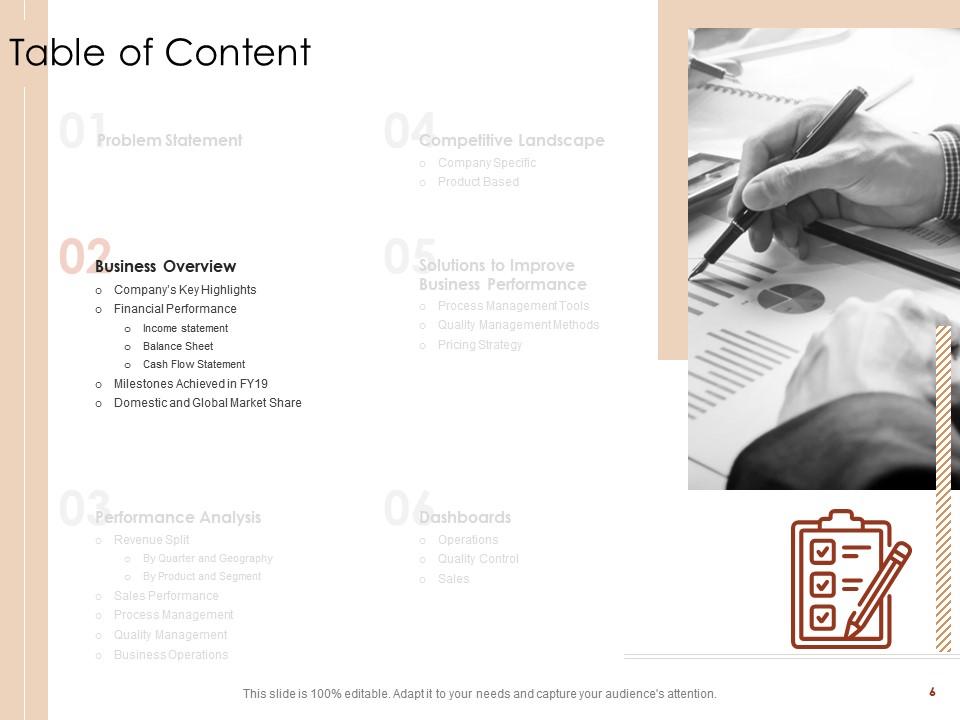
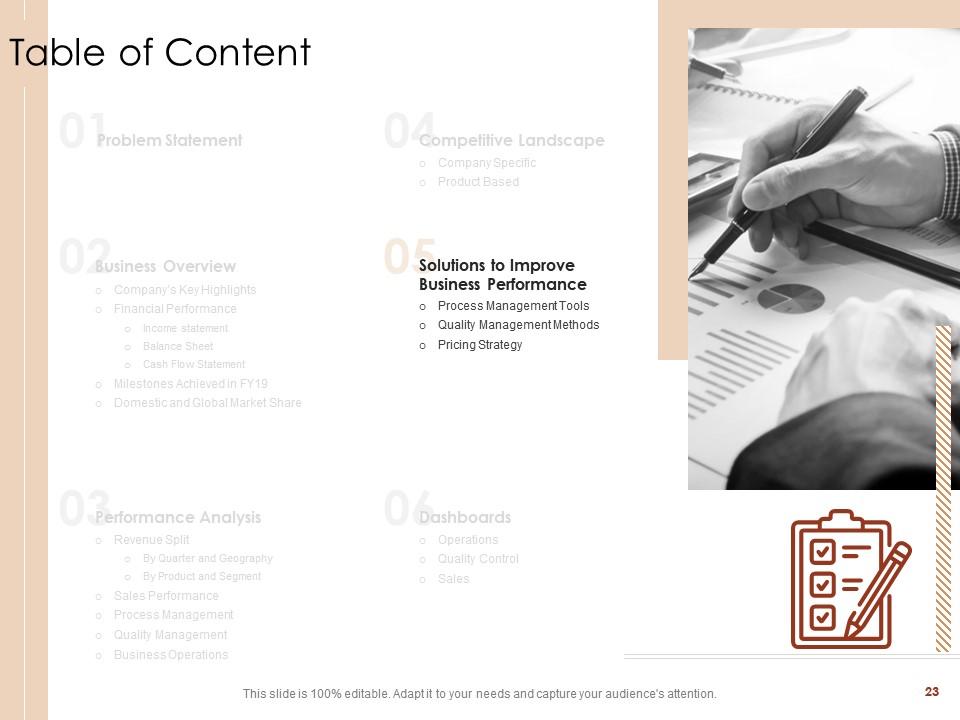
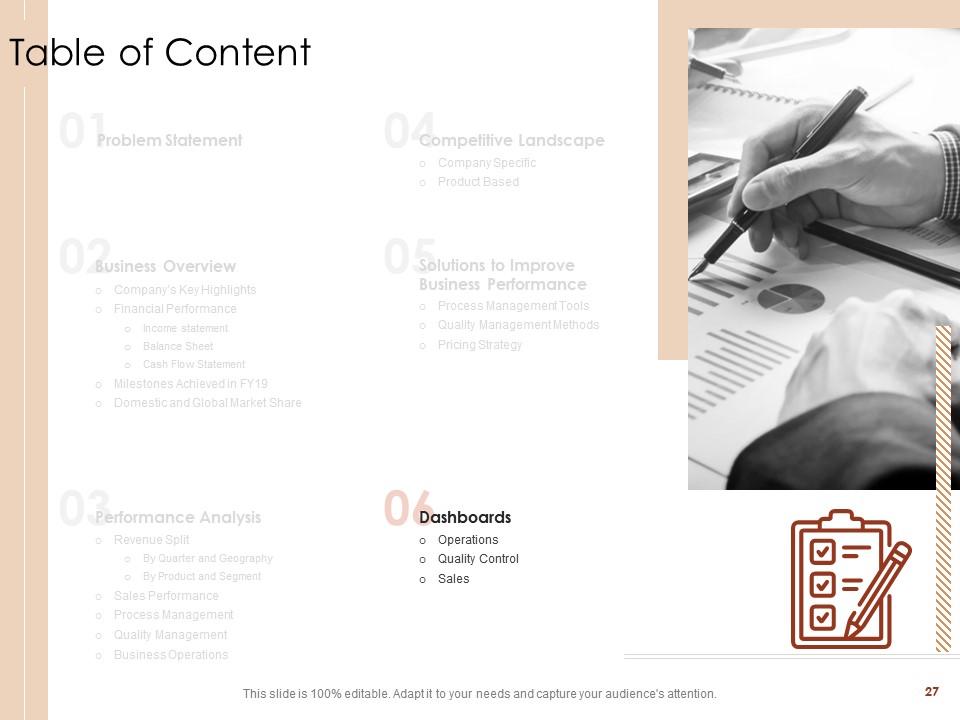
Slide 3: This slide contains the Table of Content. It includes - Problem Statement, Business Overview, Performance Analysis, Solutions to Improve Business Performance, Dashboards, and Competitive Landscape.
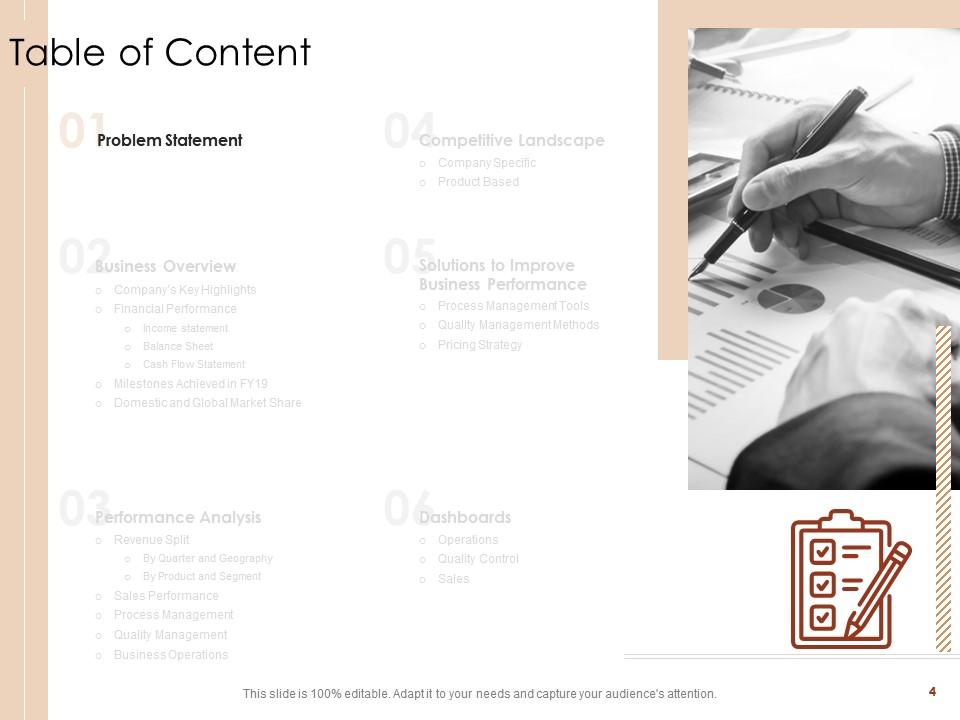
Slide 4: This is a table of content slide showing the Problem Statement.
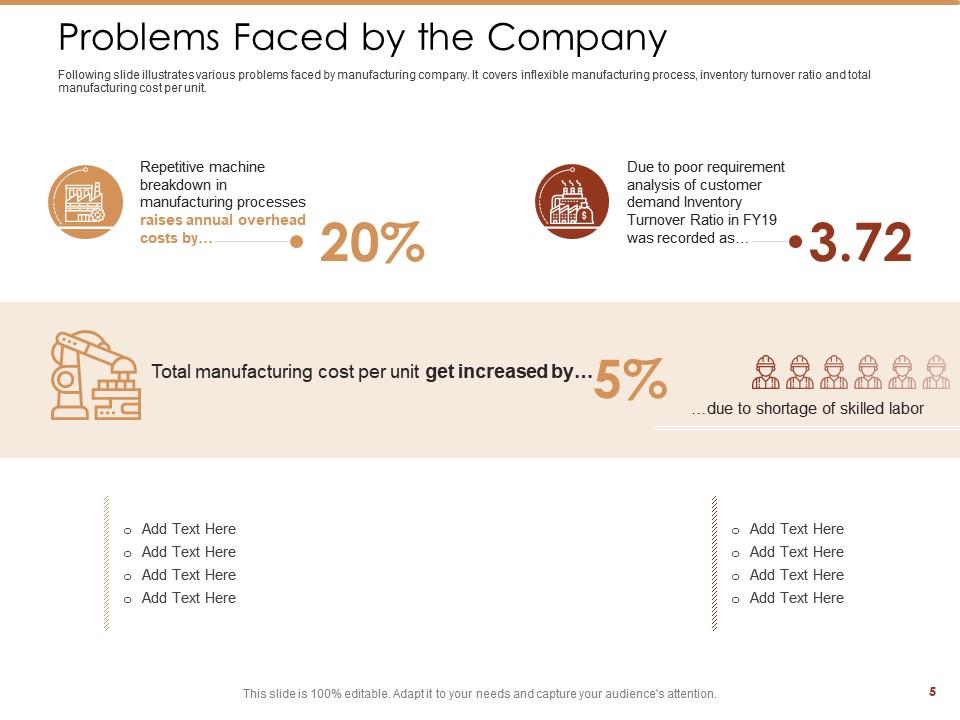
Slide 5: This slide presents the Problems Faced by the Company. The following slide illustrates various problems faced by manufacturing companies. It covers inflexible manufacturing processes, inventory turnover ratio, and total manufacturing costs per unit.
Slide 6: This is a table of content slide showing the Business Overview. It includes - Company’s Key Highlights, Financial Performance, Milestones Achieved in FY19, and Domestic and Global Market Share.
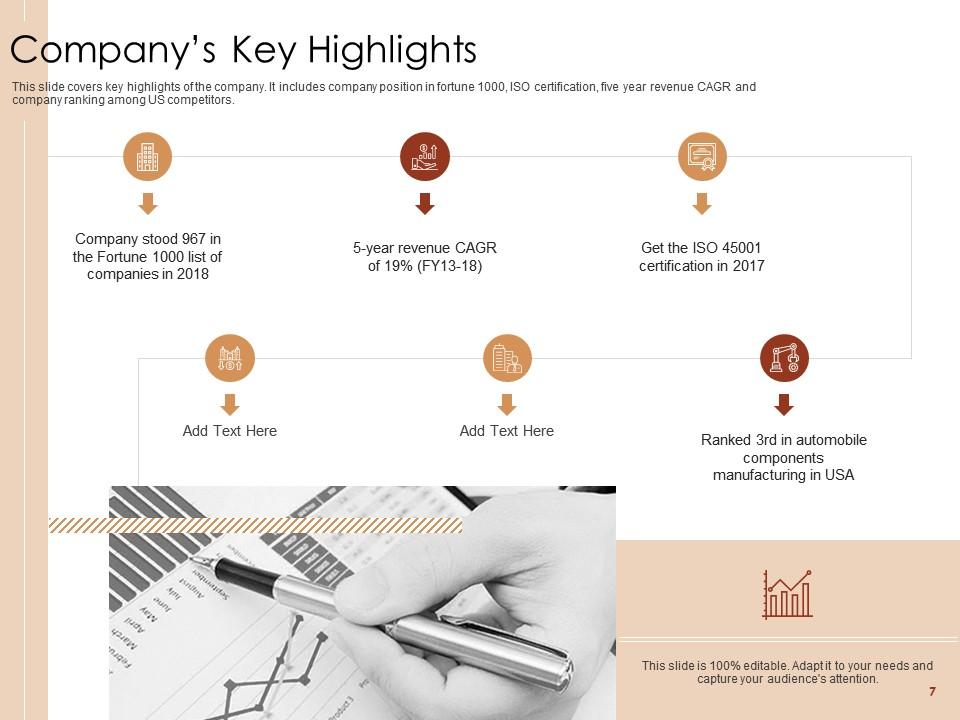
Slide 7: This slide presents the Company’s Key Highlights. It covers key highlights of the company. It includes company position in fortune 1000, ISO certification, five-year revenue CAGR, and company ranking among US competitors.
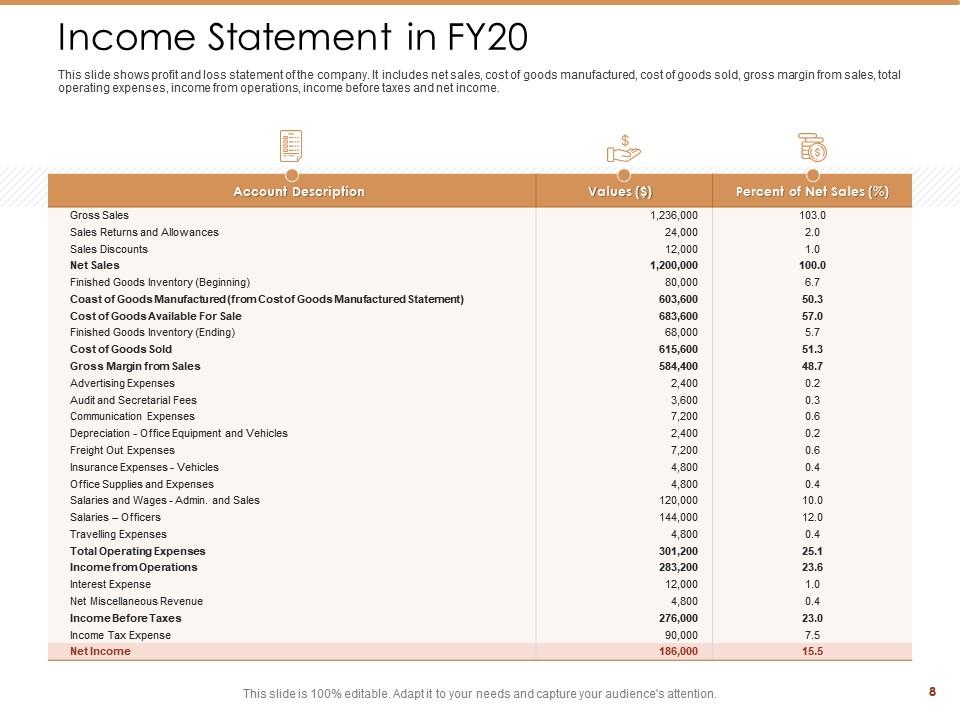
Slide 8: This slide presents the Income Statement in FY20. It shows the profit and loss statement of the company. It includes net sales, cost of goods manufactured, cost of goods sold, gross margin from sales, total operating expenses, income from operations, income before taxes, and net income.
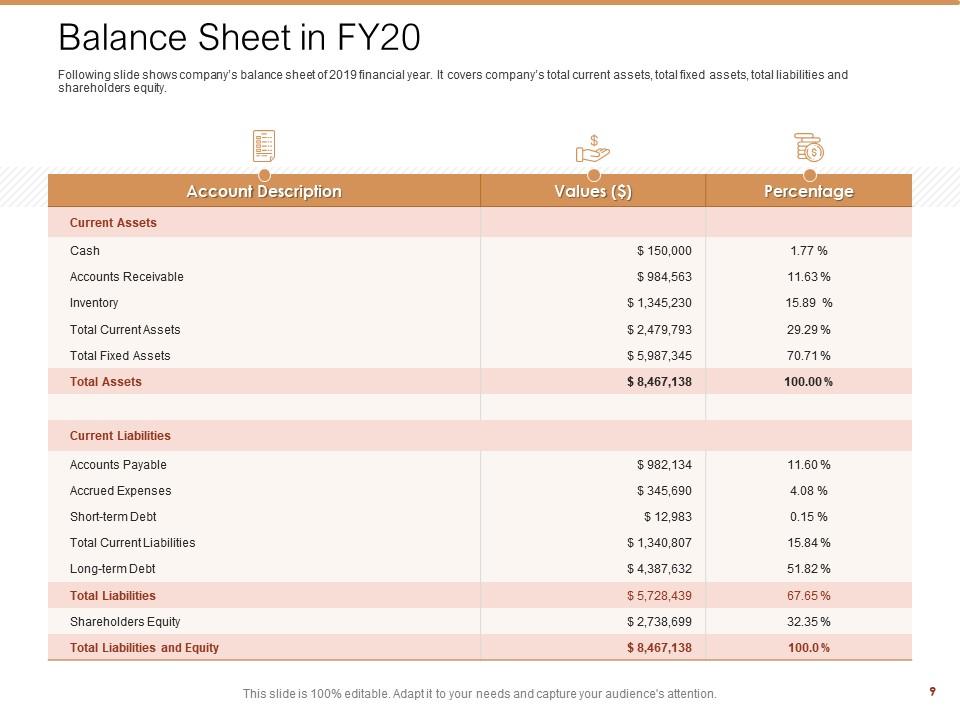
Slide 9: This slide presents the Balance Sheet in FY20. It shows the company’s balance sheet for the 2019 financial year. It covers the company’s total current assets, total fixed assets, total liabilities, and shareholder’s equity.
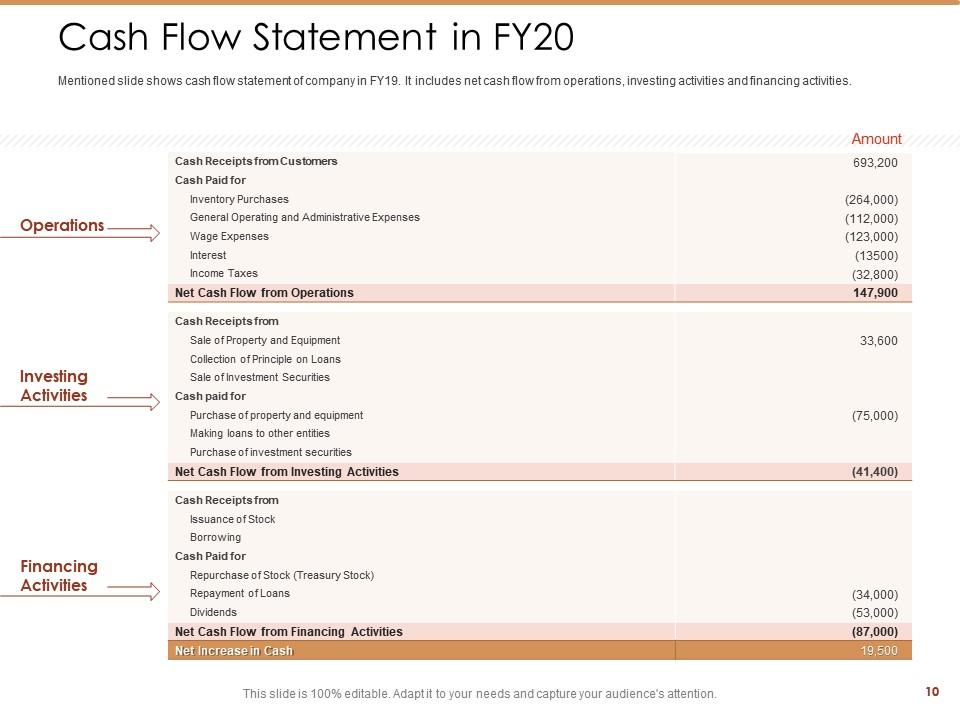
Slide 10: This slide presents the Cash Flow Statement in FY20. It shows the cash flow statement of the company in FY19. It includes net cash flow from operations, investing activities, and financing activities.
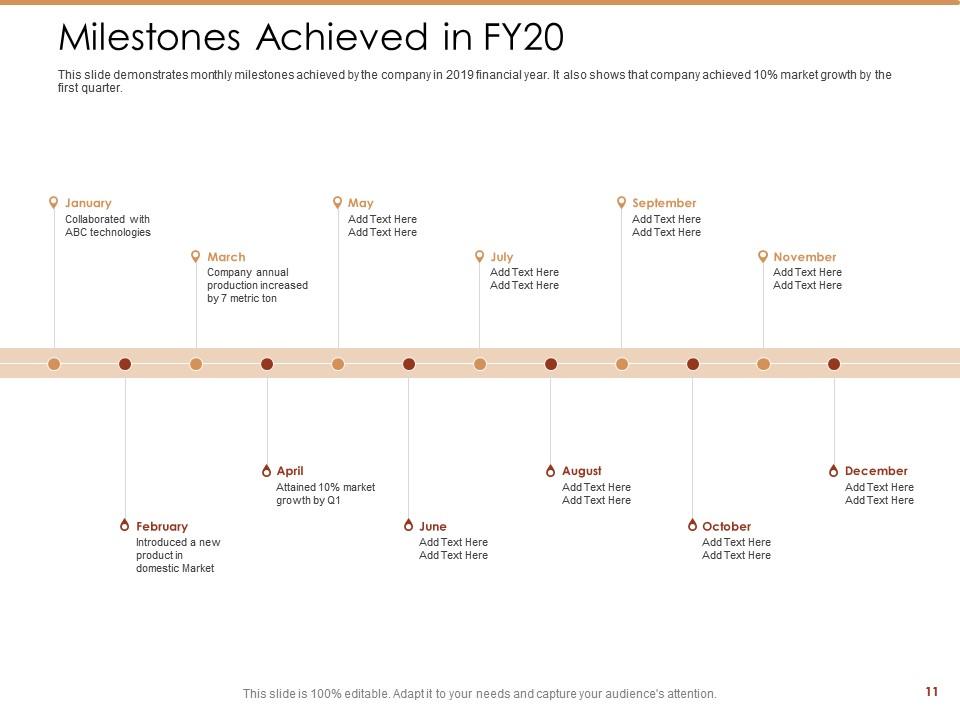
Slide 11: This slide presents the Milestones Achieved in FY20. It demonstrates monthly milestones achieved by the company in the 2019 financial year.
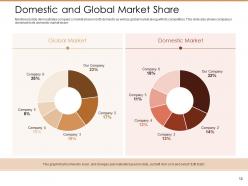
Slide 12: This slide presents the Domestic and Global Market Share. It demonstrates the company’s market share in both domestic as well as global market along with its competitors.
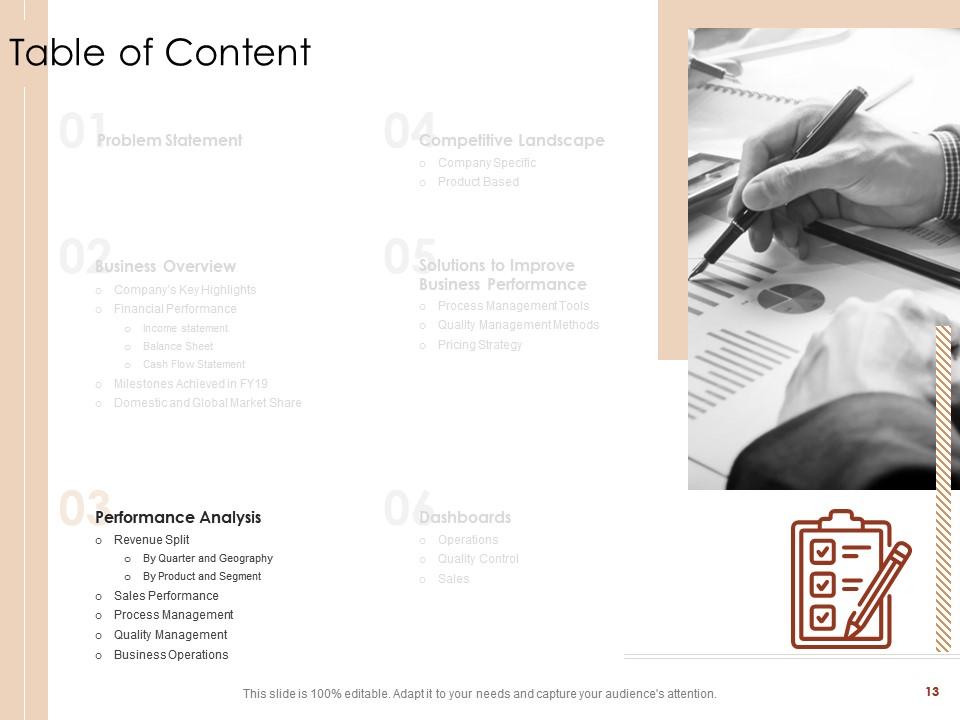
Slide 13: This is a table of content slide showing the Performance Analysis. It includes - Revenue Split, Sales Performance, Process Management, Quality Management, and Business Operations.
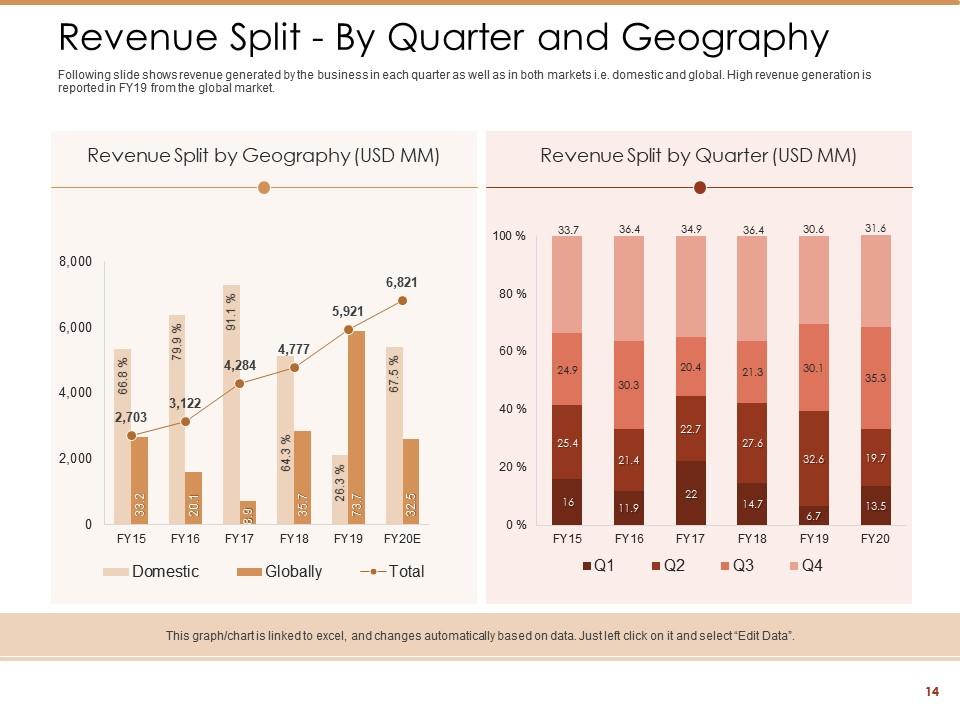
Slide 14: This slide presents the Revenue Split - By Quarter and Geography. It shows the revenue generated by the business in each quarter as well as in both markets i.e., domestic and global.
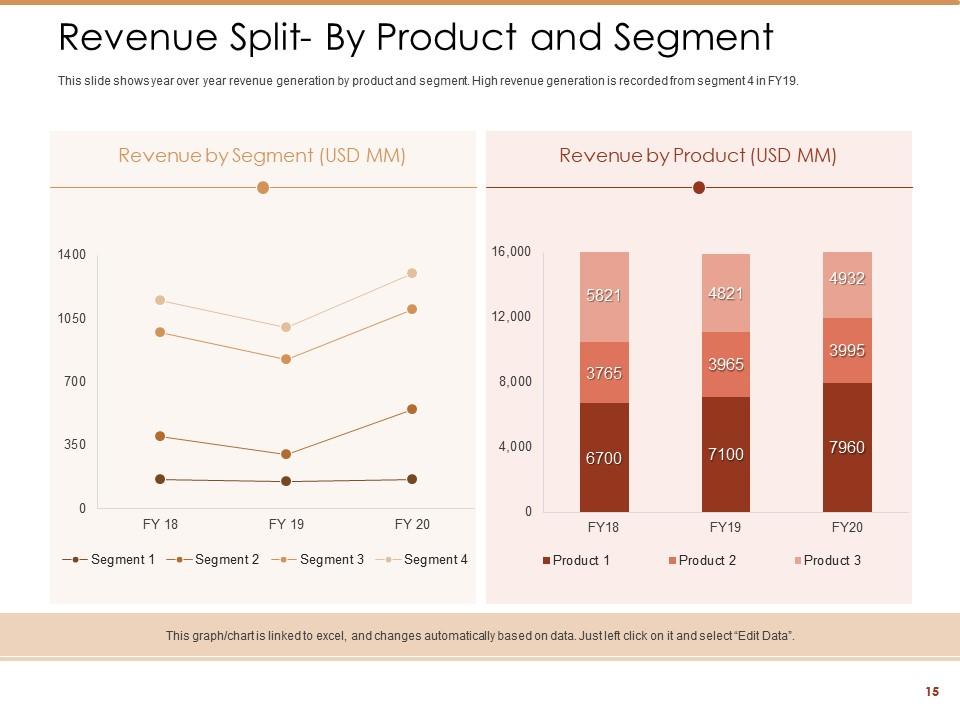
Slide 15: This slide presents the Revenue Split- By Product and Segment. It shows the year-over-year revenue generation by product and segment.
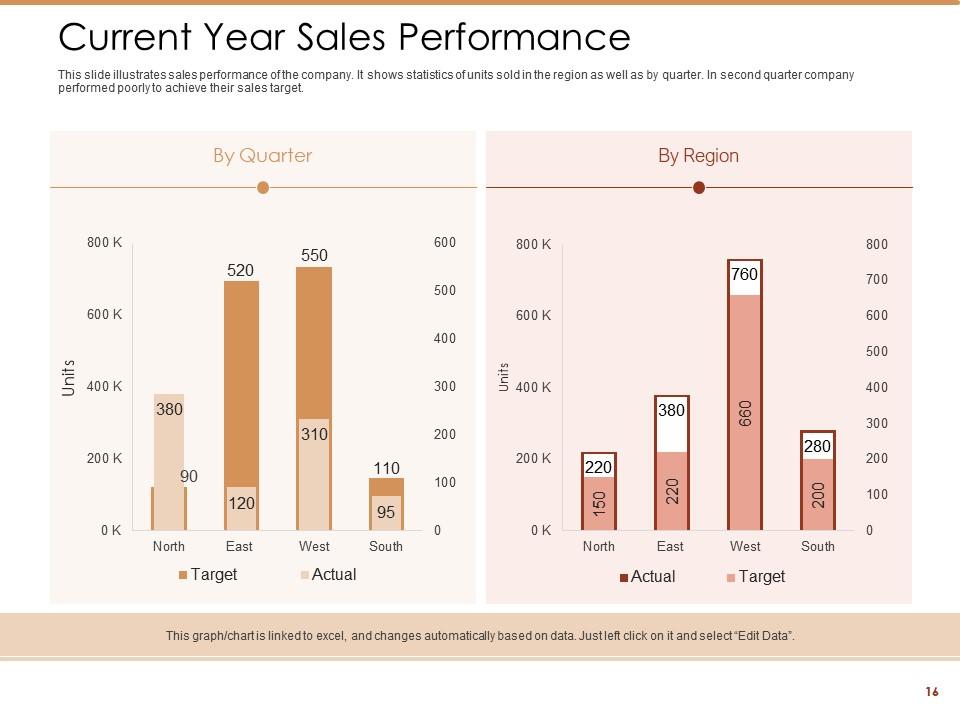
Slide 16: This slide presents the Current Year Sales Performance. It illustrates the sales performance of the company.
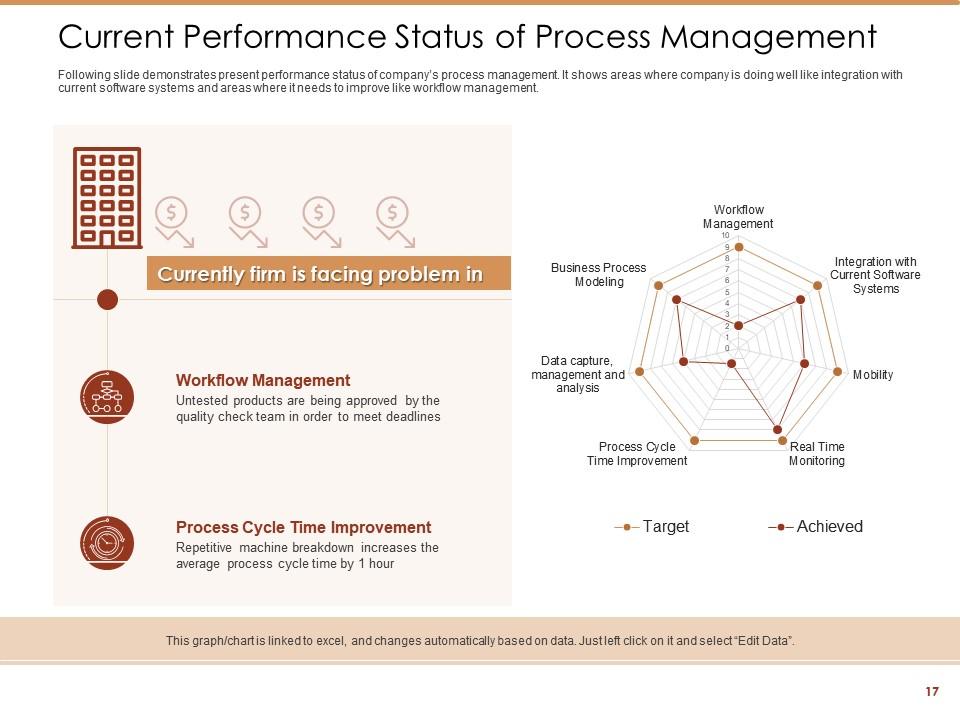
Slide 17: This slide presents the Current Performance Status of Process Management. It demonstrates the present performance status of the company’s process management.
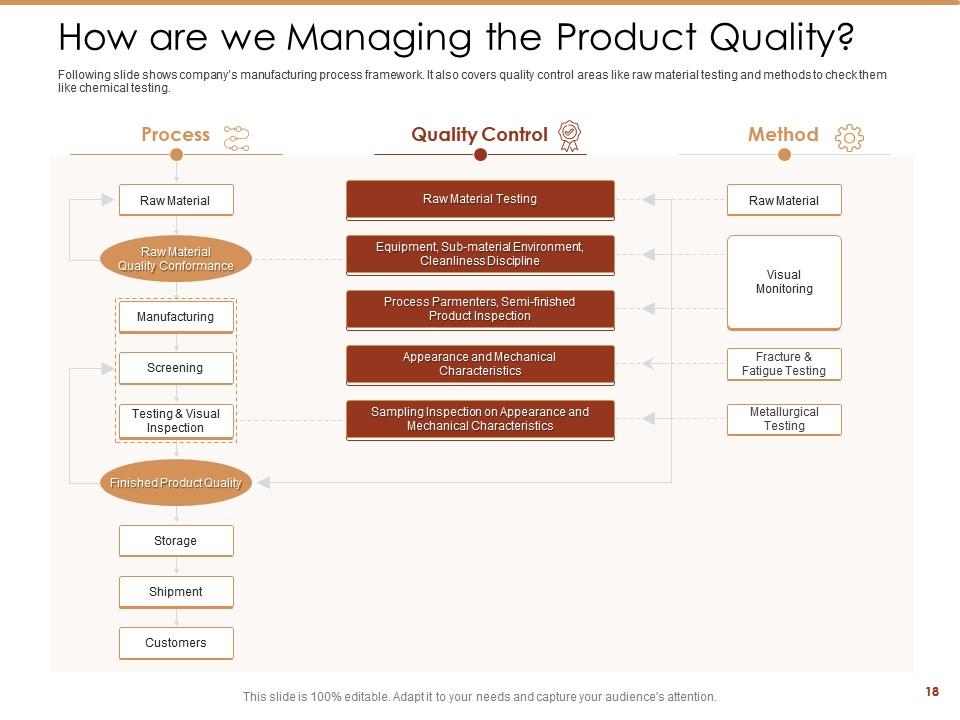
Slide 18: This slide presents How are we Managing Product Quality? It shows the company’s manufacturing process framework.
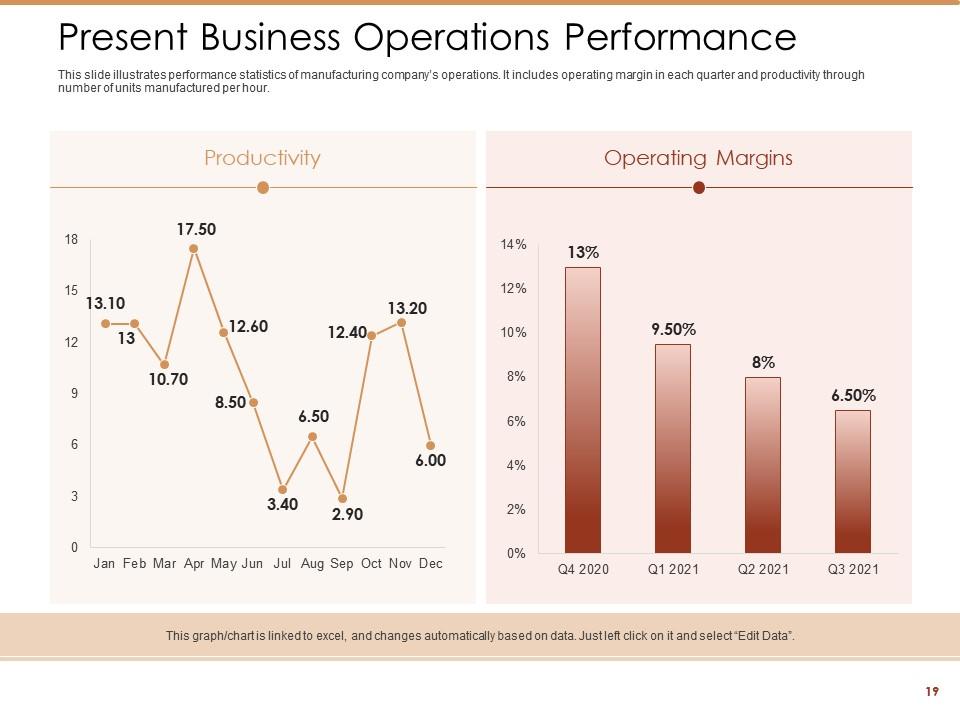
Slide 19: This slide presents the Present Business Operations Performance. It illustrates performance statistics of manufacturing company’s operations.
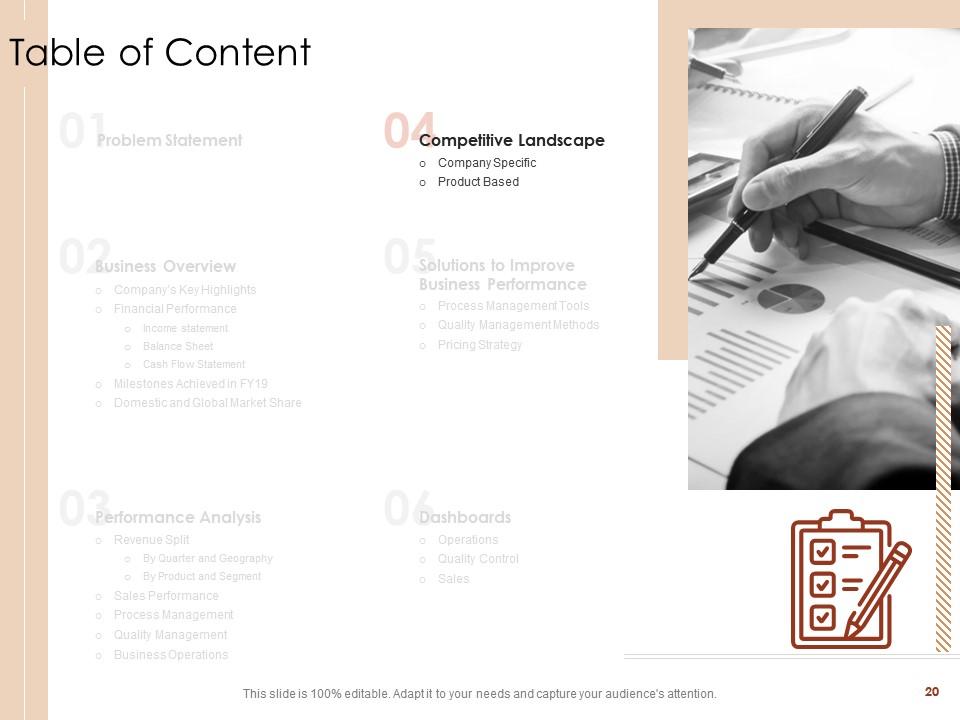
Slide 20: This is a table of content slide showing the Competitive Landscape. It includes - Company Specific and Product Based.
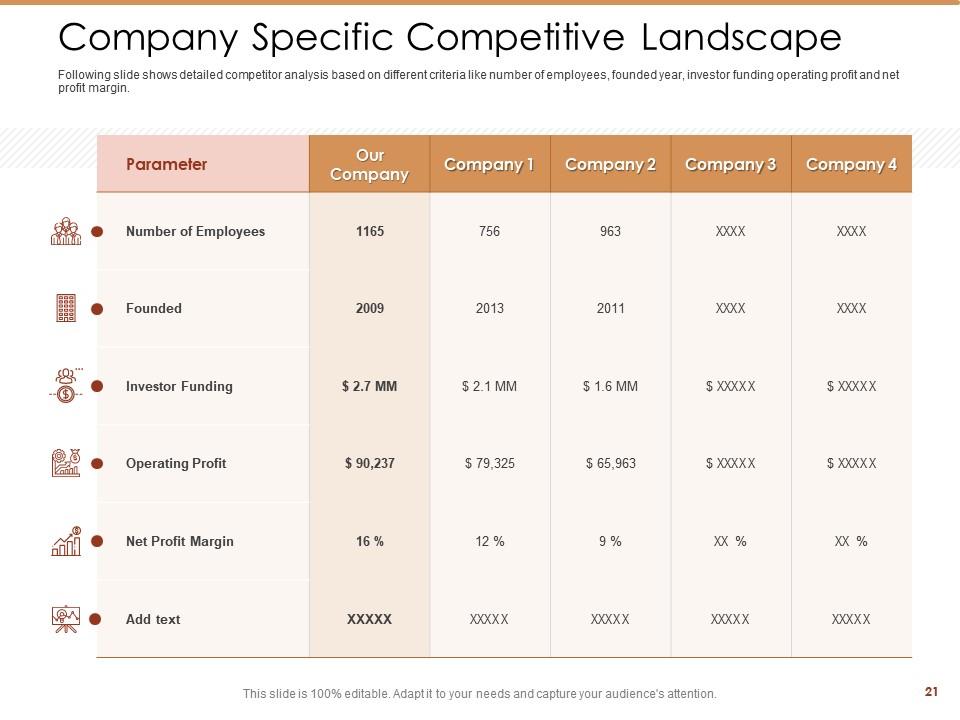
Slide 21: This slide presents the Company Specific Competitive Landscape. It shows detailed competitor analysis based on different criteria like the number of employees, founded year, investor funding operating profit, and net profit margin.
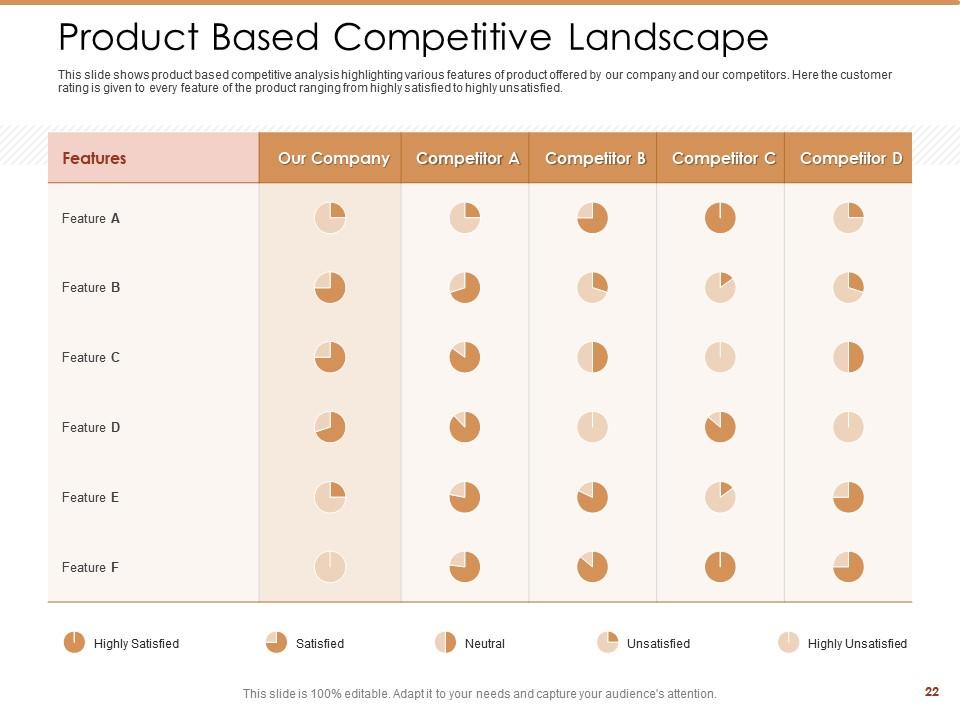
Slide 22: This slide presents the Product-Based Competitive Landscape. It shows product-based competitive analysis highlighting various features of products offered by our company and our competitors.
Slide 23: This is a table of content slide showing Solutions to Improve Business Performance. It includes - Process Management Tools, Quality Management Methods, and Pricing Strategy.
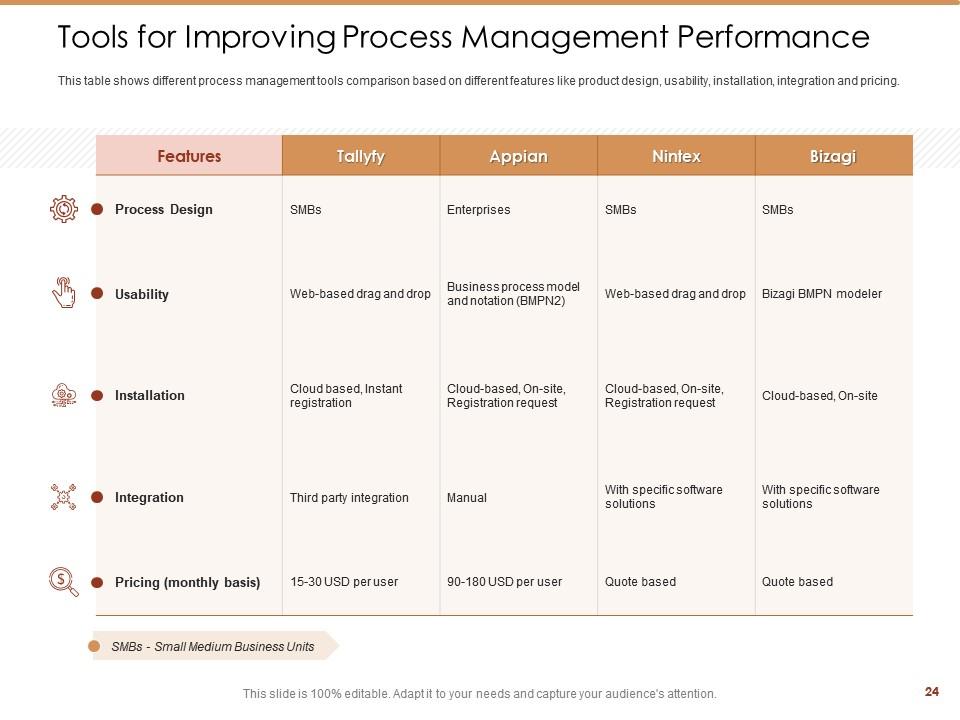
Slide 24: This slide presents the Tools for Improving Process Management Performance. It shows different process management tools comparison based on different features like product design, usability, installation, integration, and pricing.
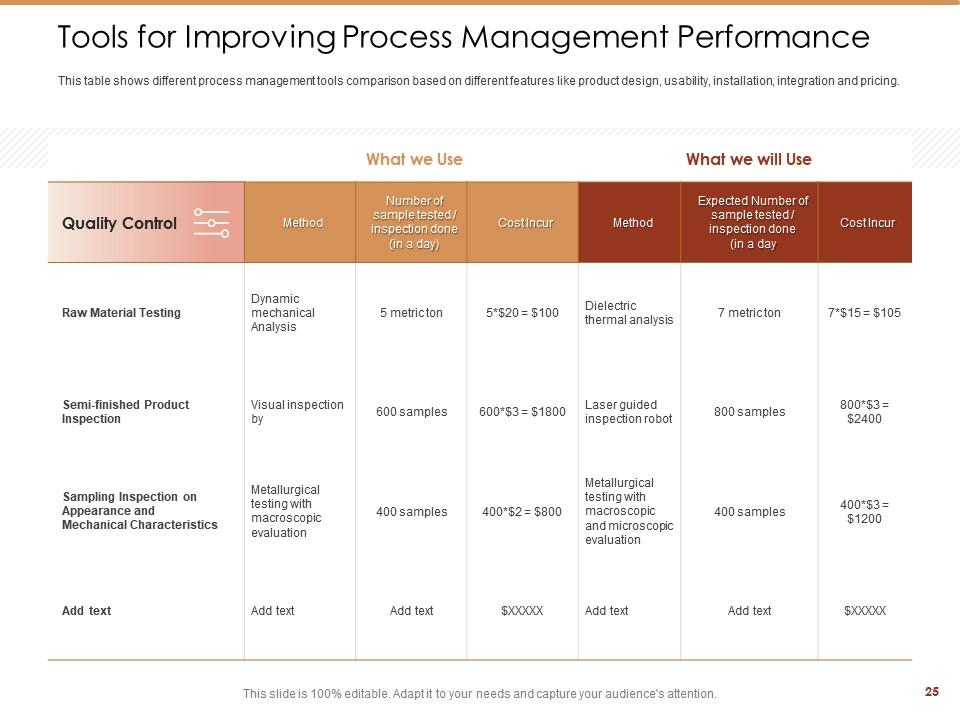
Slide 25: This slide presents the Tools for Improving Process Management Performance. It shows different process management tools comparison based on different features like product design, usability, installation, integration, and pricing.
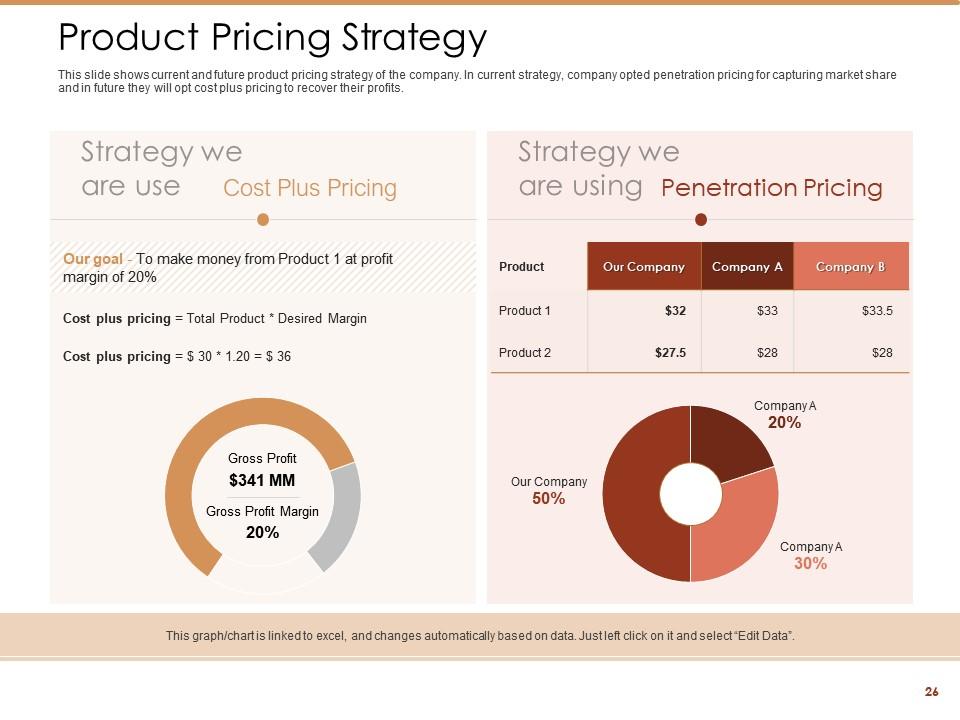
Slide 26: This slide presents the Product Pricing Strategy. It shows the current and future product pricing strategy of the company.
Slide 27: This is a table of content slide showing Dashboards. It includes – Operations, and Quality Control, and Sales.
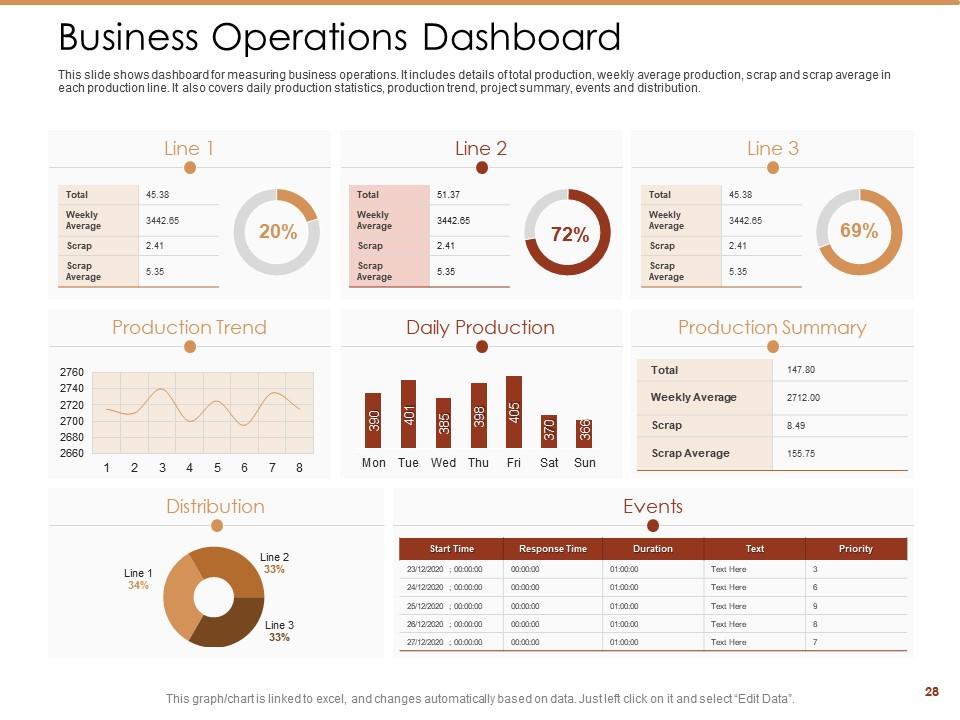
Slide 28: This slide presents the Business Operations Dashboard. It shows a dashboard for measuring business operations. It includes details of total production, weekly average production, scrap and scrap average in each production line.
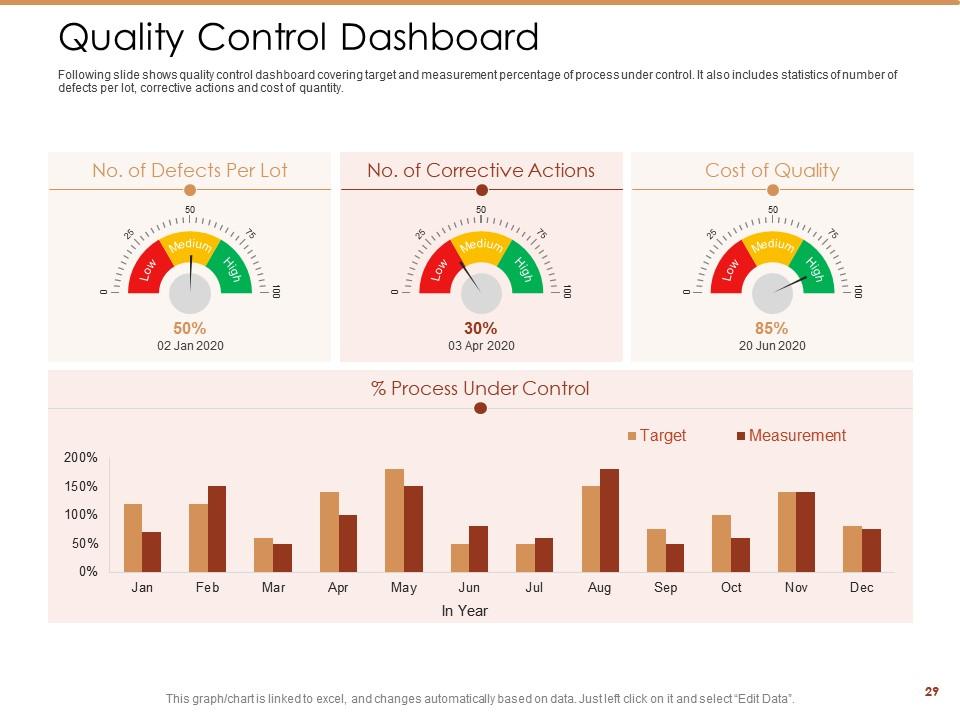
Slide 29: This slide presents the Quality Control Dashboard. It shows a quality control dashboard covering the target and measurement percentage of the process under control.
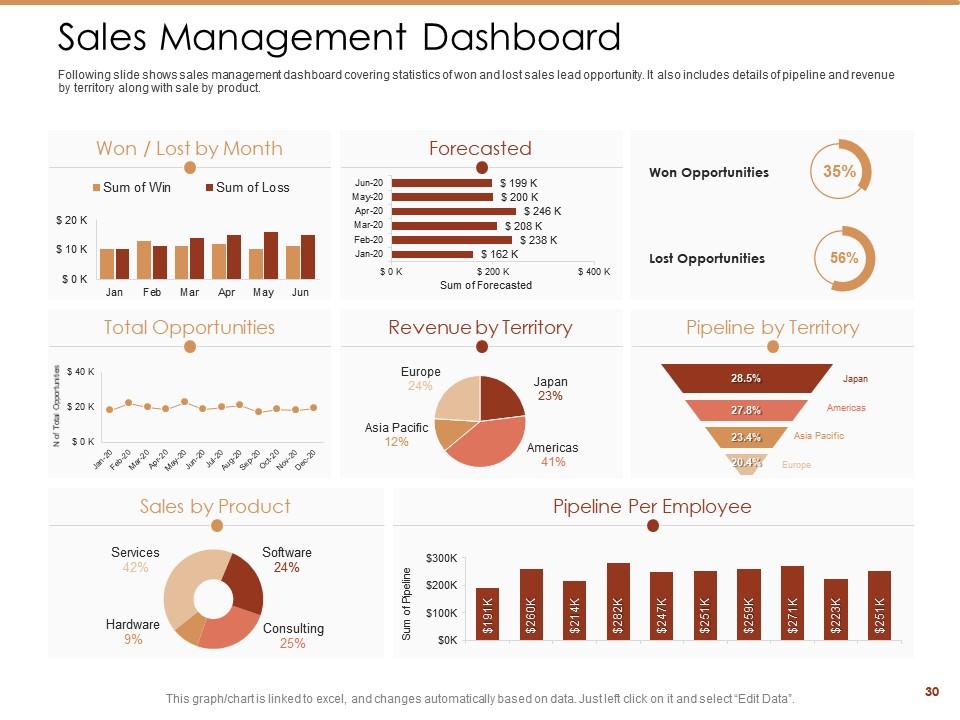
Slide 30: This slide presents the Sales Management Dashboard. It shows a sales management dashboard covering statistics of won and lost sales lead opportunities.
Slide 31: This is the Icons Slide for Manufacturing Business Analysis.
Slide 32: This slide introduces Graphs & Charts.
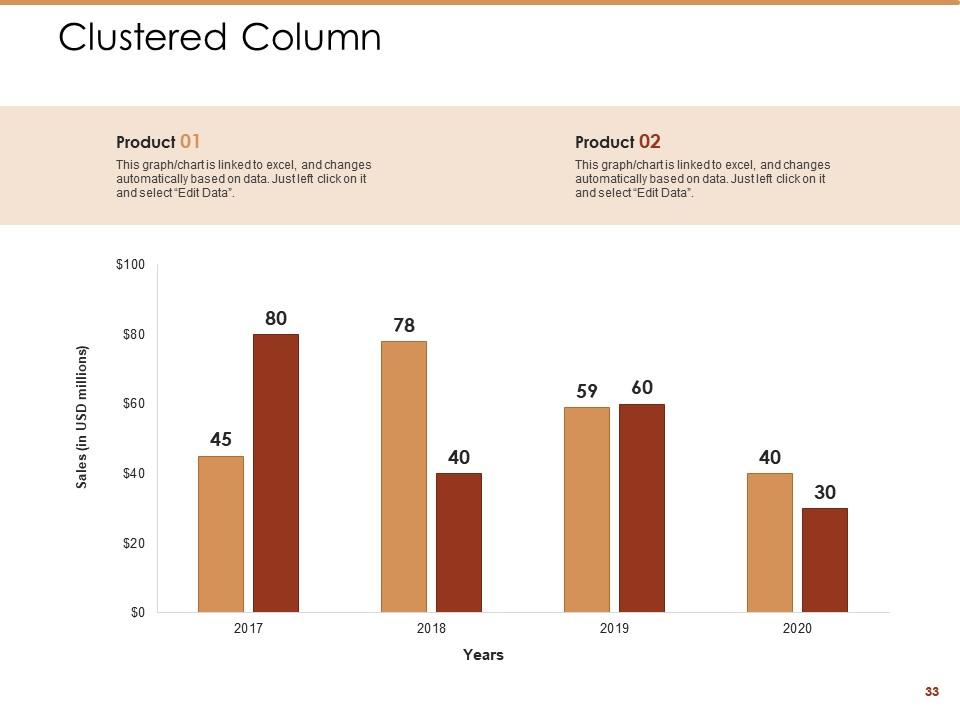
Slide 33: This slide shows a Clustered Column that compares 2 products’ sales over a timeline of years.
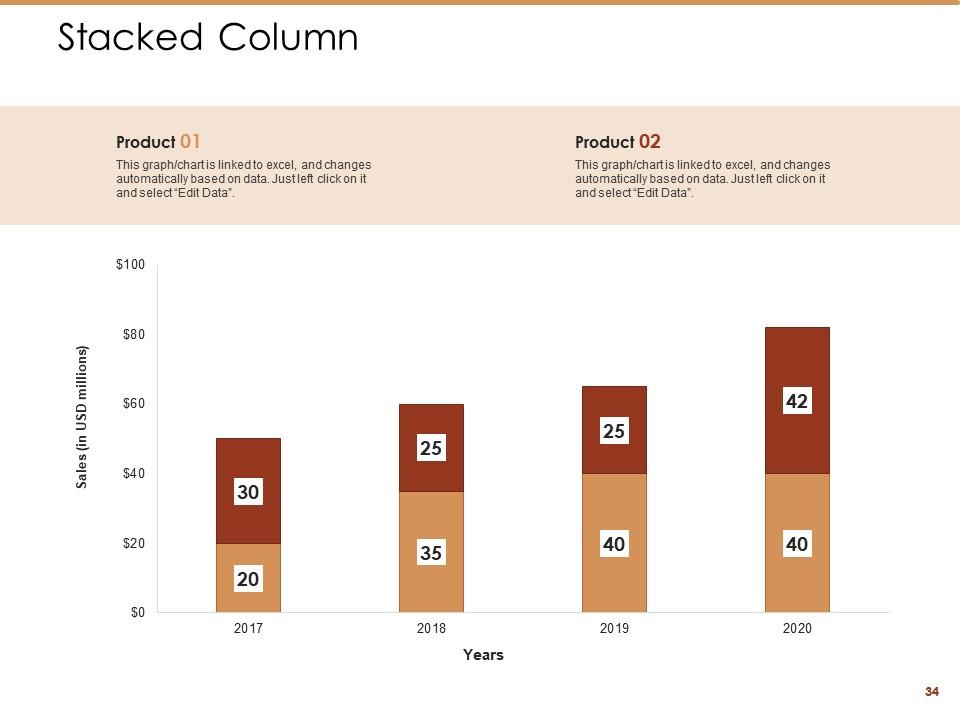
Slide 34: This slide shows a Stacked Column that compares 2 products’ sales over a timeline of years.
Slide 35: This slide introduces the Additional Slides.
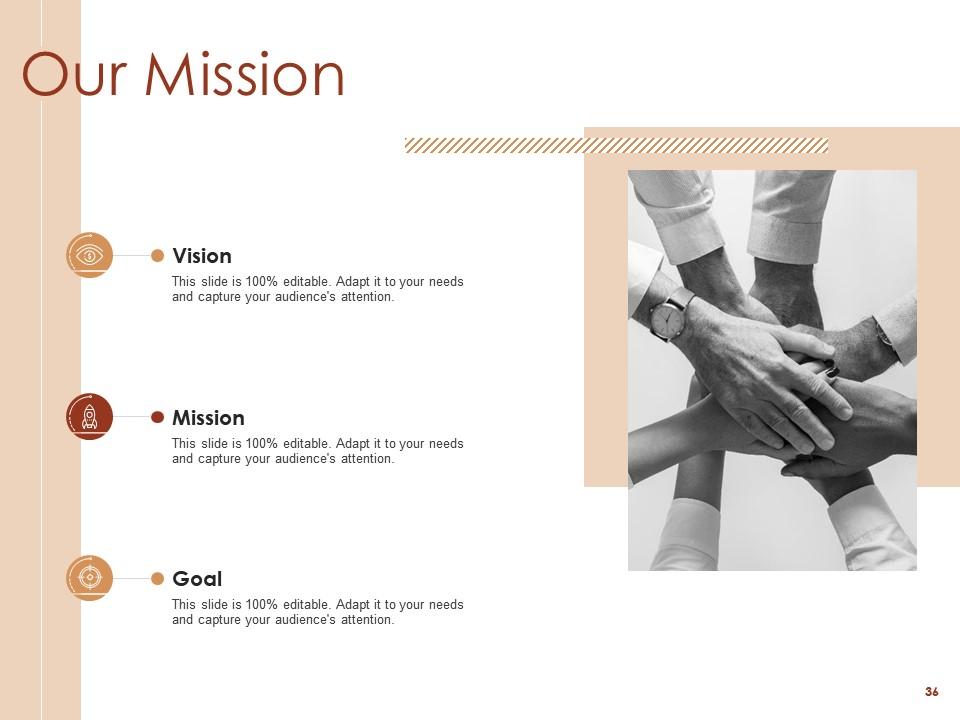
Slide 36: This slide provides the Mission for the entire company. This includes the vision, the mission, and the goal.
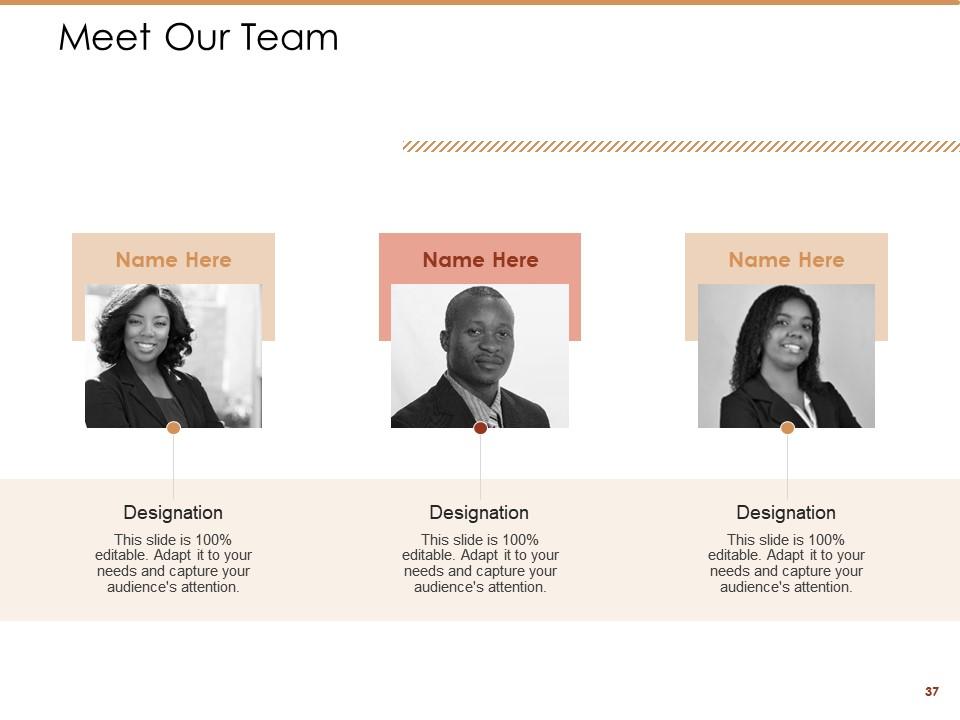
Slide 37: This slide shows the members of the company team with their name, designation, and photo.
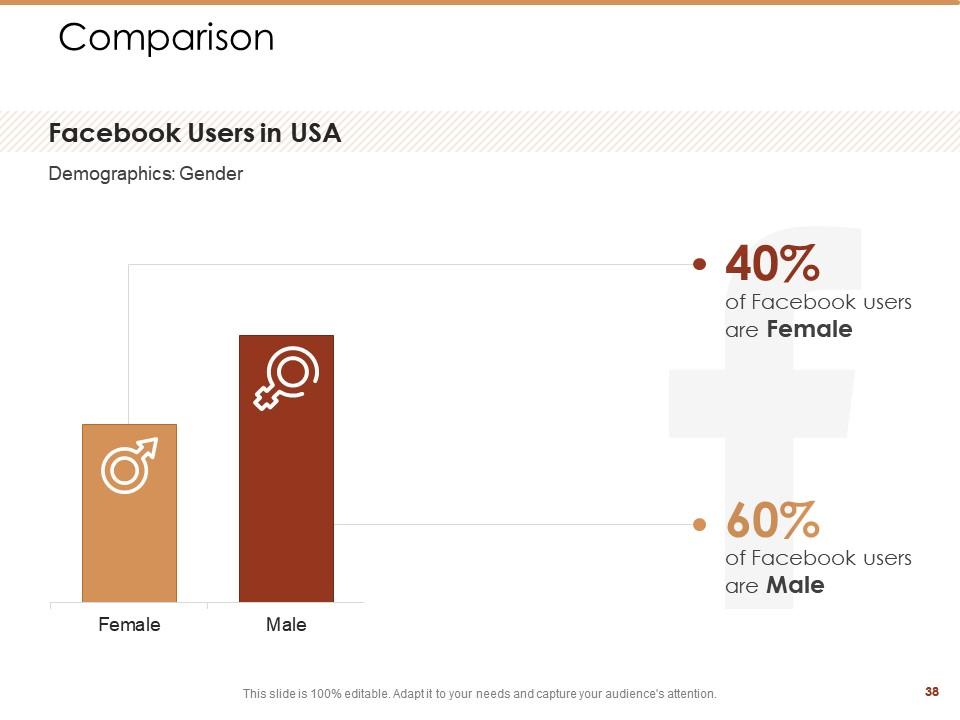
Slide 38: This slide Comparison shows the comparison between the percentage of male and female Facebook users.
Slide 39: This slide contains the information about the company aka the ‘About Us’ section. This includes the Value Clients, the Target Audience, and Preferred by Many.
Slide 40: This slide is a Timeline template to showcase the progress of the steps of a project with time.
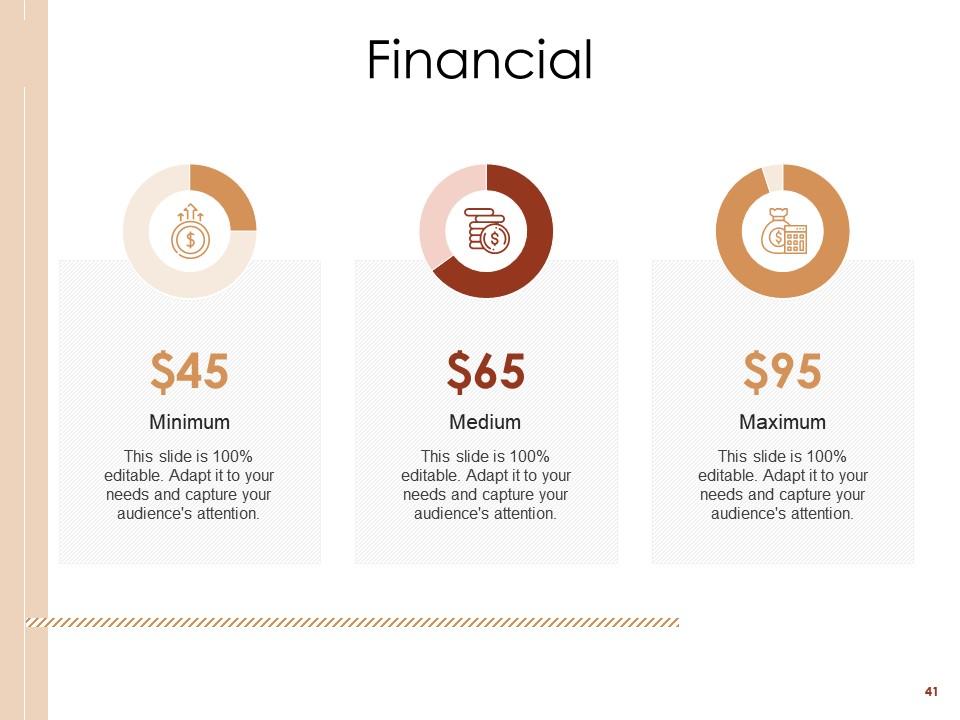
Slide 41: This slide presents the Financial with a data’s numbers at minimum, medium, and maximum percentage.
Slide 42: This is the Quotes slide. Add your favorite quote here.
Slide 43: This is a Thank You slide where details such as the address, contact number, email address are added.
Manufacturing Business Analysis Powerpoint Presentation Slides with all 43 slides:
Use our Manufacturing Business Analysis Powerpoint Presentation Slides to effectively help you save your valuable time. They are readymade to fit into any presentation structure.
-
Great designs, Easily Editable.
-
Designs have enough space to add content.
-
Easy to edit slides with easy to understand instructions.
-
Great product with effective design. Helped a lot in our corporate presentations. Easy to edit and stunning visuals.
-
Designs have enough space to add content.
-
Graphics are very appealing to eyes.
-
Enough space for editing and adding your own content.
-
Awesomely designed templates, Easy to understand.
-
Very unique, user-friendly presentation interface.
-
Content of slide is easy to understand and edit.


