Expenditure Powerpoint Presentation Slides
Our Expenditure Powerpoint Presentation Slides keep you fresh as a daisy. Fatigue will never ever hamper you.
- Google Slides is a new FREE Presentation software from Google.
- All our content is 100% compatible with Google Slides.
- Just download our designs, and upload them to Google Slides and they will work automatically.
- Amaze your audience with SlideTeam and Google Slides.
-
Want Changes to This PPT Slide? Check out our Presentation Design Services
- WideScreen Aspect ratio is becoming a very popular format. When you download this product, the downloaded ZIP will contain this product in both standard and widescreen format.
-

- Some older products that we have may only be in standard format, but they can easily be converted to widescreen.
- To do this, please open the SlideTeam product in Powerpoint, and go to
- Design ( On the top bar) -> Page Setup -> and select "On-screen Show (16:9)” in the drop down for "Slides Sized for".
- The slide or theme will change to widescreen, and all graphics will adjust automatically. You can similarly convert our content to any other desired screen aspect ratio.
Compatible With Google Slides

Get This In WideScreen
You must be logged in to download this presentation.
PowerPoint presentation slides
Our topic specific Expenditure Powerpoint Presentation Slides deck contains fourty five slides to formulate the topic with a sound understanding. This PPT deck is what you can bank upon. With diverse and professional slides at your side, worry the least for a powerpack presentation. A range of editable and ready to use slides with all sorts of relevant charts and graphs, overviews, topics subtopics templates, and analysis templates makes it all the more worth. This deck displays creative and professional looking slides of all sorts. Whether you are a member of an assigned team or a designated official on the look out for impacting slides, it caters to every professional field.
People who downloaded this PowerPoint presentation also viewed the following :
Content of this Powerpoint Presentation
Slide 1: This slide introduces Expenditure. State the name of your company and proceed.
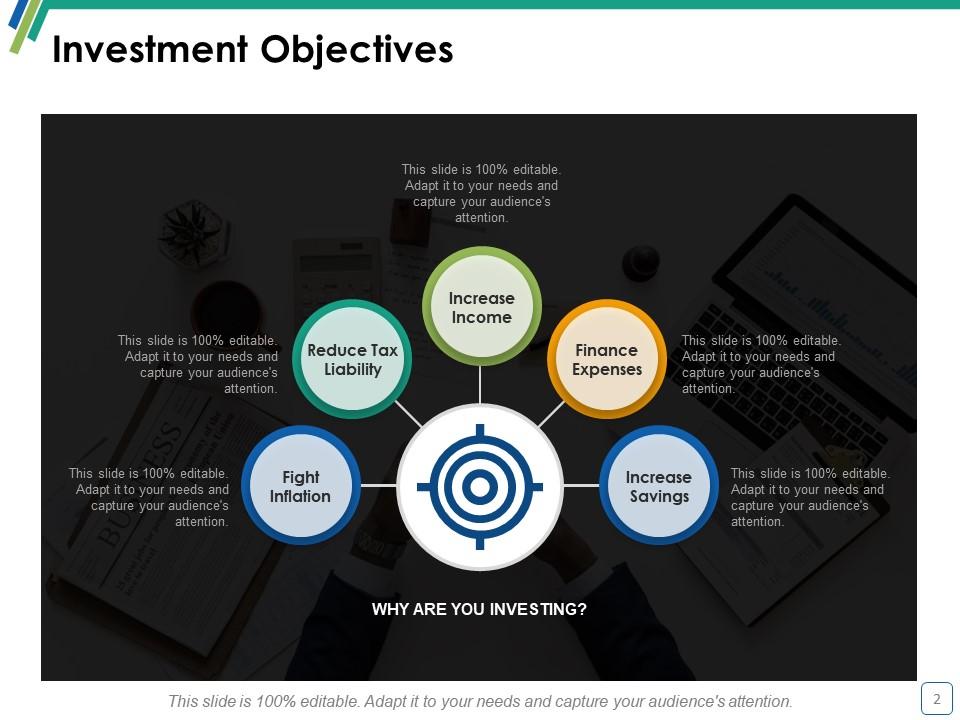
Slide 2: This slide shows Investment Objectives such as- Increase Income, Finance Expenses, Increase Savings, Fight Inflation, Reduce Tax Liability.
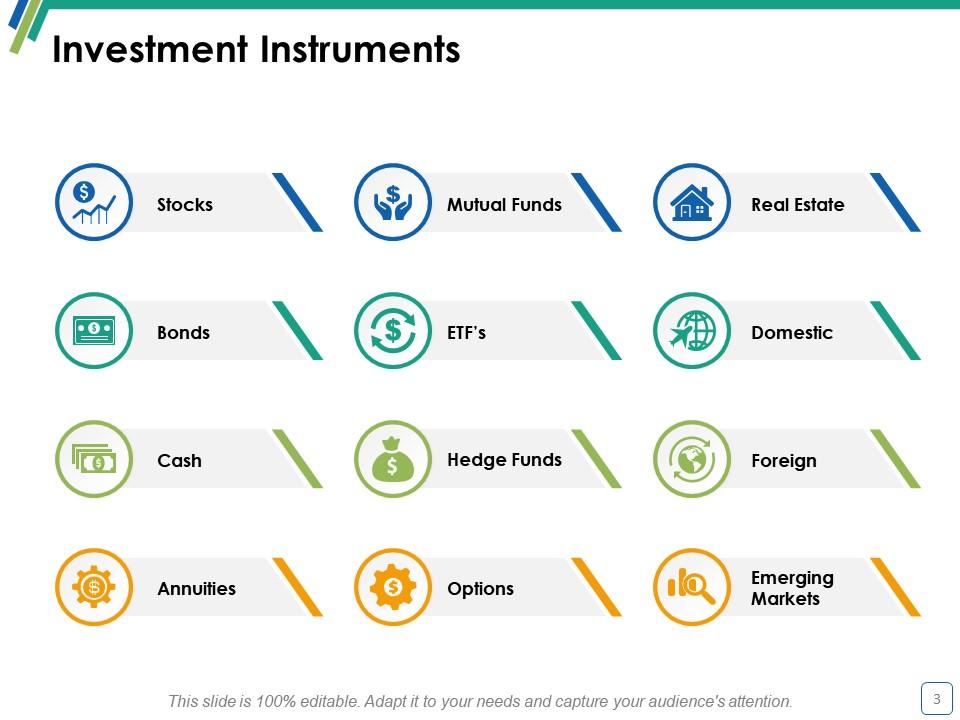
Slide 3: This slide shows Investment Instruments- Stocks, Bonds, Cash, Annuities, Mutual Funds, ETF’s, Hedge Funds, Options, Real Estate, Domestic, Foreign, Emerging Markets.
Slide 4: This slide shows Mutual Funds with imagery and text boxes.
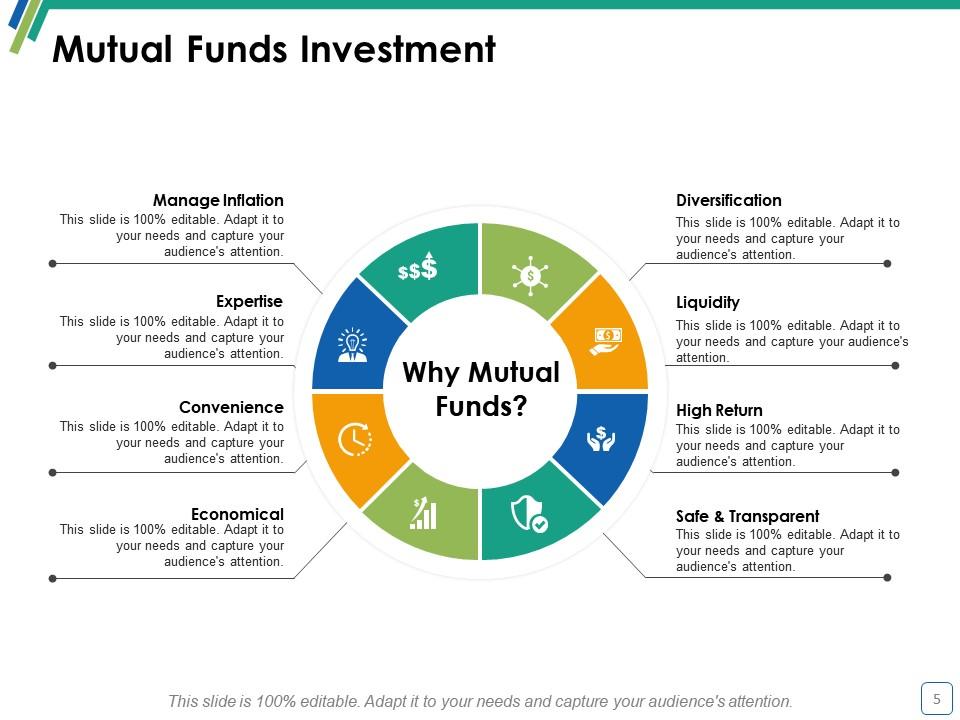
Slide 5: This slide shows Mutual Funds Investment with the following components- Manage Inflation, Expertise, Convenience, Economical, Diversification, Liquidity, High Return, Safe & Transparent.
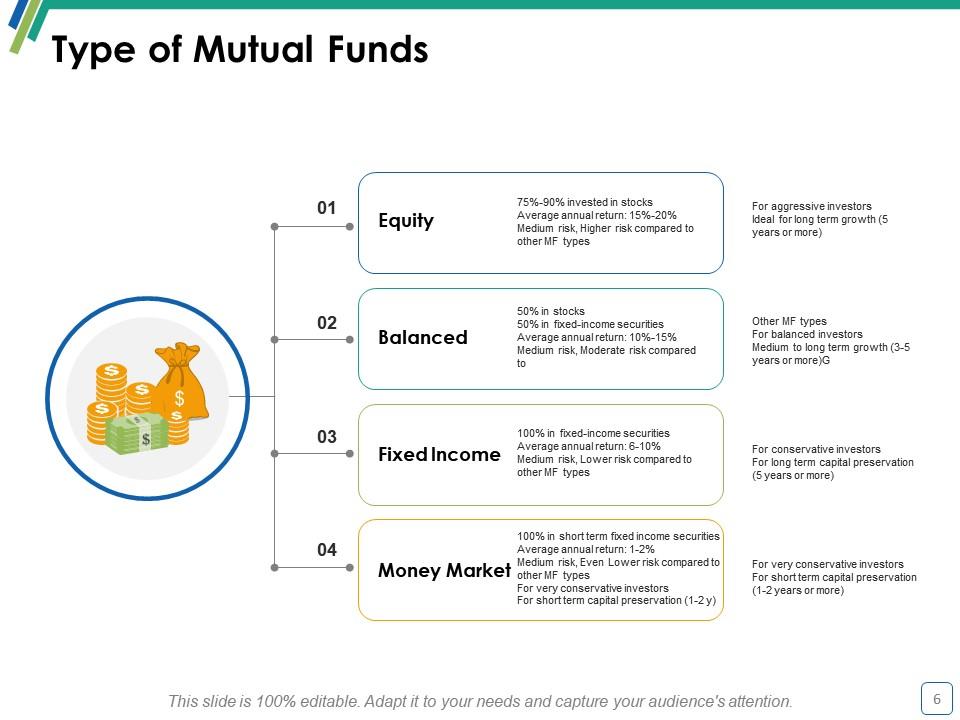
Slide 6: This slide shows five Type of Mutual Funds- Balanced, Fixed Income, Money Market, Equity.
Slide 7: This slide shows Top 5 Mutual Funds to Invest in 2018-19 in a tabular form. Use as per your requirement.
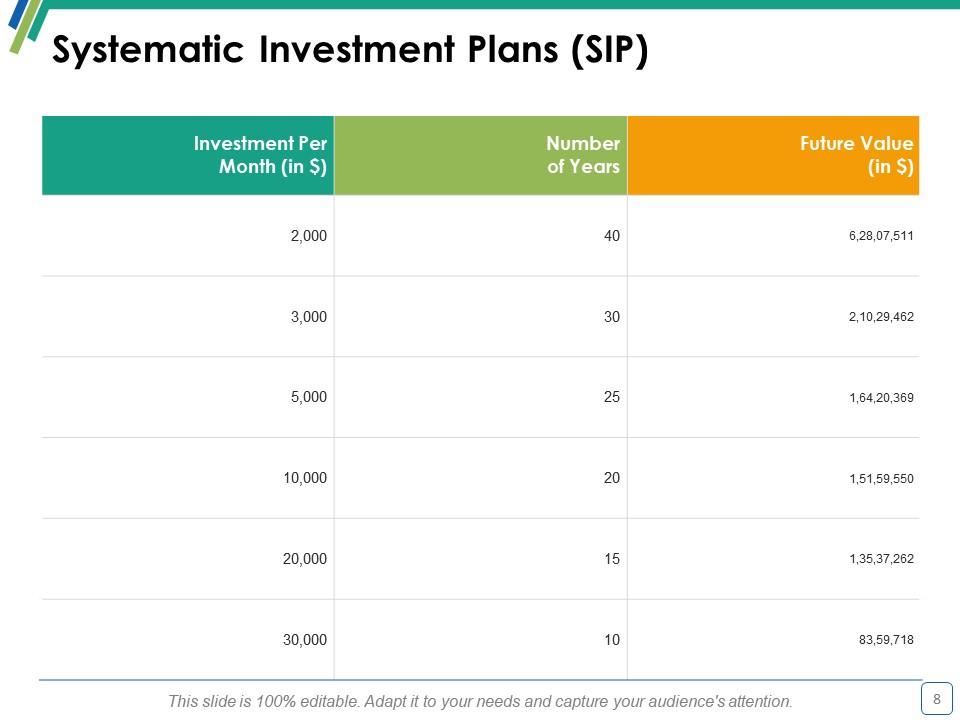
Slide 8: This slide shows Systematic Investment Plans (SIP) table.
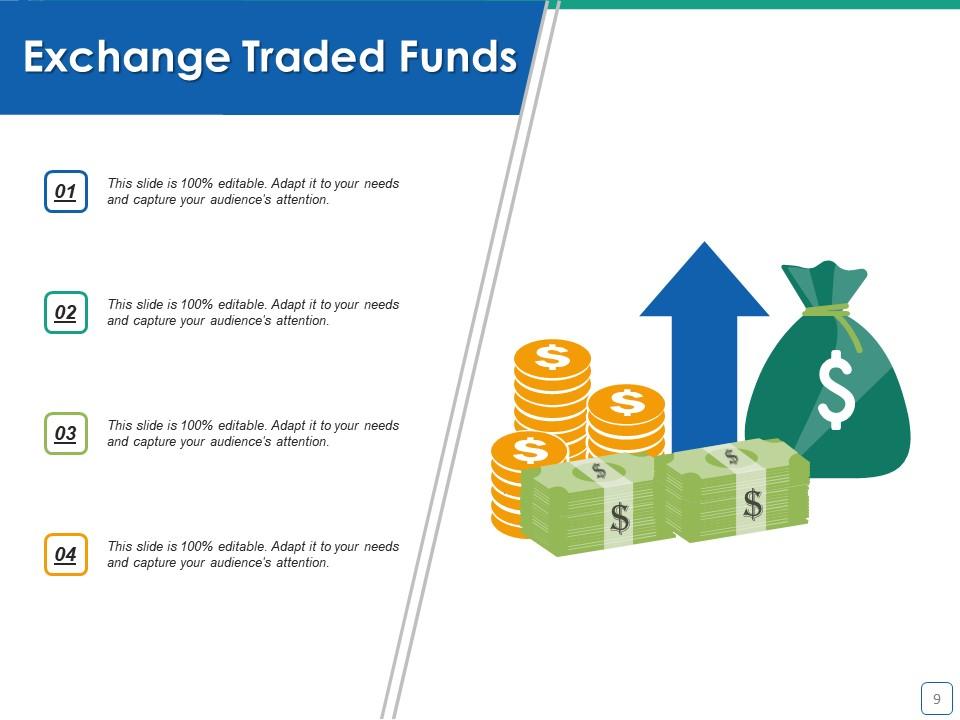
Slide 9: This slide shows Exchange Traded Funds with imagery and text boxes. Add in your own as per your requirement.
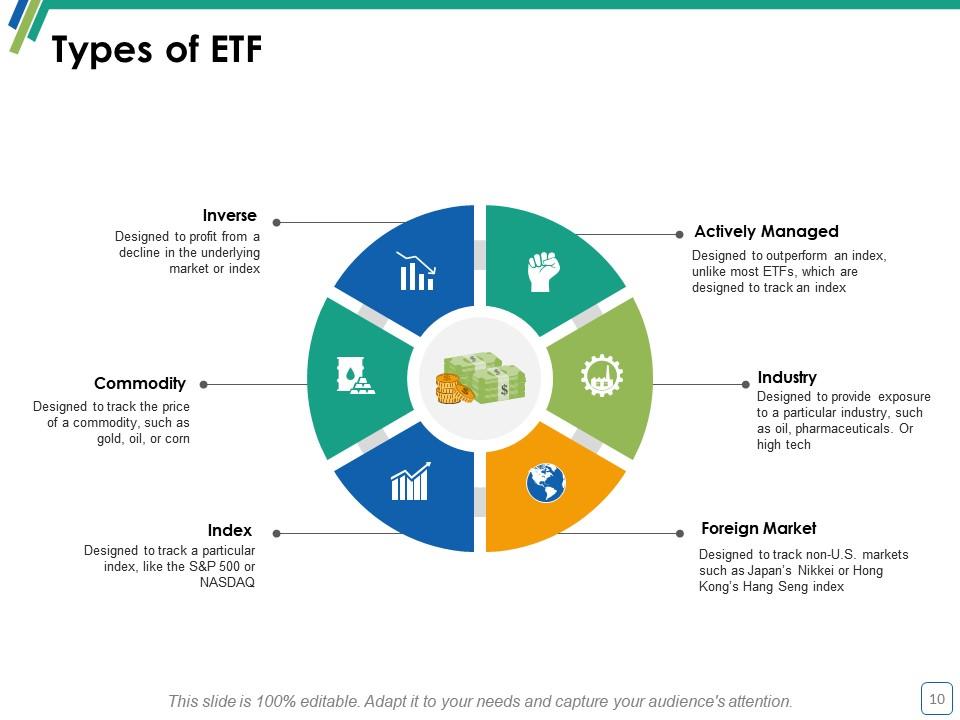
Slide 10: This slide shows Types of ETF stated as- Commodity, Inverse, Index, Actively Managed, Industry, Foreign Market.
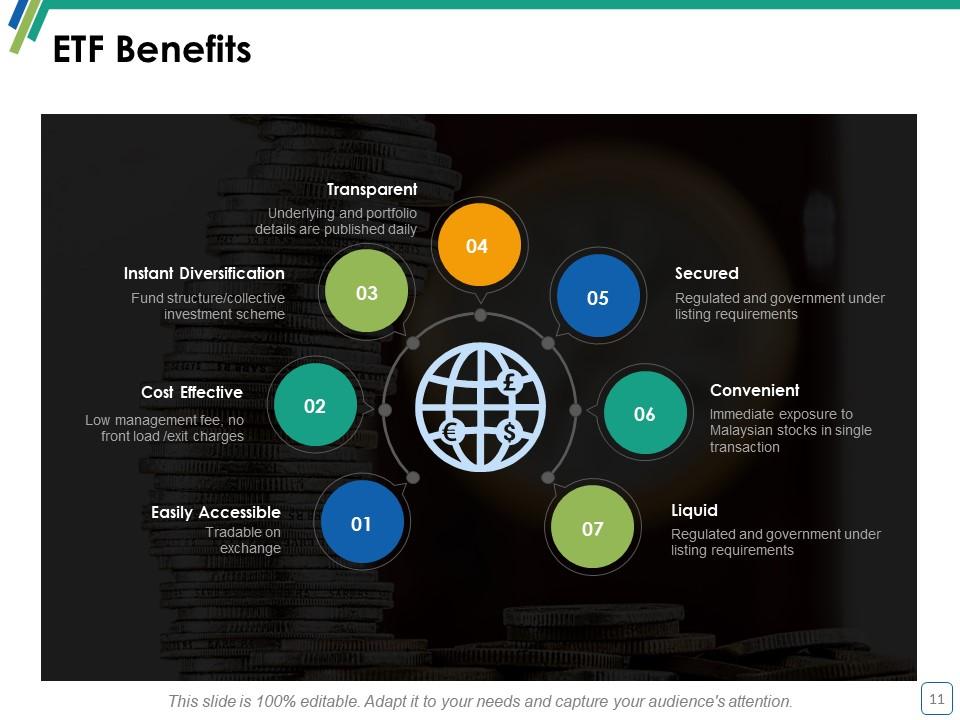
Slide 11: This slide shows ETF Benefits which include- Easily Accessible, Cost Effective, Instant Diversification, Transparent, Secured, Convenient, Liquid.
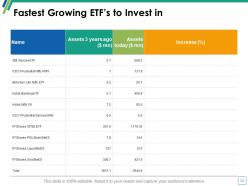
Slide 12: This slide presents the stats of Fastest growing ETF’s to invest in a tabular form.
Slide 13: This slide is titled as Bonds.
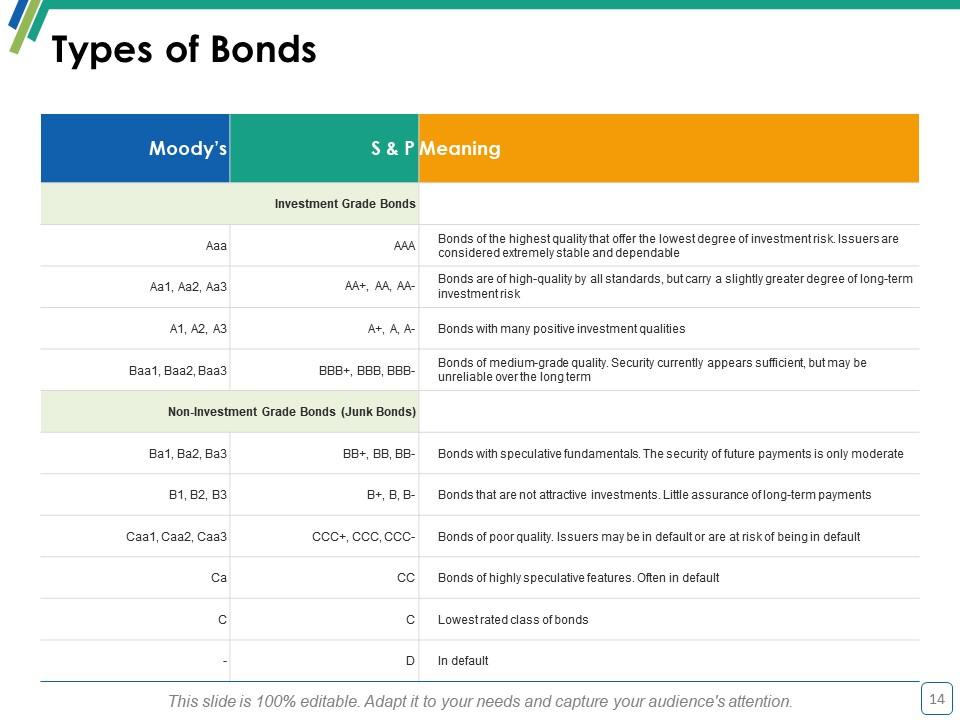
Slide 14: This slide shows Types of Bonds.
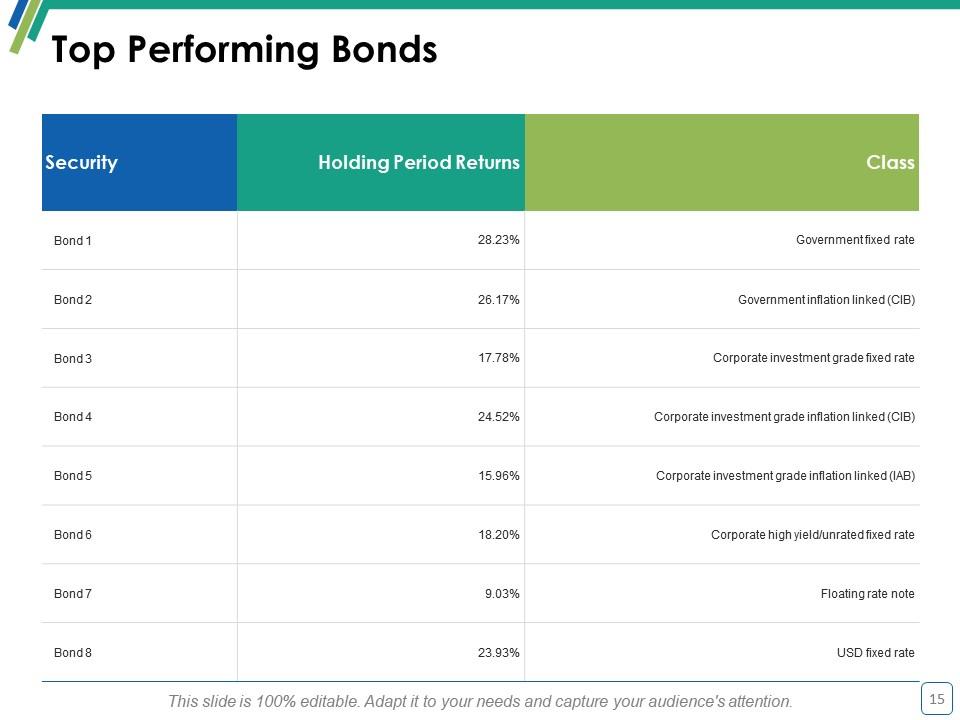
Slide 15: This slide shows Top Performing Bonds as per the following parameters to be used for analysis- Security, Holding Period Returns, Class.
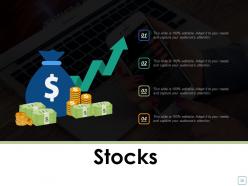
Slide 16: This slide displays Stocks with imagery and text boxes. Add relevant data in the given text boxes.
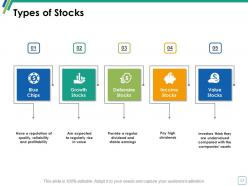
Slide 17: This slide shows Types of Stocks- Value Stocks, Blue Chips, Growth Stocks, Defensive Stocks, Income Stocks.
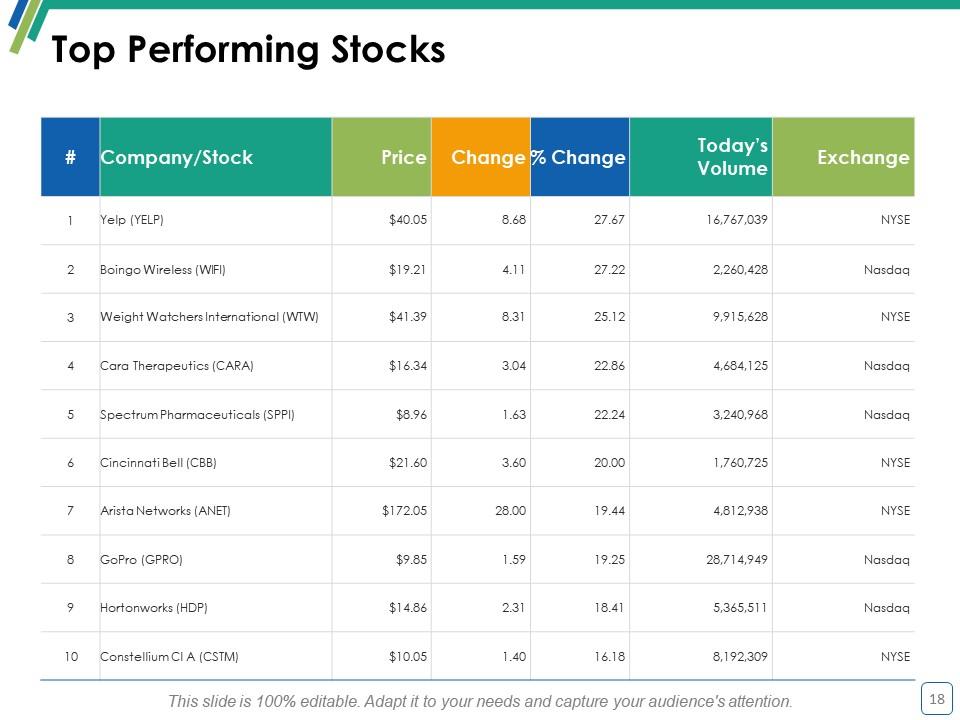
Slide 18: This slide presents Top Performing Stocks data in a tabular form.
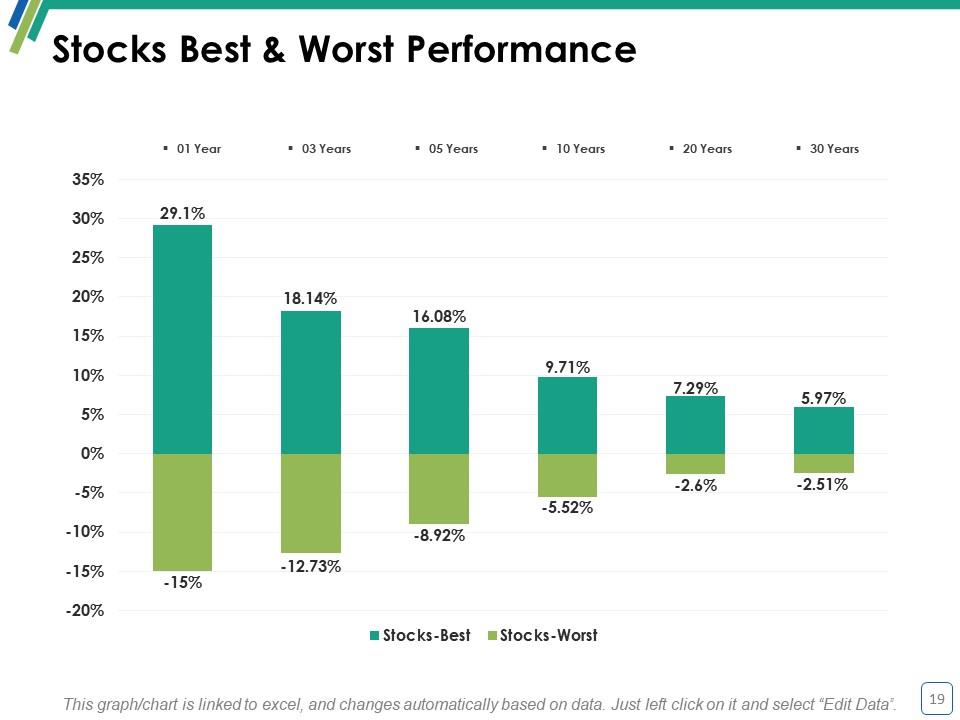
Slide 19 This slide displays Stocks Best & Worst Performance graphically. Use it to showcase your own stock performance.
Slide 20: This slide shows Hedge Funds with imagery and text boxes.
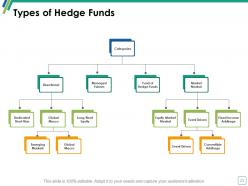
Slide 21: This slide shows Types of Hedge Funds flow chart. We have mentioned a few of its categories which you can make use of according to your need.
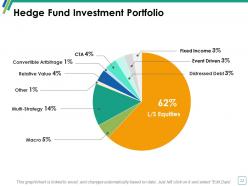
Slide 22: This slide shows Hedge Fund Investment Portfolio pie chart.
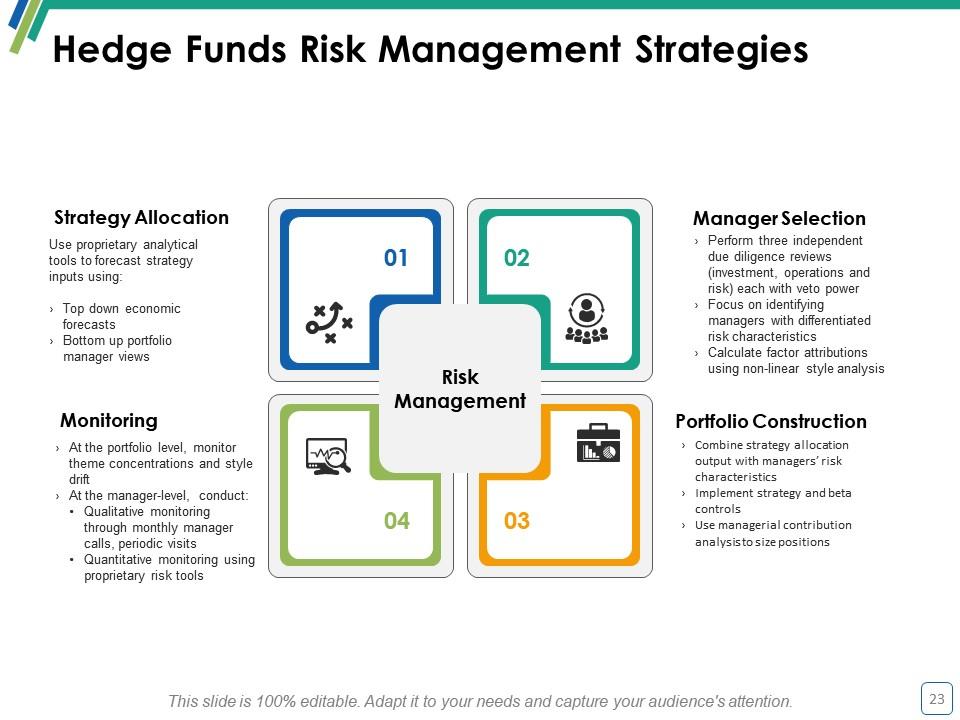
Slide 23: This slide presents Hedge Funds Risk Management Strategies with Risk Management which further shows- Strategy Allocation, Monitoring, Manager Selection, Portfolio Construction.
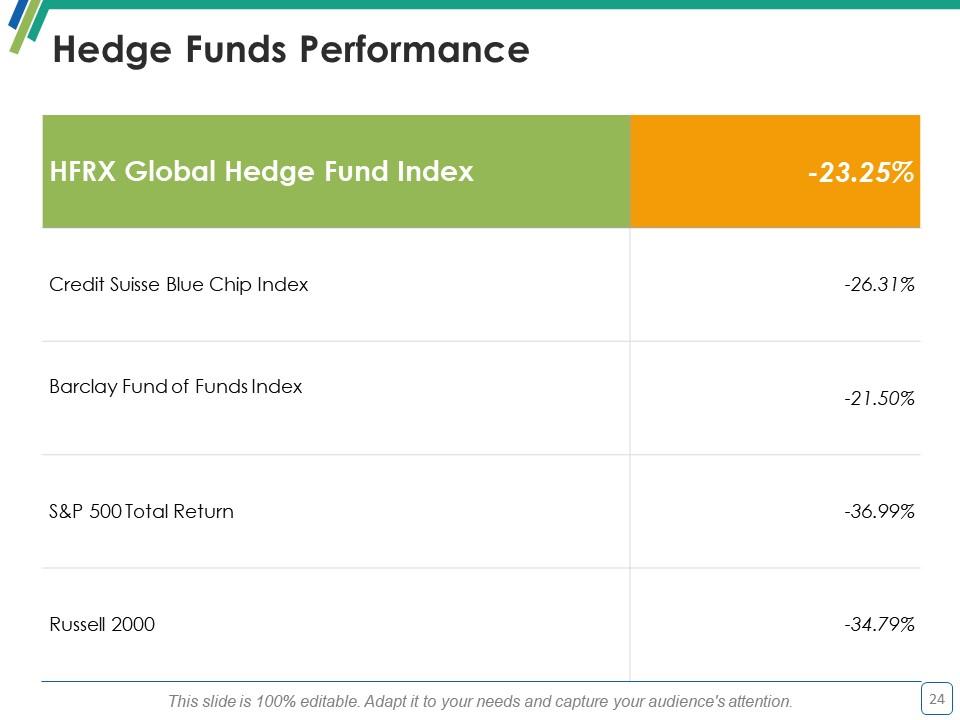
Slide 24: This slide shows Hedge Funds Performance in a tabular form.
Slide 25: This is an Expenditure Icon Slide. Alter these icons as per your requirement as use it.
Slide 26: This is a Coffee Break slide to halt. You may change it as per requirement.
Slide 27: This is an Additional Slides to proceed further. You may change the slide content as per need.
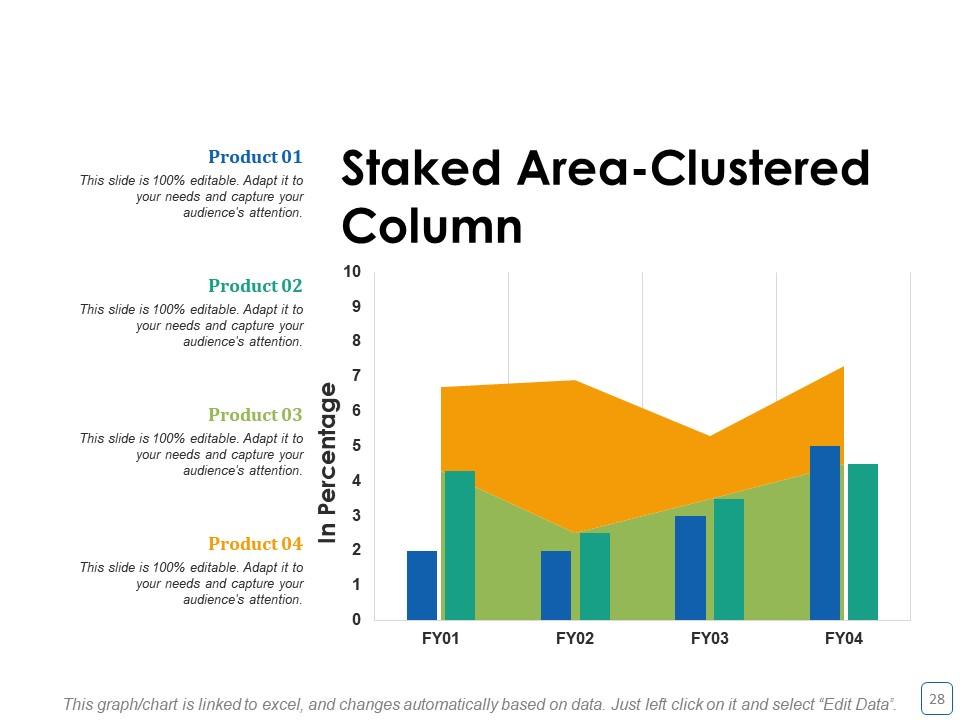
Slide 28: This is a Stacked Area- Clustered Column slide to present product/ entity comparison, specifications etc.
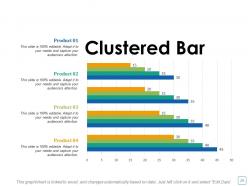
Slide 29: This slide shows a Clustered Bar for product/ entity comparison.
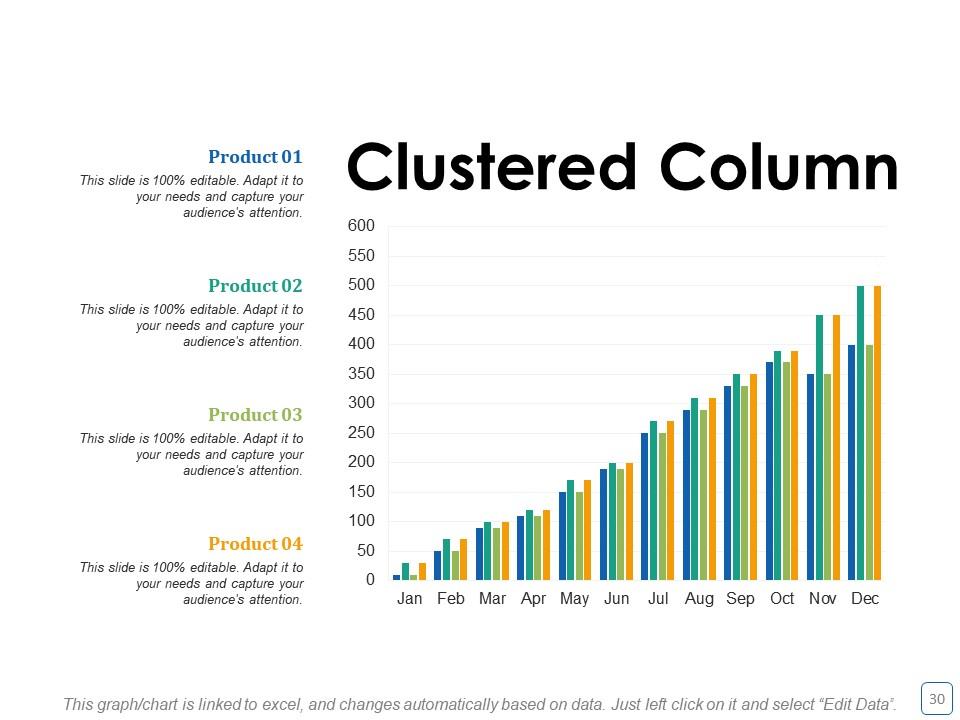
Slide 30: This is a Clustered Column chart slide to present product/ entity comparison, specifications etc.
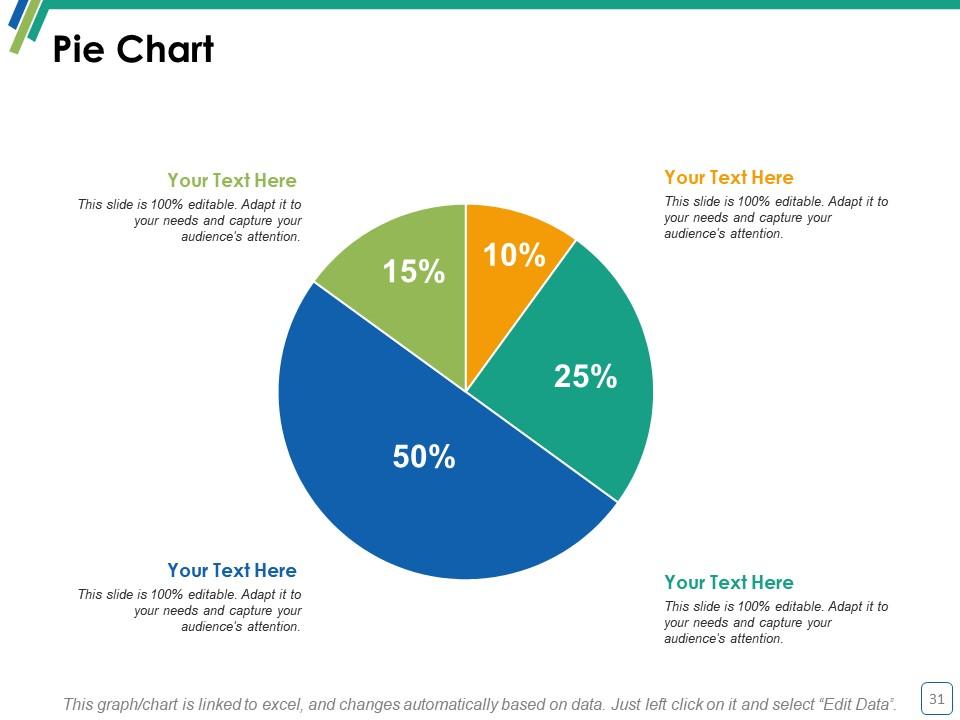
Slide 31: This is a Pie Chart slide to present product/ entity comparison, specifications etc.
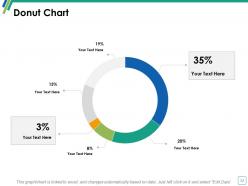
Slide 32: This is a Donut Chart slide to present product or entity comparison, information etc.
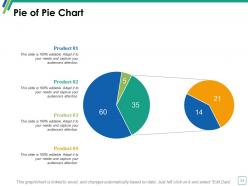
Slide 33: This is a Pie of Pie Chart slide to show product/ entity comparison, specifications etc.
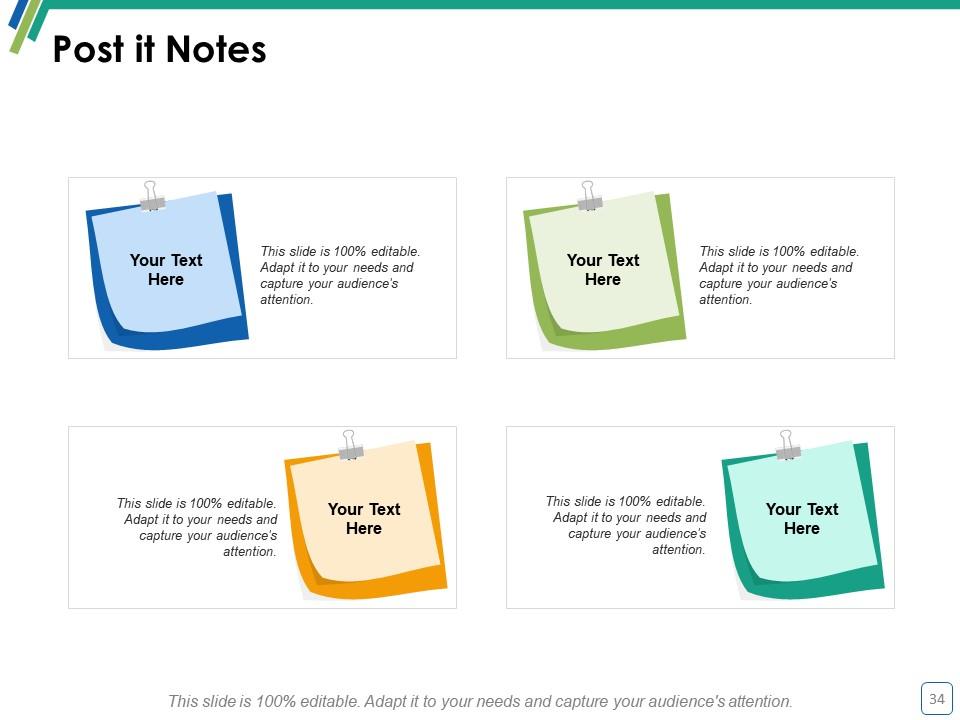
Slide 34: This is Post It Notes slide to be displayed. Show events, important piece of information, events etc. here.
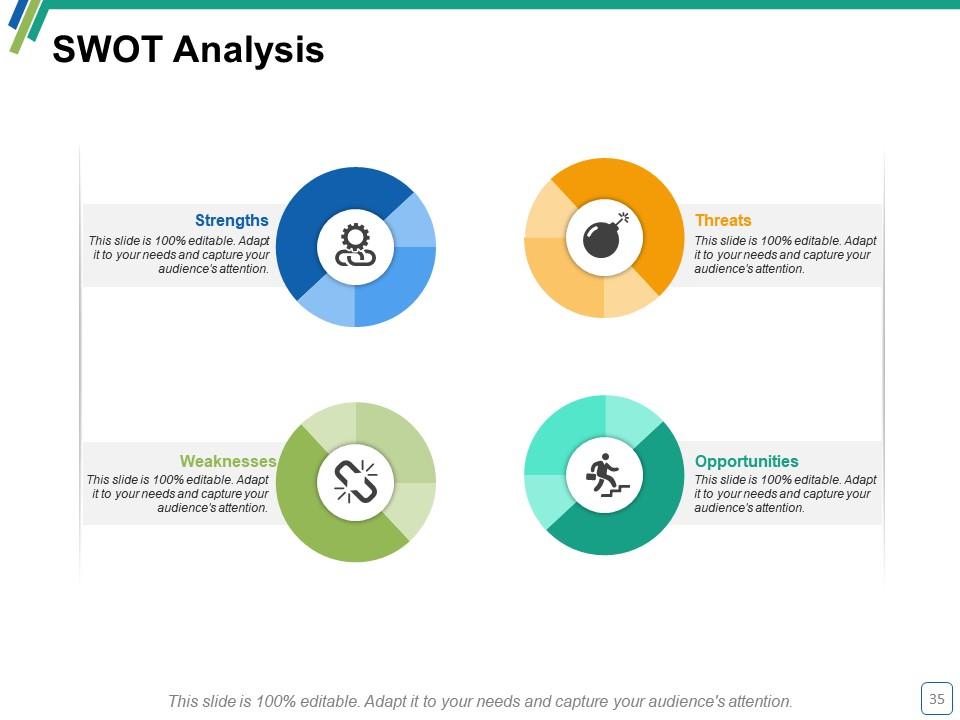
Slide 35: This slide puts forth the SWOT Analysis comprising of- Threats, Strengths, Weaknesses, Opportunities.
Slide 36: This is a News Paper slide to flash company event, news or anything to highlight.
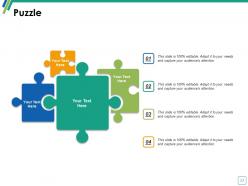
Slide 37: This is a Puzzle pieces image slide to show information, specifications etc.
Slide 38: This is a Target image slide. State targets, etc. here.
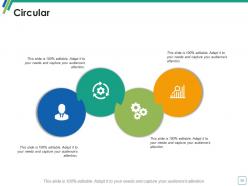
Slide 39: This is a Circular image slide to show information etc.
Slide 40: This is a creative Venn diagram slide to show information etc.
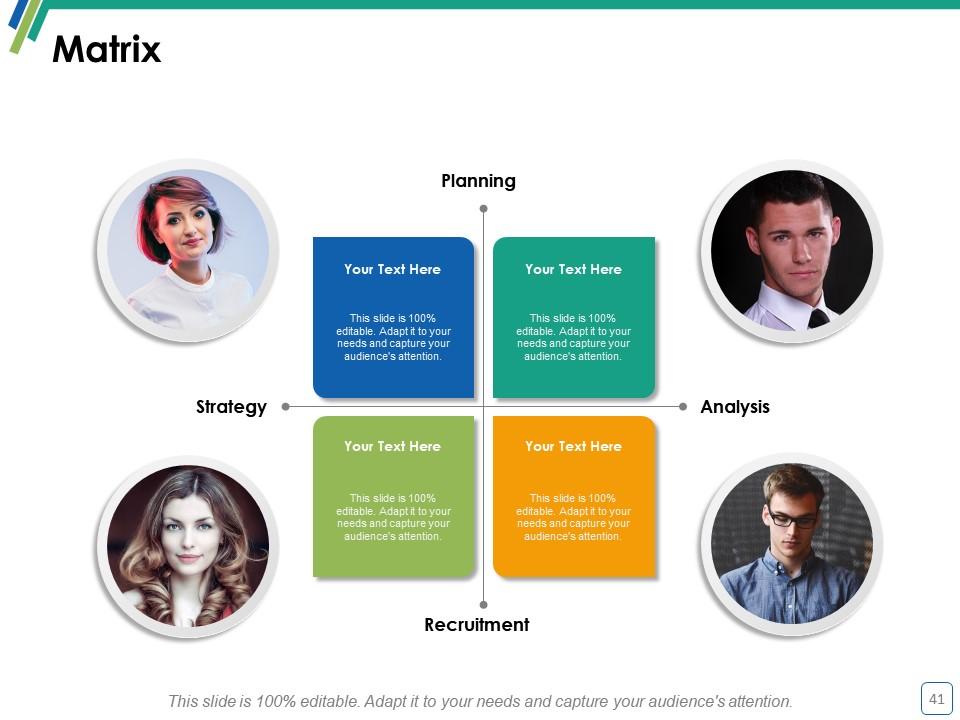
Slide 41: This is a Matrix slide to show information, specifications etc.
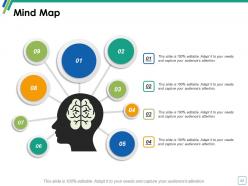
Slide 42: This is a Mind Map image slide to show behavioral segmentation, information or anything relative.
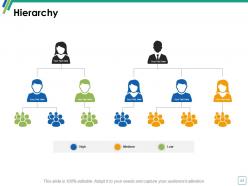
Slide 43: This is a Hierarchy slide to show information, organization structural specifications etc.
Slide 44: This slide shows a Magnifying glass image with text boxes. State information etc. here.
Slide 45: This is a Thank You slide with Address# street number, city, state, Contact Numbers, Email Address.
Expenditure Powerpoint Presentation Slides with all 45 slides:
End the dispute in an amicable fashion with our Expenditure Powerpoint Presentation Slides. Bring the controversy to a close.
No Reviews


