Financials PowerPoint Templates, Financial Statement PPT Templates
- Sub Categories
-
- 30 60 90 Day Plan
- About Us Company Details
- Action Plan
- Agenda
- Annual Report
- Audit Reports
- Balance Scorecard
- Brand Equity
- Business Case Study
- Business Communication Skills
- Business Plan Development
- Business Problem Solving
- Business Review
- Capital Budgeting
- Career Planning
- Change Management
- Color Palettes
- Communication Process
- Company Location
- Company Vision
- Compare
- Competitive Analysis
- Corporate Governance
- Cost Reduction Strategies
- Custom Business Slides
- Customer Service
- Dashboard
- Data Management
- Decision Making
- Digital Marketing Strategy
- Digital Transformation
- Disaster Management
- Diversity
- Equity Investment
- Financial Analysis
- Financial Services
- Financials
- Growth Hacking Strategy
- Human Resource Management
- Innovation Management
- Interview Process
- Knowledge Management
- Leadership
- Lean Manufacturing
- Legal Law Order
- Management
- Market Segmentation
- Marketing
- Media and Communication
- Meeting Planner
- Mergers and Acquisitions
- Metaverse
- Newspapers
- Operations and Logistics
- Organizational Structure
- Our Goals
- Performance Management
- Pitch Decks
- Pricing Strategies
- Process Management
- Product Development
- Product Launch Ideas
- Product Portfolio
- Project Management
- Purchasing Process
- Quality Assurance
- Quotes and Testimonials
- Real Estate
- Risk Management
- Sales Performance Plan
- Sales Review
- SEO
- Service Offering
- Six Sigma
- Social Media and Network
- Software Development
- Solution Architecture
- Stock Portfolio
- Strategic Management
- Strategic Planning
- Supply Chain Management
- Swimlanes
- System Architecture
- Team Introduction
- Testing and Validation
- Thanks-FAQ
- Time Management
- Timelines Roadmaps
- Value Chain Analysis
- Value Stream Mapping
- Workplace Ethic
-
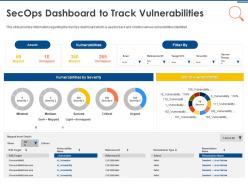 It security operations secops dashboard to track vulnerabilities ppt powerpoint gallery outfit
This slide provides information regarding the SecOps dashboard which is used to track and monitor various vulnerabilities identified. Present the topic in a bit more detail with this IT Security Operations Secops Dashboard To Track Vulnerabilities Ppt Powerpoint Gallery Outfit. Use it as a tool for discussion and navigation on Assets, Vulnerabilities, Severity. This template is free to edit as deemed fit for your organization. Therefore download it now.
-
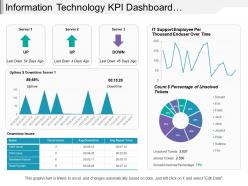 Information technology kpi dashboard showing downtime issues unsolved tickets
Presenting this set of slides with name - Information Technology Kpi Dashboard Showing Downtime Issues Unsolved Tickets. This is a four stage process. The stages in this process are Information Technology, It, Iot.
-
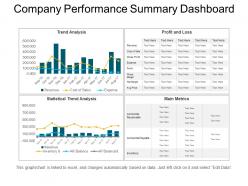 Company performance summary dashboard ppt slide examples
Presenting company performance summary dashboard PPT design. They are 100% expertly crafted Presentation graphics. They are quite compatible with all software’s and Google Slides. They have a feature to redesign all the available shapes, patterns, and matters etc. They have an authentic and relevant PPT images with limber data options and can easily add company name or logo.
-
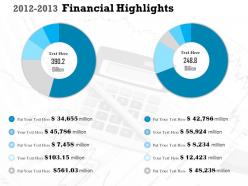 0314 2012 2013 financial highlights
Slide runs extremely smooth on all software. Convert to JPG and PDF formats without compatibility issues. Graphic pixilation does not occur when PPT slide projected on widescreen. Coherently works with google slides without trouble. High resolution PPT graphics for clarity and crispness. Systemize elements by adding company logo, trademark, name. Zero space constraints when including titles or sub titles. Changeable layout including font, text, color and design.
-
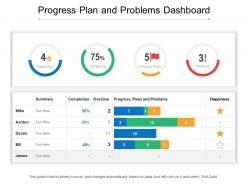 Progress plan and problems dashboard
Presenting this set of slides with name Progress Plan And Problems Dashboard. The topics discussed in these slides are Progress Dashboard, Chart And Graph, Finance, Marketing. This is a completely editable PowerPoint presentation and is available for immediate download. Download now and impress your audience.
-
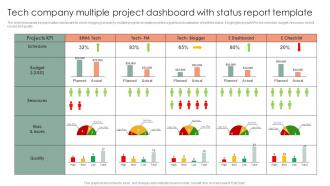 Tech Company Multiple Project Dashboard With Status Report Template
The Slide Showcases A Project Status Dashboard For A Tech Blogging Companys Multiple Projects, Template Provides A Graphical Visualisation Of Portfolio Status. It Highlights Project Kpis Like Schedule, Budget, Resources, Risks And Issues And Quality. Presenting Our Well Structured Tech Company Multiple Project Dashboard With Status Report Template. The Topics Discussed In This Slide Are Dashboard, Graphical, Visualisation. This Is An Instantly Available Powerpoint Presentation That Can Be Edited Conveniently. Download It Right Away And Captivate Your Audience.
-
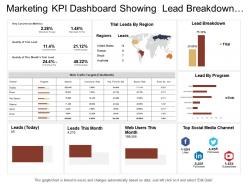 Marketing kpi dashboard showing lead breakdown web traffic targets
Presenting this set of slides with name - Marketing Kpi Dashboard Showing Lead Breakdown Web Traffic Targets. This is a three stage process. The stages in this process are Marketing, Branding, Promoting.
-
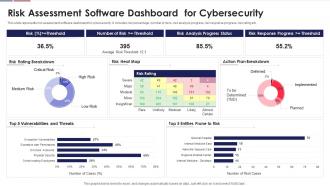 Risk Assessment Software Dashboard For Cybersecurity
This slide represents risk assessment software dashboard for cybersecurity. It includes risk percentage, number of risks, risk analysis progress, risk response progress, risk rating etc. Introducing our Risk Assessment Software Dashboard For Cybersecurity set of slides. The topics discussed in these slides are Critical Risk, Implemented, Breakdown, Risk Rating, Risk Analysis. This is an immediately available PowerPoint presentation that can be conveniently customized. Download it and convince your audience.
-
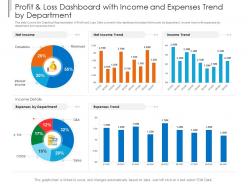 Profit and loss dashboard with income and expenses trend by department powerpoint template
This slide Covers the Graphical Representation of Profit and Loss. Data covered in this dashboard includes Net income by department, Income trend with expenses by department and expenses trend. This is a Profit And Loss Dashboard With Income And Expenses Trend By Department Powerpoint Template drafted with a diverse set of graphics, that can be reformulated and edited as per your needs and requirements. Just download it in your system and make use of it in PowerPoint or Google Slides, depending upon your presentation preferences.
-
 Financial comparison powerpoint templates download
Presenting financial comparison powerpoint templates download. This is a financial comparison powerpoint templates download. This is a four stage process. The stages in this process are analysis, management, business, marketing, strategy, success.
-
 Money regulation in healthcare powerpoint presentation slides
Presenting this set of slides with name - Money Regulation In Healthcare Powerpoint Presentation Slides. This deck comprises of a total of fourty one slides with each slide explained in detail. Each template comprises of professional diagrams and layouts. Our professional PowerPoint experts have also included icons, graphs, and charts for your convenience. All you have to do is DOWNLOAD the deck. Make changes as per the requirement. Can be converted into formats like PDF, JPG, and PNG. It is easily available in both standard and widescreen sizes. Yes, these PPT slides are completely customizable. Edit the color, text, and font size.
-
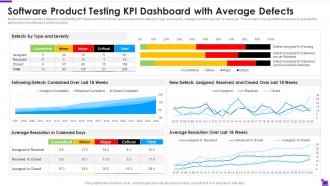 Software Product Testing Kpi Dashboard With Average Defects
Mentioned slide indicates software product testing KPI dashboard which shows various aspects like defects by type and severity, average solution over last 18 weeks etc. These metrics can assist the developers to evaluate the performance of software by performing test. Introducing our Software Product Testing Kpi Dashboard With Average Defects set of slides. The topics discussed in these slides are Defects By Type And Severity, Average Resolution Calendar Days, Following Defects Combined Over Last 18 Weeks. This is an immediately available PowerPoint presentation that can be conveniently customized. Download it and convince your audience.
-
 Call Center Team Quality Control Dashboard Snapshot With Total Evaluations
This graph or chart is linked to excel, and changes automatically based on data. Just left click on it and select edit data. Introducing our Call Center Team Quality Control Dashboard Snapshot With Total Evaluations set of slides. The topics discussed in these slides are Quality Assurance Summary, Total Evaluations, Team Average Score, Perfect Scores. This is an immediately available PowerPoint presentation that can be conveniently customized. Download it and convince your audience.
-
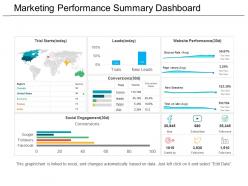 Marketing performance summary dashboard snapshot ppt templates
Presenting marketing performance summary dashboard snapshot PPT templates PPT slide. Presentation can be viewed on widescreen as the visuals do not pixelate. All the elements of the slide background can be tailored to individual needs. The presentation template can be incorporated in any of the desired format (JPEG/PDF) Guidance for editing of the PPT visual diagram is provided. Easy to edit and customize PPT graphics. Compatible with all software and can be saved in any format (JPEG/JPG/PDF).
-
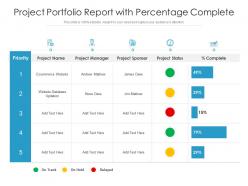 Project portfolio report with percentage complete
Introducing our Project Portfolio Report With Percentage Complete set of slides. The topics discussed in these slides are Project Manager, Project Sponsor, Project Status. This is an immediately available PowerPoint presentation that can be conveniently customized. Download it and convince your audience.
-
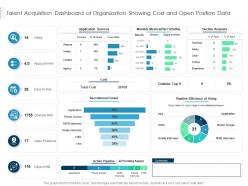 Talent acquisition dashboard of organization showing cost and open position data
Introducing our Talent Acquisition Dashboard Of Organization Showing Cost And Open Position Data set of slides. The topics discussed in these slides are Sources, Efficiency, Funnel. This is an immediately available PowerPoint presentation that can be conveniently customized. Download it and convince your audience.
-
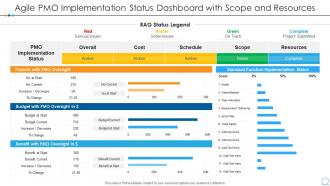 Agile pmo implementation status dashboard with scope and resources
Introducing our Agile PMO Implementation Status Dashboard With Scope And Resources set of slides. The topics discussed in these slides are Agile PMO Implementation Status Dashboard With Scope And Resources. This is an immediately available PowerPoint presentation that can be conveniently customized. Download it and convince your audience.
-
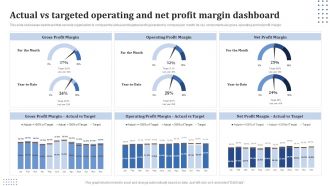 Actual Vs Targeted Operating And Net Profit Margin Dashboard
This slide showcases dashboard that can help organization to compare the actual and targeted profit generated by company per month. Its key components are gross, operating and net profit margin. Introducing our Actual Vs Targeted Operating And Net Profit Margin Dashboard set of slides. The topics discussed in these slides are Gross Profit Margin, Operating Profit Margin, Net Profit Margin. This is an immediately available PowerPoint presentation that can be conveniently customized. Download it and convince your audience.
-
 Monthly corporate review powerpoint presentation slides
Presenting this set of slides with name - Monthly Corporate Review Powerpoint Presentation Slides. Keep your audience glued to their seats with professionally designed PPT slides. This deck comprises of total of sixtysix slides. It has PPT templates with creative visuals and well researched content. Not just this, our PowerPoint professionals have crafted this deck with appropriate diagrams, layouts, icons, graphs, charts and more. This content ready presentation deck is fully editable. Just click the DOWNLOAD button below. Change the colour, text and font size. You can also modify the content as per your need. Get access to this well crafted complete deck presentation and leave your audience stunned.
-
 Hr analytics dashboard template ppt sample file
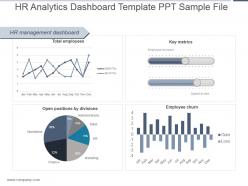
Presenting hr analytics dashboard template ppt sample file. This is a hr analytics dashboard template ppt sample file. This is a four stage process. The stages in this process are hr management dashboard, total employees, key metrics, employee turnover, speed to hire, ftes, jan, feb, mar, apr, may, june, july, aug, sep, oct, nov, dec, open positions by divisions, operations, administrations, sales, hr, marketing, finance, gain, loss, employee churn.
-
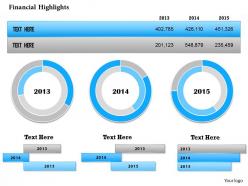 0414 3 staged linear financial diagram
Formulated PowerPoint template to use for business presentations by finance mangers, financial management personals and etc., Fully editable Presentation graphics, text, font, colors, shading and layout, Easy to insert you Company trademark or logo in the PPT designs, Very consistent and versatile featured rich Presentation template slides with an option to add heading or subheading also, consistent with all Google slides, one click downloading option available.
-
 Product Development Update Dashboard With Planning Design Development And Testing
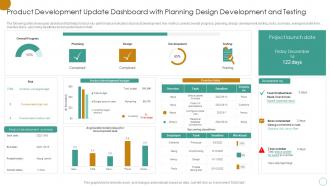
The following slide showcases dashboard that helps to track key performance indicators of product development. Key metrics covered overall progress, planning, design, development, testing, risks, summary, average handle time, overdue tasks, upcoming deadlines and projected launch date. Introducing our Product Development Update Dashboard With Planning Design Development And Testing set of slides. The topics discussed in these slides are Product Development, Update Dashboard, Planning Design, Development And Testing. This is an immediately available PowerPoint presentation that can be conveniently customized. Download it and convince your audience.
-
 Bar Chart Human Resource Retention Strategies For Business Owners
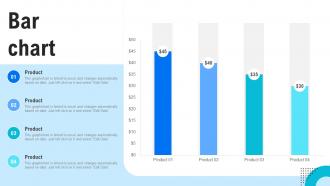
Present the topic in a bit more detail with this Bar Chart Human Resource Retention Strategies For Business Owners. Use it as a tool for discussion and navigation on Bar Chart. This template is free to edit as deemed fit for your organization. Therefore download it now.
-
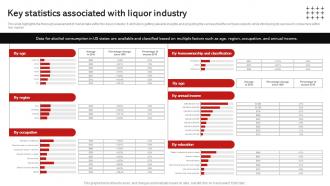 Key Associated With Liquor Industry Wine And Spirits Store Business Plan BP SS
This slide highlights the thorough assessment of market data within the liquor industry. It will help in getting valuable insights and projecting the success that the company expects while introducing its services to consumers within the market Present the topic in a bit more detail with this Key Associated With Liquor Industry Wine And Spirits Store Business Plan BP SS. Use it as a tool for discussion and navigation on Statistics, Associated, Services. This template is free to edit as deemed fit for your organization. Therefore download it now.
-
 Financial Forecast PowerPoint Presentation Slides
Our topic specific Financial Forecast Power Point Presentation Slides presentation deck contains sixteen slides to formulate the topic with a sound understanding. This PPT deck is what you can bank upon. With diverse and professional slides at your side, worry the least for a powerpack presentation. A range of editable and ready to use slides with all sorts of relevant charts and graphs, overviews, topics subtopics templates, and analysis templates makes it all the more worth. This deck displays creative and professional looking slides of all sorts. Whether you are a member of an assigned team or a designated official on the look out for impacting slides, it caters to every professional field.
-
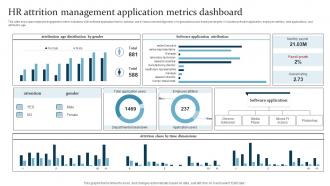 HR Attrition Management Application Metrics Dashboard
This slide showcase employee engagement metric indicators with software application lead to optimize use of resources and alignment of organizational and employee targets. It includes software application, employee attrition, total applications, and attribution age. Introducing our HR Attrition Management Application Metrics Dashboard set of slides. The topics discussed in these slides are Attribution, Software Application, Time Dimensions. This is an immediately available PowerPoint presentation that can be conveniently customized. Download it and convince your audience.
-
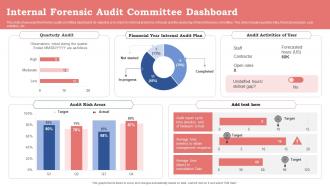 Internal Forensic Audit Committee Dashboard
This slide showcases the forensic audit committee dashboard. Its objective is to check for internal problems or frauds and the analysing of inernal forensic committee. This slide includes quarterly idea, financial year plan, user activities, etc. Introducing our Internal Forensic Audit Committee Dashboard set of slides. The topics discussed in these slides are Internal Forensic Audit, Committee Dashboard, Inernal Forensic Committee. This is an immediately available PowerPoint presentation that can be conveniently customized. Download it and convince your audience.
-
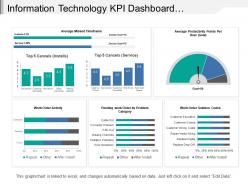 Information technology kpi dashboard showing work order activity
Presenting this set of slides with name - Information Technology Kpi Dashboard Showing Work Order Activity. This is a six stage process. The stages in this process are Information Technology, It, Iot.
-
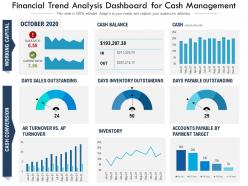 Financial trend analysis dashboard snapshot for cash management
Presenting this set of slides with name Financial Trend Analysis Dashboard Snapshot For Cash Management. The topics discussed in these slides are Sales Outstanding, Inventory, Cash Conversion, Working Capital, Payment Target. This is a completely editable PowerPoint presentation and is available for immediate download. Download now and impress your audience.
-
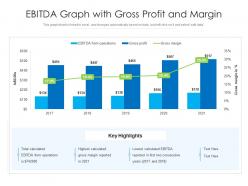 Ebitda graph with gross profit and margin
This graph or chart is linked to excel, and changes automatically based on data. Just left click on it and select edit data. Introducing our EBITDA Graph With Gross Profit And Margin set of slides. The topics discussed in these slides are Key Highlights, Gross Profit, Gross Margin. This is an immediately available PowerPoint presentation that can be conveniently customized. Download it and convince your audience.
-
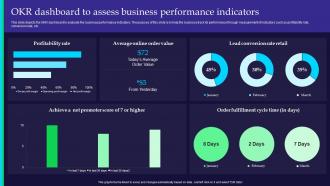 OKR Dashboard To Assess Business Performance Indicators
This slide depicts the OKR dashboard to evaluate the business performance indicators. The purpose of this slide is to help the business track its performance through measurement of indicators such as profitability rate, conversion rate, etc. Introducing our OKR Dashboard To Assess Business Performance Indicators set of slides. The topics discussed in these slides are Profitability Rate, Average Online, Conversion Rate Retail This is an immediately available PowerPoint presentation that can be conveniently customized. Download it and convince your audience.
-
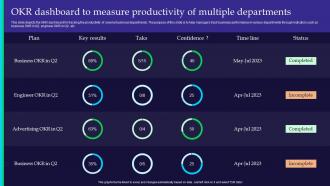 OKR Dashboard To Measure Productivity Of Multiple Departments
This slide depicts the OKR dashboard for tracking the productivity of several business departments. The purpose of this slide is to help managers track business performance in various departments through indicators such as business OKR in Q2, engineer OKR in Q2, etc. Introducing our OKR Dashboard To Measure Productivity Of Multiple Departments set of slides. The topics discussed in these slides are Business, Engineer, Advertising This is an immediately available PowerPoint presentation that can be conveniently customized. Download it and convince your audience.
-
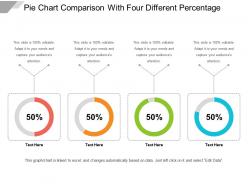 Pie chart comparison with four different percentage
Presenting Pie Chart Comparison With Four Different Percentage. Made up of high-resolution graphics. Easy to download and can be saved in a variety of formats. Access to open on a widescreen preview. Compatible with the Google Slides and PowerPoint software. Alter the style, size, and the background of the slide icons as per your needs. Useful for business owners, students, and managers. Can be viewed on standard screen and widescreen without any fear of pixelation.
-
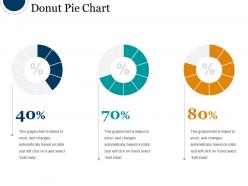 Donut pie chart powerpoint slide presentation examples
Presenting Donut Pie Chart PowerPoint Slide Presentation Examples which is completely editable. Open and save your presentation in various formats like PDF, JPG, and PNG. This template is compatible with Google Slides which makes it easily accessible at once. This slide is available in both 4:3 and 16:9 aspect ratio. Alter the font, color, font size, and font types of the slides as per your needs.
-
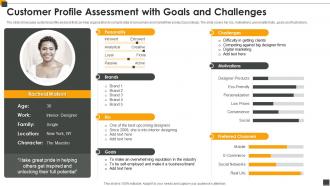 Customer Profile Assessment With Goals And Challenges
The Slide Showcases Customer Profile Analysis That Can Help Organisation To Compile Data Of Consumers And Market Their Product Accordingly. The Slide Covers Her Bio, Motivations, Personality Traits, Goals And Frustrations. Introducing our Customer Profile Assessment With Goals And Challenges set of slides. The topics discussed in these slides are Customer, Assessment, Motivations, Frustrations, Business. This is an immediately available PowerPoint presentation that can be conveniently customized. Download it and convince your audience.
-
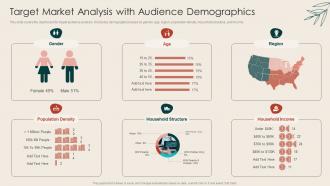 Target Market Analysis With Audience Demographics
This slide covers the dashboard for target audience analysis. It includes demographics based on gender, age, region, population density, household structure, and income. Introducing our Target Market Analysis With Audience Demographics set of slides. The topics discussed in these slides are Population Density, Household Structure, Household Income. This is an immediately available PowerPoint presentation that can be conveniently customized. Download it and convince your audience.
-
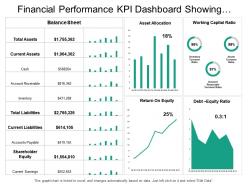 Financial performance kpi dashboard showing asset allocation balance sheet
Presenting this set of slides with name - Financial Performance Kpi Dashboard Showing Asset Allocation Balance Sheet. This is a two stage process. The stages in this process are Financial Performance, Financial Report, Financial Review.
-
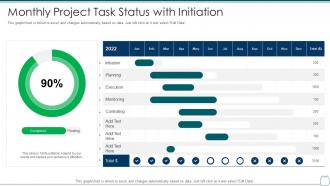 Monthly project task status with initiation
Introducing our Monthly Project Task Status With Initiation set of slides. The topics discussed in these slides are Monthly Project Task Status With Initiation. This is an immediately available PowerPoint presentation that can be conveniently customized. Download it and convince your audience.
-
 Financial asset management through mitigating risks and diversifying investment portfolio complete deck
This complete deck can be used to present to your team. It has PPT slides on various topics highlighting all the core areas of your business needs. This complete deck focuses on Financial Asset Management Through Mitigating Risks And Diversifying Investment Portfolio Complete Deck and has professionally designed templates with suitable visuals and appropriate content. This deck consists of total of thirty four slides. All the slides are completely customizable for your convenience. You can change the colour, text and font size of these templates. You can add or delete the content if needed. Get access to this professionally designed complete presentation by clicking the download button below.
-
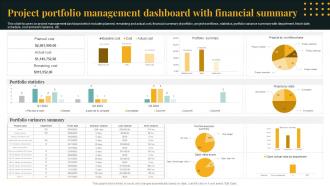 Project Portfolio Management Dashboard With Financial Summary
This slide focuses on project management dashboard which includes planned, remaining and actual cost, financial summary of portfolio, project workflows, statistics, portfolio variance summary with department, finish date, schedule, cost and work variance, etc. Introducing our Project Portfolio Management Dashboard With Financial Summary set of slides. The topics discussed in these slides are Project Portfolio Management, Dashboard With Financial Summary This is an immediately available PowerPoint presentation that can be conveniently customized. Download it and convince your audience.
-
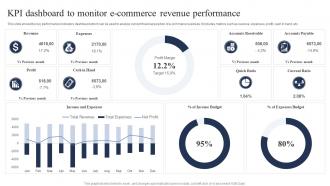 KPI Dashboard To Monitor E Commerce Revenue Performance
This slide shows the key performance indicators dashboard which can be used to analyze current financial position of e-commerce business. It includes metrics such as revenue, expenses, profit, cash in hand, etc. Presenting our well structured KPI Dashboard To Monitor E Commerce Revenue Performance. The topics discussed in this slide are Revenue, Expenses, Accounts Receivable. This is an instantly available PowerPoint presentation that can be edited conveniently. Download it right away and captivate your audience.
-
 Marketing Budget Powerpoint Presentation Slides
Introducing Marketing Budget PowerPoint Presentation Slides. Rational and resourceful PowerPoint deck which an important tool for marketing businesses, Marketing managers, management professionals etc. Quickly changeable colors, texts, fonts, graphics of PPT images, well versant with all Google slides and operating software’s, simply exportable into various file configurations like PDF or JPG, ample space available to add caption or subheading.
-
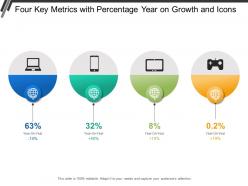 Four key metrics with percentage year on growth and icons
The design template is easy to edit by anyone; you can change design style, shape, font type, size, color, background, image etc. and customize it according to your business needs. Slides can be opened and edited with Google Slides and MS PowerPoint software. You can include business logo, name and your business-related data into text place holders to customize the design. Swift and instant downloading available; designs can be downloaded as JPEG or PDF format.
-
 Financial Assets Management Kpi And Dashboard Powerpoint Presentation Slides
This complete deck focuses on Financial Assets Management Kpi And Dashboard Powerpoint Presentation Slides and consists of professionally designed templates with suitable graphics and appropriate content. This deck has a total of twenty-five slides. Our designers have created customizable templates for your convenience. You can make the required changes in the templates like color, text and font size. The presentation is fully supported by Google Slides. It can be easily converted into JPG or PDF format. When you download this presentation by clicking the download button, you get the presentation in both standard and widescreen formats.
-
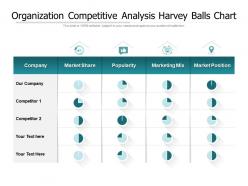 Organization competitive analysis harvey balls chart
Presenting this set of slides with name Organization Competitive Analysis Harvey Balls Chart. The topics discussed in these slides are Company, Market Share, Popularity, Marketing Mix, Market Position. This is a completely editable PowerPoint presentation and is available for immediate download. Download now and impress your audience.
-
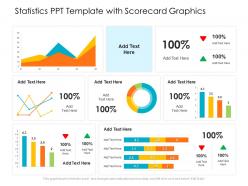 Statistics ppt template with scorecard graphics
Presenting this set of slides with name Statistics PPT Template With Scorecard Graphics. The topics discussed in these slide is Statistics PPT Template With Scorecard Graphics. This is a completely editable PowerPoint presentation and is available for immediate download. Download now and impress your audience.
-
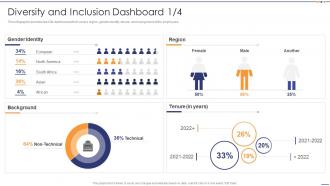 Diversity And Inclusion Dashboard Identity Setting Diversity And Inclusivity Goals
This infographic provides the D and I dashboard which covers region, gender identity, tenure, and background of the employees. Present the topic in a bit more detail with this Diversity And Inclusion Dashboard Identity Setting Diversity And Inclusivity Goals. Use it as a tool for discussion and navigation on Diversity And Inclusion Dashboard. This template is free to edit as deemed fit for your organization. Therefore download it now.
-
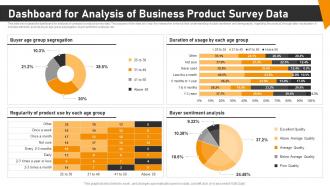 Dashboard For Analysis Of Business Product Survey Data
This slide showcases the dashboard for analysis of companys product survey data. The purpose of this slide is to help the researcher enhance their understanding of public sentiment and demography, regarding the product, through data visualization. It includes elements such as buyer age group segregation, buyer sentiment analysis, etc. Introducing our Dashboard For Analysis Of Business Product Survey Data set of slides. The topics discussed in these slides are Group Segregation, Regularity Product, Buyer Sentiment Analysis. This is an immediately available PowerPoint presentation that can be conveniently customized. Download it and convince your audience.
-
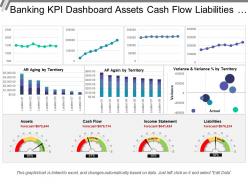 Banking kpi dashboard assets cash flow liabilities income statement
Presenting this set of slides with name - Banking Kpi Dashboard Assets Cash Flow Liabilities Income Statement. This is a three stage process. The stages in this process are Banking, Finance, Money.
-
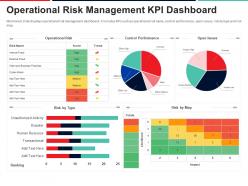 Operational risk management kpi dashboard approach to mitigate operational risk ppt topics
Mentioned slide displays operational risk management dashboard. It includes KPIs such as operational risk name, control performance, open issues, risk by type and risk map.Present the topic in a bit more detail with this Operational Risk Management Kpi Dashboard Approach To Mitigate Operational Risk Ppt Topics. Use it as a tool for discussion and navigation on operational risk, control performance, open issues. This template is free to edit as deemed fit for your organization. Therefore download it now.
-
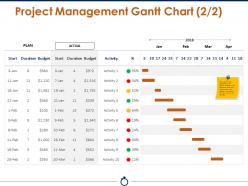 Project management gantt chart ppt background images
Presentation slide can be amended easily as access to change color, text and layout. Astonishing picture quality as pixels don’t break when viewed in widescreen view. Well Assorted with online software programs such as JPG and PDF. Extraordinary quality of resolutions used in PowerPoint template. Matching presentation designs accessible with different nodes and stages. Pre-designed PPT design saves you valuable time. Personalize the presentation with your organization insignia and designation.
-
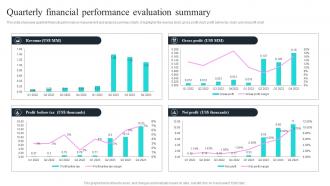 Quarterly Financial Performance Evaluation Summary
This slide showcase quarterly financial performance measurement and analysis summary charts. It highlights the revenue chart, gross profit chart, profit before tax chart, and net profit chart. Presenting our well structured Quarterly Financial Performance Evaluation Summary. The topics discussed in this slide are Financial, Summary, Gross Profit. This is an instantly available PowerPoint presentation that can be edited conveniently. Download it right away and captivate your audience.
-
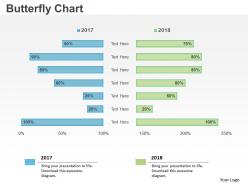 0414 business butterfly bar chart powerpoint graph
Presenting 0414 business butterfly bar chart PowerPoint graph PPT slide. High-resolution visuals. No fear of image pixelation when projected on a large screen. Thoroughly editable PowerPoint pictures. Ease of executing changes in the content of the slide. Easy to customize and personalize the PowerPoint slides with company-specific name, logo, and trademark. Ease of download and can be saved in any format of one’s choice. Compatible with numerous software options available both online and offline. Applicable by a number of marketing and nonmarketing executives, students, and teachers.
-
 Costing Strategies Powerpoint Presentation Slides
Presenting Costing Strategies PowerPoint Presentation Slides. Fully in sync with Google slides. Easy to put in company logo, trademark or name; accommodate words to support the key points. Images do no blur out even when they are projected on large screen. PPT template can be utilized by sales and marketing teams and business managers. Instantly downloadable slide and supports formats like JPEG and PDF. Adjust colors, text and fonts as per your business requirements.
-
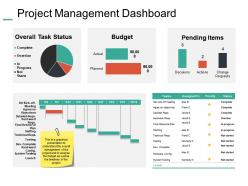 Project management dashboard snapshot ppt summary example introduction
Presenting this set of slides with name - Project Management Dashboard Snapshot Ppt Summary Example Introduction. This is a three stage process. The stages in this process are Budget, Pending Items, Change Request, Decision, Actions.
-
 Performance update companies sales revenue
Presenting this set of slides with name Performance Update Companies Sales Revenue. The topics discussed in these slides are Sales, Revenue, Cost. This is a completely editable PowerPoint presentation and is available for immediate download. Download now and impress your audience.
-
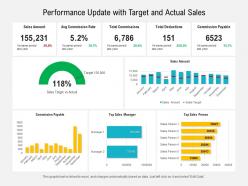 Performance update with target and actual sales
Presenting this set of slides with name Performance Update With Target And Actual Sales. The topics discussed in these slides are Sales, Commissions, Deductions. This is a completely editable PowerPoint presentation and is available for immediate download. Download now and impress your audience.
-
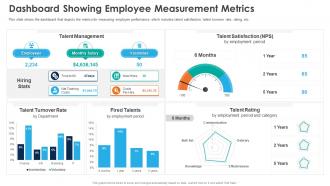 Dashboard Showing Employee Measurement Metrics Automation Of HR Workflow
This slide shows the dashboard that depicts the metrics for measuring employee performance which includes talent satisfaction, talent turnover rate, rating, etc. Present the topic in a bit more detail with this Dashboard Showing Employee Measurement Metrics Automation Of HR Workflow. Use it as a tool for discussion and navigation on Talent Management, Talent Turnover Rate, Fired Talents, Talent Satisfaction. This template is free to edit as deemed fit for your organization. Therefore download it now.
-
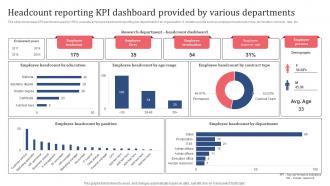 Headcount Reporting KPI Dashboard Provided By Various Departments
The slide showcases KPI dashboard used by HR to evaluate employee headcount reporting per department in an organization. It contains points such as employee headcount, hires, termination, turnover, rate, etc. Introducing our Headcount Reporting KPI Dashboard Provided By Various Departments set of slides. The topics discussed in these slides are Employee Headcount, Employee Termination, Employee Persona. This is an immediately available PowerPoint presentation that can be conveniently customized. Download it and convince your audience.
-
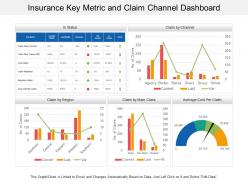 Insurance key metric and claim channel dashboard
• Easy to customize. • Easy to replace any words, picture or number provided in the template with your own content and use it for presentation. • Freedom to incorporate your own company’s name and logo in the presentation for personalization. • The PPT visuals used are of high resolution. • No issue of image pixilation if projected on wide screen. • Compatibility with numerous format and software options. • Widely used by marketers, businessmen, insurance managers and educators.


