Financials PowerPoint Templates, Financial Statement PPT Templates
- Sub Categories
-
- 30 60 90 Day Plan
- About Us Company Details
- Action Plan
- Agenda
- Annual Report
- Audit Reports
- Balance Scorecard
- Brand Equity
- Business Case Study
- Business Communication Skills
- Business Plan Development
- Business Problem Solving
- Business Review
- Capital Budgeting
- Career Planning
- Change Management
- Color Palettes
- Communication Process
- Company Location
- Company Vision
- Compare
- Competitive Analysis
- Corporate Governance
- Cost Reduction Strategies
- Custom Business Slides
- Customer Service
- Dashboard
- Data Management
- Decision Making
- Digital Marketing Strategy
- Digital Transformation
- Disaster Management
- Diversity
- Equity Investment
- Financial Analysis
- Financial Services
- Financials
- Growth Hacking Strategy
- Human Resource Management
- Innovation Management
- Interview Process
- Knowledge Management
- Leadership
- Lean Manufacturing
- Legal Law Order
- Management
- Market Segmentation
- Marketing
- Media and Communication
- Meeting Planner
- Mergers and Acquisitions
- Metaverse
- Newspapers
- Operations and Logistics
- Organizational Structure
- Our Goals
- Performance Management
- Pitch Decks
- Pricing Strategies
- Process Management
- Product Development
- Product Launch Ideas
- Product Portfolio
- Project Management
- Purchasing Process
- Quality Assurance
- Quotes and Testimonials
- Real Estate
- Risk Management
- Sales Performance Plan
- Sales Review
- SEO
- Service Offering
- Six Sigma
- Social Media and Network
- Software Development
- Solution Architecture
- Stock Portfolio
- Strategic Management
- Strategic Planning
- Supply Chain Management
- Swimlanes
- System Architecture
- Team Introduction
- Testing and Validation
- Thanks-FAQ
- Time Management
- Timelines Roadmaps
- Value Chain Analysis
- Value Stream Mapping
- Workplace Ethic
-
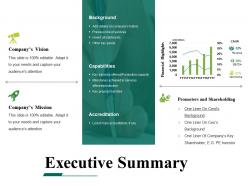 Executive summary powerpoint templates microsoft
Presenting executive summary powerpoint templates microsoft. This is a executive summary powerpoint templates microsoft. This is a four stage process. The stages in this process are accreditation, capabilities, background, promoters and shareholding.
-
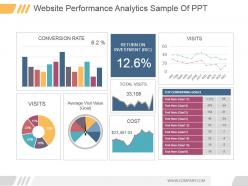 Website performance analytics sample of ppt
Presenting website performance analytics sample of ppt. This is a website performance analytics sample of ppt. This is a three stage process. The stages in this process are conversion rate, visits, average visit value goal, return on investment ric, total visits, cost, visits, top converting goals, jan, feb, mar, apr, may, jun, jul, aug, sep, oct, nov, dec, goal.
-
 Information technology kpi dashboard showing overdue tasks deadlines
Introducing information technology KPI dashboard showing overdue tasks deadlines PowerPoint template. PPT slides offer a thorough editable customization of font, color, and orientation of high powered info-graphics. Quick and easy downloading process. Suitable for business managers and professionals. Sufficient space is available for the easy placement of desired content. Templates are compatible with wide range of software such as pdf/jpeg/Jpg. PPT design can be access in standard and widescreen view. Editing instructions are explained step by step.
-
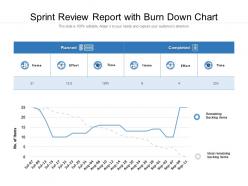 Sprint review report with burn down chart
Presenting this set of slides with name Sprint Review Report With Burn Down Chart. The topics discussed in these slides are Planned, Completed, Remaining Backlog Items, Ideal Remaining Backlog Items. This is a completely editable PowerPoint presentation and is available for immediate download. Download now and impress your audience.
-
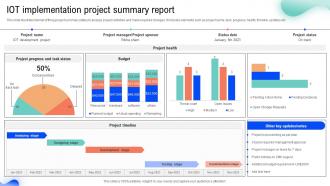 IoT Implementation Project Summary Report
This slide illustrate internet of thing project summary status to analyze project activities and make required changes. It includes elements such as project name, task, progress, health, timeline, updates etc. Introducing our IoT Implementation Project Summary Report set of slides. The topics discussed in these slides are IOT Implementation, Project Summary Report, Development Stage. This is an immediately available PowerPoint presentation that can be conveniently customized. Download it and convince your audience.
-
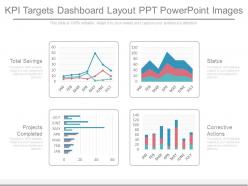 Kpi targets dashboard layout ppt powerpoint images
Presenting kpi targets dashboard layout ppt powerpoint images. This is a kpi targets dashboard layout ppt powerpoint images. This is a four stage process. The stages in this process are total savings, projects completed, status, corrective actions.
-
 Valuation Of Shares Powerpoint Presentation Slides
Presenting this set of slides with name - Valuation Of Shares Powerpoint Presentation Slides. The stages in this process are Valuation Of Shares, Companys Shares, Shares Analysis.
-
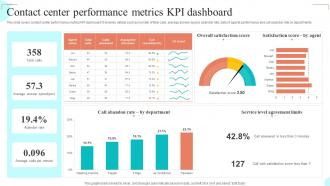 Contact Center Performance Metrics KPI Dashboard
This slide covers contact center performance metrics KPI dashboard. It involves details such as number of total calls, average answer speed, abandon rate, data of agents performance and call abandon rate by departments. Presenting our well structured Contact Center Performance Metrics KPI Dashboard The topics discussed in this slide are Call Abandon Rate, Overall Satisfaction Score, Satisfaction Score This is an instantly available PowerPoint presentation that can be edited conveniently. Download it right away and captivate your audience.
-
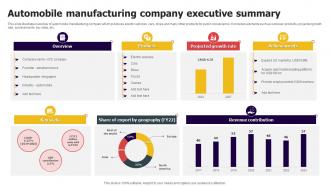 Automobile Manufacturing Company Executive Summary
This slide illustrates overview of automobile manufacturing company which produces electric vehicles, cars, bikes and many other products for public convenience. It includes elements such as overview, products, projected growth rate, achievements, key stats, etc. Introducing our Automobile Manufacturing Company Executive Summary set of slides. The topics discussed in these slides are Overview, Products, Achievements. This is an immediately available PowerPoint presentation that can be conveniently customized. Download it and convince your audience.
-
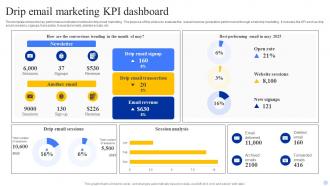 Drip Email Marketing KPI Dashboard
This template shows the key performance indicators metrics for drip email marketing . The purpose of this slide is to evaluate the overall revenue generation performance through email drip marketing . It includes the KPI such as drip email sessions, signups, transaction, forwarded emails, deleted emails, etc. Introducing our Drip Email Marketing KPI Dashboard set of slides. The topics discussed in these slides are Email, Transaction, Revenue. This is an immediately available PowerPoint presentation that can be conveniently customized. Download it and convince your audience.
-
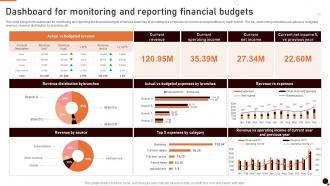 Dashboard For Monitoring And Reporting Financial Budgets
This slide brings forth dashboard for monitoring and reporting the financial budgets of various branches of an enterprise emphasis on income and expenditure by each branch. The key performing indicators are actual vs budgeted revenue, revenue distribution by branches etc. Introducing our Dashboard For Monitoring And Reporting Financial Budgets set of slides. The topics discussed in these slides are Current Revenue, Current Operating Income This is an immediately available PowerPoint presentation that can be conveniently customized. Download it and convince your audience.
-
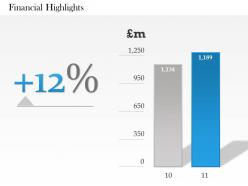 0414 profit and financial analysis diagram
We are proud to present our 0414 profit and financial analysis diagram. Our profit and fianacial analysis diagram Powerpoint Templates provide the skeleton of your presentation. Flesh them out with your weighty ideas. Our profit and fianacial analysis diagram Powerpoint Templates are the sinews of your lecture. Give them the muscle of your vibrant thoughts.
-
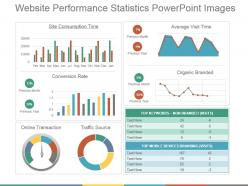 Website performance statistics powerpoint images
We present to you our website performance statistics PowerPoint images. You can change the placement, the size or the color of the graphical images used in the template. You can make numerous changes by following the instructions given in sample slides, as this PPT is fully editable. This template can be saved in either PDF or JPG format. You can view the presentation in widescreen display ratio of 16:9 or standard size display ratio of 4:3. So download, edit and present it.
-
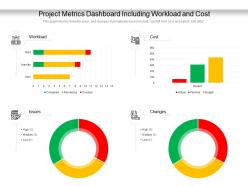 Project metrics dashboard including workload and cost
Presenting this set of slides with name Project Metrics Dashboard Including Workload And Cost. The topics discussed in these slides are Cost, Workload, Issues. This is a completely editable PowerPoint presentation and is available for immediate download. Download now and impress your audience.
-
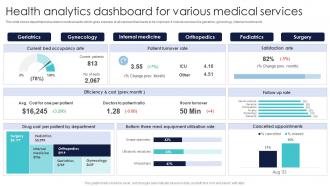 Health Analytics Dashboard For Various Medical Services
This slide shows department wise data in medical sector which gives overview of all services that needs to be improved. It include services like geriatrics, gynecology, internal medicine etc. Presenting our well structured Health Analytics Dashboard For Various Medical Services. The topics discussed in this slide are Geriatrics, Gynecology, Internal Medicine, Orthopedics. This is an instantly available PowerPoint presentation that can be edited conveniently. Download it right away and captivate your audience.
-
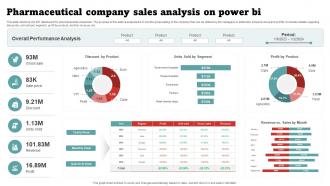 Pharmaceutical Company Sales Analysis On Power BI
This slide mentions the KPI dashboard for pharmaceutical companies. The purpose of this slide is analysis the 6 months gross selling of the company that can be utilized by the managers to determine actual revenue and profits. It includes details regarding discounts, unit sold per segment, profit by product, monthly revenue, etc.Presenting our well structured Pharmaceutical Company Sales Analysis On Power BI. The topics discussed in this slide are Discount Product, Overall Performance Analysis, Profit Product. This is an instantly available PowerPoint presentation that can be edited conveniently. Download it right away and captivate your audience.
-
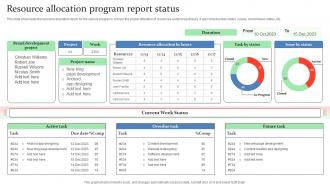 Resource Allocation Program Report Status
This slide showcases the resource allocation report for the various programs to track the proper utilization of resources under project tasks. It also inlcudes task status, issues, current week status, etc. Introducing our Resource Allocation Program Report Status set of slides. The topics discussed in these slides are Brand Development Project, Current Week Status. This is an immediately available PowerPoint presentation that can be conveniently customized. Download it and convince your audience.
-
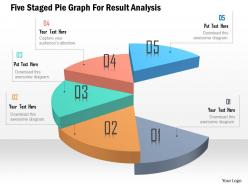 Five staged pie graph for resul analysis powerpoint template
We are proud to present our five staged pie graph for resul analysis powerpoint template. Five staged pie graph has been used to craft this power point template diagram. This PPT diagram contains the concept of result analysis. Use this PPT diagram for business and marketing related presentations.
-
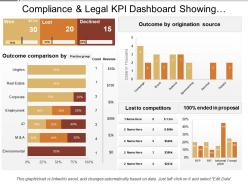 Compliance and legal kpi dashboard showing outcome comparison
Presenting this set of slides with name - Compliance And Legal Kpi Dashboard Showing Outcome Comparison. This is a three stage process. The stages in this process are Compliance And Legal, Legal Governance, Risk Management.
-
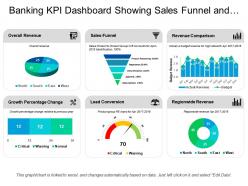 Banking kpi dashboard showing sales funnel and overall revenue
Presenting this set of slides with name - Banking Kpi Dashboard Showing Sales Funnel And Overall Revenue. This is a six stage process. The stages in this process are Banking, Finance, Money.
-
 Coca cola company profile overview financials and statistics from 2014-2018
This report is an extensively researched profile on company Coca Cola Company Profile Overview Financials And Statistics From 2014 to 2018 in industry Consumer Goods And FMCG and Retail and Trade and E-Commerce and has been prepared by SlideTeam industry experts after extensively researching through hundreds of data sources. This is part of our Company Profiles products selection, and you will need a Paid account to download the actual report with accurate data and sources for each statistic and fact. Downloaded report will be in Powerpoint and will contain the actual editable slides with the actual data and sources for each data where applicable. Download it immediately and use it for your business.
-
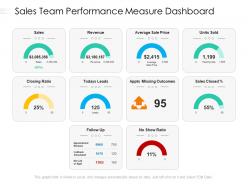 Sales team performance measure dashboard
Presenting this set of slides with name Sales Team Performance Measure Dashboard. The topics discussed in these slides are Sales, Revenue, Average. This is a completely editable PowerPoint presentation and is available for immediate download. Download now and impress your audience.
-
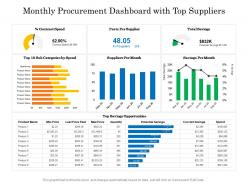 Monthly procurement dashboard with top suppliers
Presenting this set of slides with name Monthly Procurement Dashboard With Top Suppliers. The topics discussed in these slides are Opportunities, Supplier, Price. This is a completely editable PowerPoint presentation and is available for immediate download. Download now and impress your audience.
-
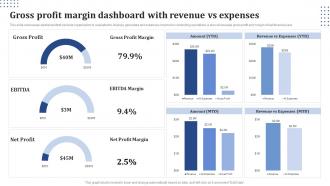 Gross Profit Margin Dashboard With Revenue Vs Expenses
This slide showcases dashboard that can help organization to evaluate the revenue generated and expenses incurred in conducting operations. It also showcases gross profit and margin of last financial year. Presenting our well-structured Gross Profit Margin Dashboard With Revenue Vs Expenses. The topics discussed in this slide are Gross Profit Margin, Dashboard, Revenue Vs Expenses. This is an instantly available PowerPoint presentation that can be edited conveniently. Download it right away and captivate your audience.
-
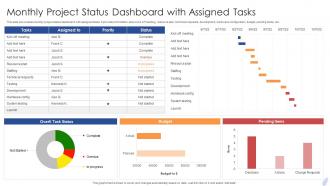 Monthly Project Status Dashboard With Assigned Tasks
This slide showcases monthly project status dashboard with assigned tasks. It provides information about kick off meeting, resource plan, technical requests, development, hardware configuration, budget, pending items, etc. Introducing our Monthly Project Status Dashboard With Assigned Tasks set of slides. The topics discussed in these slides are Monthly Project Status, Dashboard, Assigned Tasks. This is an immediately available PowerPoint presentation that can be conveniently customized. Download it and convince your audience.
-
 Current ESG And Future Strategy Ayurvedic Products Company Profile Cp Ss V
This slide highlights the Daburs current ESG and future strategy for non financial factors which includes CSR expenditure and beneficiaries with CSR focus areas.Deliver an outstanding presentation on the topic using this Current ESG And Future Strategy Ayurvedic Products Company Profile Cp Ss V. Dispense information and present a thorough explanation of Improvement Environment, Increase Employee, Compliance Transparency using the slides given. This template can be altered and personalized to fit your needs. It is also available for immediate download. So grab it now.
-
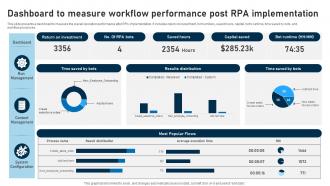 RPA Adoption Strategy Dashboard To Measure Workflow Performance Post RPA Implementation
The mentioned slide showcases the data and information sources required to execute automation and understand consumer behaviour.It includes internal and external sources, social media platforms, geographical factors to track data for implementing automation. Deliver an outstanding presentation on the topic using this RPA Adoption Strategy Dashboard To Measure Workflow Performance Post RPA Implementation Dispense information and present a thorough explanation of Measure Workflow, Performance Post using the slides given. This template can be altered and personalized to fit your needs. It is also available for immediate download. So grab it now.
-
 Income Forecast PowerPoint Presentation Slides
Enhance your audiences knowledge with this well researched complete deck. Showcase all the important features of the deck with perfect visuals. This deck comprises of total of ninteen slides with each slide explained in detail. Each template comprises of professional diagrams and layouts. Our professional PowerPoint experts have also included icons, graphs and charts for your convenience. All you have to do is DOWNLOAD the deck. Make changes as per the requirement. Yes, these PPT slides are completely customizable. Edit the colour, text and font size. Add or delete the content from the slide. And leave your audience awestruck with the professionally designed Income Forecast Power Point Presentation Slides complete deck.
-
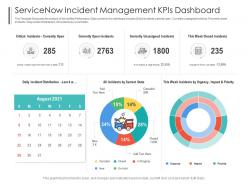 Servicenow incident management kpis dashboard snapshot powerpoint template
This Template Showcases the analysis of ServiceNow Performance. Data covered in this dashboard includes-Critical incidents-currently open , Currently unassigned incidents, This week closed incidents. Daily incident Distribution, All incidents by current state. This is a Servicenow Incident Management Kpis Dashboard Snapshot Powerpoint Template featuring in built editable components to add your personal touches. Tailor this template as per your liking and display it on a widescreen or standard screen, the choice is yours.
-
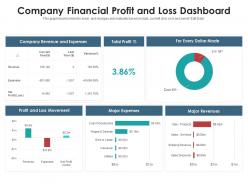 Company financial profit and loss dashboard
Presenting our well-structured Company Financial Profit And Loss Dashboard. The topics discussed in this slide are Revenue And Expenses, Profit And Loss Movement, Profit. This is an instantly available PowerPoint presentation that can be edited conveniently. Download it right away and captivate your audience.
-
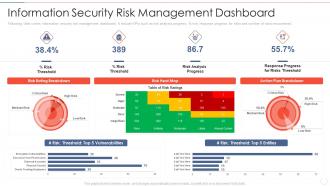 Information security dashboard effective information security risk management process
Following slide covers information security risk management dashboard. It include KPIs such as risk analysis progress, persent risk, response progress for risks and number of risks encountered.Present the topic in a bit more detail with this Information Security Dashboard Effective Information Security Risk Management Process. Use it as a tool for discussion and navigation on Risk Rating Breakdown, Risk Analysis Progress Action Plan Breakdown. This template is free to edit as deemed fit for your organization. Therefore download it now.
-
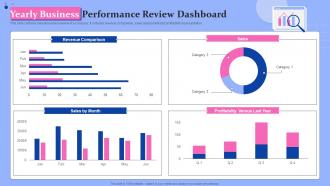 Yearly Business Performance Review Dashboard
This slide contains annual business review of a company. It includes revenue comparison, sales assessment and profitability representation. Introducing our Yearly Business Performance Review Dashboard set of slides. The topics discussed in these slides are Revenue Comparison, Sales, Sales By Month, Profitability, Last Year. This is an immediately available PowerPoint presentation that can be conveniently customized. Download it and convince your audience.
-
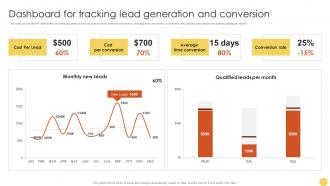 Dashboard For Tracking Lead Advanced Lead Generation Tactics Strategy SS V
This slide covers the KPI dashboard for analyzing metrics such as cost per lead, cost per conversion, average time conversion, conversion rate, monthly new leads, and qualified leads per month. Deliver an outstanding presentation on the topic using this Dashboard For Tracking Lead Advanced Lead Generation Tactics Strategy SS V. Dispense information and present a thorough explanation of Conversion, Average, Conversion using the slides given. This template can be altered and personalized to fit your needs. It is also available for immediate download. So grab it now.
-
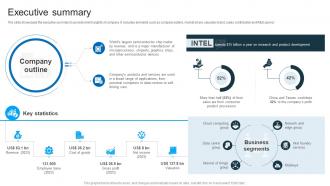 Executive Summary Intel Company Profile Ppt Structure CP SS
The slide showcases the executive summary to provide brief insights of company. It includes elements such as company outline, market share, valuable brand, sales contribution and RandD spend. Present the topic in a bit more detail with this Executive Summary Intel Company Profile Ppt Structure CP SS. Use it as a tool for discussion and navigation on Executive Summary. This template is free to edit as deemed fit for your organization. Therefore download it now.
-
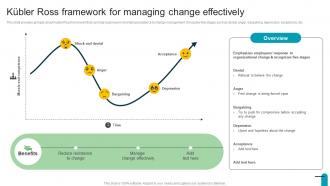 Kubler Ross Framework For Managing Visionary And Analytical Thinking Strategy SS V
This slide provides glimpse about Kubler Ross framework that can help business in minimizing resistance to change management. It includes five stages such as denial, anger, bargaining, depression, acceptance, etc. Deliver an outstanding presentation on the topic using this Kubler Ross Framework For Managing Visionary And Analytical Thinking Strategy SS V. Dispense information and present a thorough explanation of Emphasizes, Organizational, Compromise using the slides given. This template can be altered and personalized to fit your needs. It is also available for immediate download. So grab it now.
-
 Investment Valuation Ratios Powerpoint Presentation Slides
These templates are 100% editable. Our PowerPoint presentation slides are quickly downloadable. These slide consists of 29 slides and comprises all the necessary information. High-resolution template designs. These slides have compatible presentation layout. Our PPT visuals can be easily converted to PDF and JPG formats. Our presentation visuals can be used by investors, promoters, marketers, business professionals, sales and many more. We have used standardized colors which contrast and compliment.The stages in this process are investment valuation ratios, investment potential, pe ratio.
-
 Capital Asset Expenditure Powerpoint Presentation Slides
Introducing Capital Asset Expenditure Powerpoint Presentation Slides. This presentation includes 41 professionally designed PPT templates. These PPT Slides are 100 % editable. Users can change the fonts, colors, and slide background as per their need. On downloading the presentation, you get the templates in both widescreen and standard screen. The presentation is compatible with Google Slides and can be saved in JPG or PDF format.
-
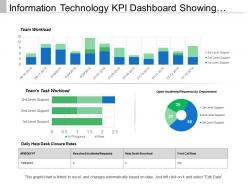 Information technology kpi dashboard showing team task workload
Presenting this set of slides with name - Information Technology Kpi Dashboard Showing Team Task Workload. This is a three stage process. The stages in this process are Information Technology, It, Iot.
-
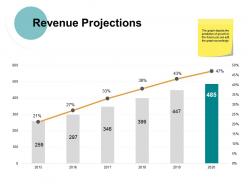 Revenue projections ppt powerpoint presentation file designs download
Presenting this set of slides with name - Revenue Projections Ppt Powerpoint Presentation File Designs Download. This is a two stage process. The stages in this process are Finance, Management, Strategy, Business, Marketing.
-
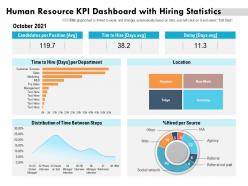 Human resource kpi dashboard with hiring statistics
Introducing our Human Resource KPI Dashboard With Hiring Statistics set of slides. The topics discussed in these slides are Human Resource KPI Dashboard With Hiring Statistics. This is an immediately available PowerPoint presentation that can be conveniently customized. Download it and convince your audience.
-
 Percentage circle illustration for sales revenue forecast infographic template
This is our Percentage Circle Illustration For Sales Revenue Forecast Infographic Template designed in PowerPoint, however, you can also access it in Google Slides. It comes in two aspect ratios standard and widescreen, with fully editable visual content.
-
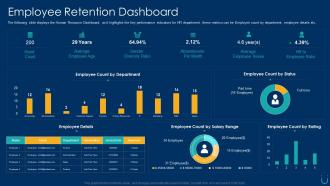 Employee retention plan retention dashboard
The following slide displays the Human Resource Dashboard, as it highlights the key performance indicators for HR department, these metrics can be Employee count by department, employee details etc.. Present the topic in a bit more detail with this Employee Retention Plan Retention Dashboard. Use it as a tool for discussion and navigation on Employee, Retention, Dashboard. This template is free to edit as deemed fit for your organization. Therefore download it now.
-
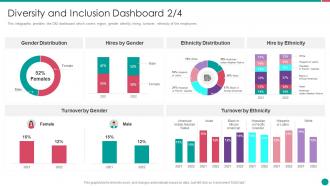 Diversity and inclusion management diversity and inclusion dashboard
This infographic provides the D and I dashboard which covers region, gender identity, hiring, turnover, ethnicity of the employees. Present the topic in a bit more detail with this Diversity And Inclusion Management Diversity And Inclusion Dashboard. Use it as a tool for discussion and navigation on Diversity And Inclusion Dashboard. This template is free to edit as deemed fit for your organization. Therefore download it now.
-
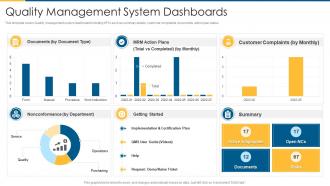 Iso 9001 quality management system dashboards
This template covers Quality management system dashboard including KPIs such as summary details, customer complaints, documents, action plan status. Deliver an outstanding presentation on the topic using this Iso 9001 Quality Management System Dashboards. Dispense information and present a thorough explanation of Quality Management System Dashboards using the slides given. This template can be altered and personalized to fit your needs. It is also available for immediate download. So grab it now.
-
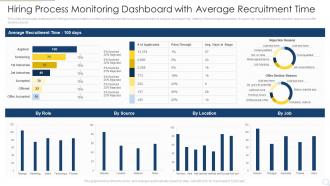 Hiring Process Monitoring Dashboard With Average Recruitment Time
This slide showcases dashboard for hiring process monthly monitoring that can assist human resource team to analyze and report key metrics of recruitment procedure. It covers key elements that are rejection reason and offer decline reason Presenting our well structured Hiring Process Monitoring Dashboard With Average Recruitment Time. The topics discussed in this slide are Process, Monitoring, Dashboard. This is an instantly available PowerPoint presentation that can be edited conveniently. Download it right away and captivate your audience.
-
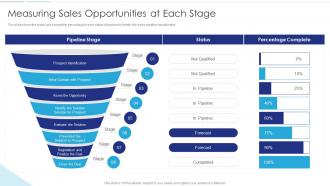 Sales Funnel Management Measuring Sales Opportunities At Each Stage
This slide shows the status and completion percentage to each stage of pipeline to identify the sales pipeline opportunities. Present the topic in a bit more detail with this Sales Funnel Management Measuring Sales Opportunities At Each Stage. Use it as a tool for discussion and navigation on Pipeline Stage, Prospect Identification, Forecast, Percentage Complete. This template is free to edit as deemed fit for your organization. Therefore download it now.
-
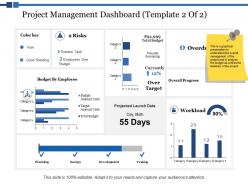 Project management dashboard risks ppt powerpoint presentation styles outfit
This is a threee stages process. The stages in this process are Finance, Marketing, Management, Investment, Analysis.
-
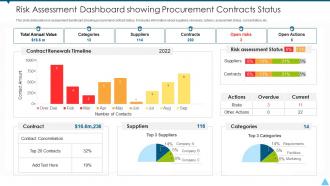 Risk assessment dashboard showing procurement contracts status
Presenting our well structured Risk Assessment Dashboard Showing Procurement Contracts Status. The topics discussed in this slide are Suppliers, Risks, Value. This is an instantly available PowerPoint presentation that can be edited conveniently. Download it right away and captivate your audience.
-
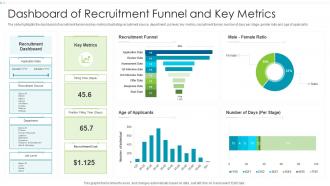 Dashboard Snapshot Of Recruitment Funnel And Key Metrics
The slide highlights the dashboard snapshot of recruitment funnel and key metrics illustrating recruitment source, department, job level, key metrics, recruitment funnel, number of days per stage, gender ratio and age of applicants. Presenting our well structured Dashboard Of Recruitment Funnel And Key Metrics. The topics discussed in this slide are Recruitment Funnel, Male Female Ratio, Recruitment Dashboard. This is an instantly available PowerPoint presentation that can be edited conveniently. Download it right away and captivate your audience.
-
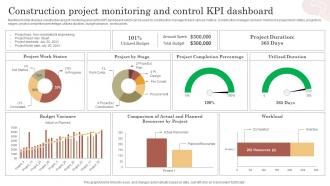 Construction Project Monitoring And Control Kpi Dashboard
Mentioned slide displays construction project monitoring and control KPI dashboard which can be used by construction manager to track various metrics. Construction manager can track metrics like project work status, projects by stages, project completion percentage, utilized duration, budget variance , workload etc. Introducing our Construction Project Monitoring And Control Kpi Dashboard set of slides. The topics discussed in these slides are Project Completion Percentage, Budget Variance, Project Work Status. This is an immediately available PowerPoint presentation that can be conveniently customized. Download it and convince your audience.
-
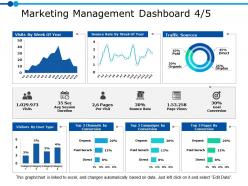 Marketing management dashboard 4 5 ppt powerpoint presentation gallery example
Presenting this set of slides with name - Marketing Management Dashboard 4 5 Ppt Powerpoint Presentation Gallery Example. This is a three stage process. The stages in this process are Business, Management, Strategy, Analysis, Marketing.
-
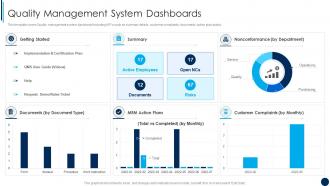 Quality Management System Dashboards ISO 9001 Quality Management Ppt Themes
This template covers Quality management system dashboard including KPIs such as summary details, customer complaints, documents, action plan status. Deliver an outstanding presentation on the topic using this Quality Management System Dashboards ISO 9001 Quality Management Ppt Themes. Dispense information and present a thorough explanation of Quality Management System Dashboards using the slides given. This template can be altered and personalized to fit your needs. It is also available for immediate download. So grab it now.
-
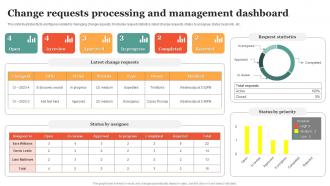 Change Requests Processing And Management Dashboard
This slide illustrates facts and figures related to managing change requests. It includes request statistics, latest change requests, status by assignee, status by priority, etc. Presenting our well structured Change Requests Processing And Management Dashboard. The topics discussed in this slide are Progress, Rejected, Review, Management Dashboard. This is an instantly available PowerPoint presentation that can be edited conveniently. Download it right away and captivate your audience.
-
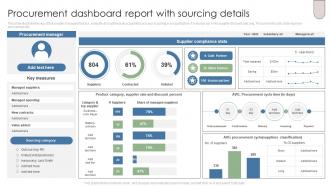 Procurement Dashboard Report With Sourcing Details
This slide illustrate the report that enable managers to track, evaluate and optimize all acquisition process occurring in a organization. It includes kpis like supplier discount rate, avg. Procurement cycle, total expense and savings etc. Introducing our Procurement Dashboard Report With Sourcing Details set of slides. The topics discussed in these slides are Procurement Manager, Sourcing Category, Supplier Compliance Stats. This is an immediately available PowerPoint presentation that can be conveniently customized. Download it and convince your audience.
-
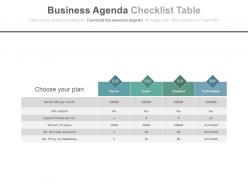 Business agenda checklist table infographics powerpoint slides
This PPT Template can be used by any organization’s executives for representing business agenda related presentations. All these images are 100% edited in terms of color, size, and orientation of the elements mentioned in the slides. These PPT slides are compatible with Google slides and can be edited in any PowerPoint software.
-
 Private Capital Powerpoint Presentation Slides
Presenting this set of slides with name - Private Capital Powerpoint Presentation Slides. The stages in this process are Private Capital, Private Equity, Venture Capital.
-
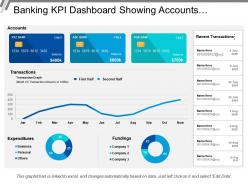 Banking kpi dashboard showing accounts expenditures fundings
Presenting this set of slides with name - Banking Kpi Dashboard Showing Accounts Expenditures Fundings. This is a three stage process. The stages in this process are Banking, Finance, Money.
-
 Project Execution Plan Timeline With Task Priority And Budget
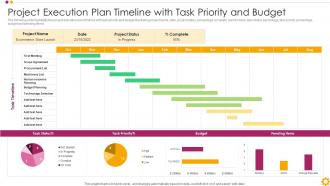
The following slide highlights the project execution plan timeline with task priority and budget illustrating project name, date, project status, percentage complete, task timeline, task status percentage, task priority percentage, budget and pending items. Introducing our Project Execution Plan Timeline With Task Priority And Budget set of slides. The topics discussed in these slides are Human Resource Planning, Technology Selection, Machinery List. This is an immediately available PowerPoint presentation that can be conveniently customized. Download it and convince your audience.
-
 Annual Sales Of Most Successful Industry Leader Uncovering Consumer Trends Through Market Research Mkt Ss
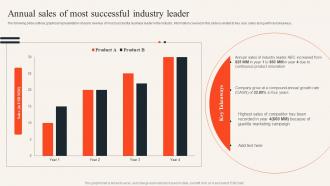
The following slide outlines graphical representation of yearly revenue of most successful business leader in the industry. Information covered in this slide is related to four year sales along with key takeaways. Deliver an outstanding presentation on the topic using this Annual Sales Of Most Successful Industry Leader Uncovering Consumer Trends Through Market Research Mkt Ss. Dispense information and present a thorough explanation of Successful, Product, Innovation using the slides given. This template can be altered and personalized to fit your needs. It is also available for immediate download. So grab it now.
-
 Monthly Product Sales Review Dashboard
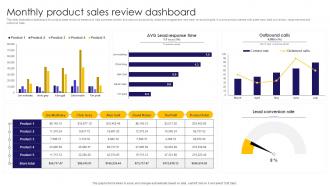
This slide illustrates a dashboard for product sales review to measure to help business monitor and improve productivity, employee engagement and meet revenue targets. It covers product names with sales reps, lead conversion, response time and outbound calls. Presenting our well structured Monthly Product Sales Review Dashboard. The topics discussed in this slide are AVG Lead Response, Time, Outbound Calls, Lead Conversion Rate. This is an instantly available PowerPoint presentation that can be edited conveniently. Download it right away and captivate your audience.


