Financials PowerPoint Templates, Financial Statement PPT Templates
- Sub Categories
-
- 30 60 90 Day Plan
- About Us Company Details
- Action Plan
- Agenda
- Annual Report
- Audit Reports
- Balance Scorecard
- Brand Equity
- Business Case Study
- Business Communication Skills
- Business Plan Development
- Business Problem Solving
- Business Review
- Capital Budgeting
- Career Planning
- Change Management
- Color Palettes
- Communication Process
- Company Location
- Company Vision
- Compare
- Competitive Analysis
- Corporate Governance
- Cost Reduction Strategies
- Custom Business Slides
- Customer Service
- Dashboard
- Data Management
- Decision Making
- Digital Marketing Strategy
- Digital Transformation
- Disaster Management
- Diversity
- Equity Investment
- Financial Analysis
- Financial Services
- Financials
- Growth Hacking Strategy
- Human Resource Management
- Innovation Management
- Interview Process
- Knowledge Management
- Leadership
- Lean Manufacturing
- Legal Law Order
- Management
- Market Segmentation
- Marketing
- Media and Communication
- Meeting Planner
- Mergers and Acquisitions
- Metaverse
- Newspapers
- Operations and Logistics
- Organizational Structure
- Our Goals
- Performance Management
- Pitch Decks
- Pricing Strategies
- Process Management
- Product Development
- Product Launch Ideas
- Product Portfolio
- Project Management
- Purchasing Process
- Quality Assurance
- Quotes and Testimonials
- Real Estate
- Risk Management
- Sales Performance Plan
- Sales Review
- SEO
- Service Offering
- Six Sigma
- Social Media and Network
- Software Development
- Solution Architecture
- Stock Portfolio
- Strategic Management
- Strategic Planning
- Supply Chain Management
- Swimlanes
- System Architecture
- Team Introduction
- Testing and Validation
- Thanks-FAQ
- Time Management
- Timelines Roadmaps
- Value Chain Analysis
- Value Stream Mapping
- Workplace Ethic
-
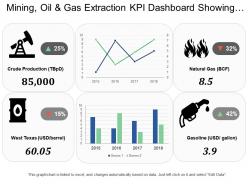 Mining oil and gas extraction kpi dashboard showing crude production and natural gas
Presenting this set of slides with name - Mining Oil And Gas Extraction Kpi Dashboard Showing Crude Production And Natural Gas. This is a four stage process. The stages in this process are Mining, Oil And Gas Extraction, Refinery, Natural Gas.
-
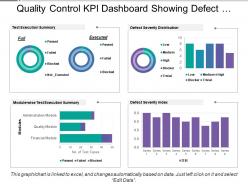 Quality control kpi dashboard showing defect severity distribution
Presenting this set of slides with name - Quality Control Kpi Dashboard Showing Defect Severity Distribution. This is a four stage process. The stages in this process are Quality Management, Quality Control, Quality Assurance.
-
 Return on investment evaluate performance adjust strategy investment process
Engage buyer personas and boost brand awareness by pitching yourself using this prefabricated set. This Return On Investment Evaluate Performance Adjust Strategy Investment Process is a great tool to connect with your audience as it contains high-quality content and graphics. This helps in conveying your thoughts in a well-structured manner. It also helps you attain a competitive advantage because of its unique design and aesthetics. In addition to this, you can use this PPT design to portray information and educate your audience on various topics. With twelve slides, this is a great design to use for your upcoming presentations. Not only is it cost-effective but also easily pliable depending on your needs and requirements. As such color, font, or any other design component can be altered. It is also available for immediate download in different formats such as PNG, JPG, etc. So, without any further ado, download it now.
-
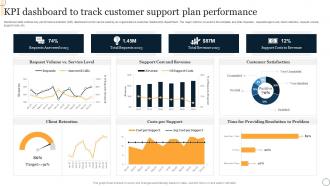 Kpi Dashboard To Track Customer Support Plan Performance
Mentioned slide outlines key performance indicator KPI dashboard which can be used by an organizations customer relationship department. The major metrics covered in the template are total requests, requests approved, client retention, request volume, support cost, etc. Introducing our Kpi Dashboard To Track Customer Support Plan Performance set of slides. The topics discussed in these slides are Client Retention, Costs Per Support, Providing Resolution. This is an immediately available PowerPoint presentation that can be conveniently customized. Download it and convince your audience.
-
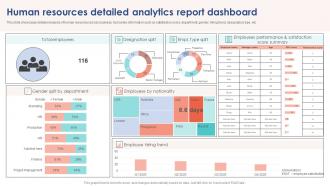 Human Resources Detailed Analytics Report Dashboard
This slide showcases detailed analysis of human resources across business. It provides information such as satisfaction score, department, gender, hiring trend, designation, type, etc. Presenting our well structured Human Resources Detailed Analytics Report Dashboard. The topics discussed in this slide are Total Employees, Designation Split, Employee Hiring Trend. This is an instantly available PowerPoint presentation that can be edited conveniently. Download it right away and captivate your audience.
-
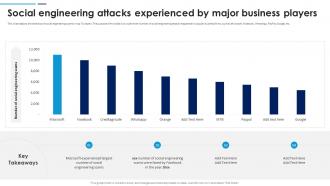 Social Engineering Attacks Prevention Social Engineering Attacks Experienced By Major Business
This slide depicts the statistics of social engineering scams in top IT players. The purpose of this slide is to outline the number of social engineering attacks happened in popular business firms, such as Microsoft, Facebook, WhatsApp, PayPal, Google, etc. Present the topic in a bit more detail with this Social Engineering Attacks Prevention Social Engineering Attacks Experienced By Major Business. Use it as a tool for discussion and navigation on Social Engineering Attacks Experienced, Social Engineering Scams, Major Business Players. This template is free to edit as deemed fit for your organization. Therefore download it now.
-
 Customer Satisfaction Dashboard With Business Growth Plan To Increase Strategy SS V
The following slide outlines visual representation of customer satisfaction dashboard that can be used to measure customer loyalty. It covers key performance indicators KPIs such as average response time, customer satisfaction score, customer effort score CES, net promote score NPS, etc. Deliver an outstanding presentation on the topic using this Customer Satisfaction Dashboard With Business Growth Plan To Increase Strategy SS V. Dispense information and present a thorough explanation of Customer, Promoter, Satisfaction using the slides given. This template can be altered and personalized to fit your needs. It is also available for immediate download. So grab it now.
-
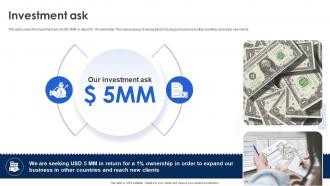 Investment Ask Philips Investor Funding Elevator Pitch Deck
This slide covers the investment ask of USD 5MM in return for 1 percent ownership. The main purpose of raising funds is to expand business in other countries and reach new clients. Introducing Investment Ask Philips Investor Funding Elevator Pitch Deck to increase your presentation threshold. Encompassed with two stages, this template is a great option to educate and entice your audience. Dispence information on Investment Ask, Reach New Clients, Ownership, using this template. Grab it now to reap its full benefits.
-
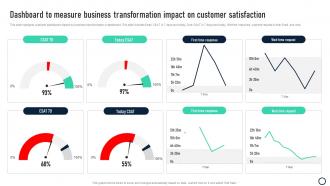 Dashboard To Measure Business Transformation Impact On Customer Satisfaction
This slide highlights customer satisfaction impact by business transformation in dashboard. This slide includes Email CSAT in 7 days and today, Chat CSAT in 7 days and today, first time response, wait time request in both Email and chat. Introducing our Dashboard To Measure Business Transformation Impact On Customer Satisfaction set of slides. The topics discussed in these slides are Dashboard Measure Business Transformation Impact, Customer Satisfaction This is an immediately available PowerPoint presentation that can be conveniently customized. Download it and convince your audience.
-
 Graphic Rating Scale Performance Improvement Icon
Introducing our premium set of slides with Graphic Rating Scale Performance Improvement Icon Ellicudate the three stages and present information using this PPT slide. This is a completely adaptable PowerPoint template design that can be used to interpret topics like Graphic Rating Scale, Performance Improvement Icon So download instantly and tailor it with your information.
-
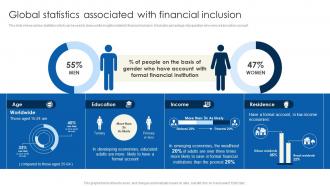 Global Statistics Associated Financial Inclusion To Promote Economic Fin SS
This slide shows various statistics which can be used to draw useful insights related to financial inclusion. It includes percentage of population who owns a transaction account. Present the topic in a bit more detail with this Global Statistics Associated Financial Inclusion To Promote Economic Fin SS. Use it as a tool for discussion and navigation on Education, Income, Residence. This template is free to edit as deemed fit for your organization. Therefore download it now.
-
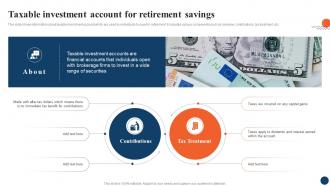 Taxable Investment Strategic Retirement Planning To Build Secure Future Fin SS
This slide shows information about taxable investment account which are used by individuals to save for retirement. It includes various components such as overview, contributions, tax treatment, etc. Introducing Taxable Investment Strategic Retirement Planning To Build Secure Future Fin SS to increase your presentation threshold. Encompassed with two stages, this template is a great option to educate and entice your audience. Dispence information on Tax Treatment, Contributions, Tax Benefit, using this template. Grab it now to reap its full benefits.
-
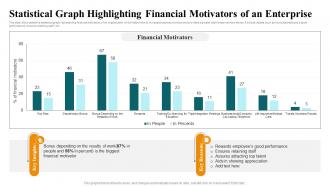 Statistical Graph Highlighting Financial Motivators Of An Enterprise
This slide showcases the statistical graph representing financial motivators of an organization which helps them to increase business revenue and provides a greater staff empowerment sense. It include details such as rewards employees good performance, ensures retaining staff, etc. Introducing our Statistical Graph Highlighting Financial Motivators Of An Enterprise set of slides. The topics discussed in these slides are Financial Motivators, Key Insights, Key Reasons.This is an immediately available PowerPoint presentation that can be conveniently customized. Download it and convince your audience.
-
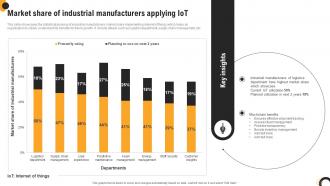 Market Share Of Industrial Manufacturers Applying Iot
This slide showcases the statistical analysis of industrial manufacturers market share implementing internet of things which helps an organization to clearly understand its benefits for future growth. It include details such as logistics department, supply chain management, etc. Presenting our well structured Market Share Of Industrial Manufacturers Applying IoT. The topics discussed in this slide are Industrial Manufacturers, Blockchain Benefits, Internet Of Things. This is an instantly available PowerPoint presentation that can be edited conveniently. Download it right away and captivate your audience.
-
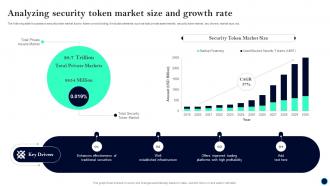 Analyzing Security Token Beginners Guide To Successfully Launch Security Token BCT SS V
The following slide focusses on security token market size to foster crowd funding. It includes elements such as total private asset market, security token market, key drivers, market size, etc. Deliver an outstanding presentation on the topic using this Analyzing Security Token Beginners Guide To Successfully Launch Security Token BCT SS V. Dispense information and present a thorough explanation of Security Token, Market Size, Key Drivers using the slides given. This template can be altered and personalized to fit your needs. It is also available for immediate download. So grab it now.
-
 KPI Pyramid Customer Satisfaction Retention Acquisition Cost
Deliver a credible and compelling presentation by deploying this KPI Pyramid Customer Satisfaction Retention Acquisition Cost. Intensify your message with the right graphics, images, icons, etc. presented in this complete deck. This PPT template is a great starting point to convey your messages and build a good collaboration. The twelve slides added to this PowerPoint slideshow helps you present a thorough explanation of the topic. You can use it to study and present various kinds of information in the form of stats, figures, data charts, and many more. This Academic Learning Notes Certificate Textbook Presentation Degree PPT slideshow is available for use in standard and widescreen aspects ratios. So, you can use it as per your convenience. Apart from this, it can be downloaded in PNG, JPG, and PDF formats, all completely editable and modifiable. The most profound feature of this PPT design is that it is fully compatible with Google Slides making it suitable for every industry and business domain.
-
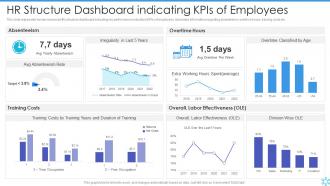 Hr Structure Dashboard Snapshot Indicating Kpis Of Employees
This slide represents human resource HR structure dashboard Snapshot indicating key performance indicators KPIs of employees. it provides information regarding absenteeism, overtime hours, training costs etc. Presenting our well-structured Hr Structure Dashboard Indicating Kpis Of Employees. The topics discussed in this slide are Structure, Dashboard, Employees. This is an instantly available PowerPoint presentation that can be edited conveniently. Download it right away and captivate your audience.
-
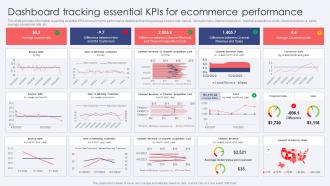 Dashboard Tracking Essential KPIS For Ecommerce Performance Ecommerce Website Development
This slide provides information regarding essential KPIs for ecommerce performance dashboard tracking average bounce rate, new vs old customers, channel revenue vs channel acquisitions costs, channel revenue vs sales, average conversion rate, etc. Present the topic in a bit more detail with this Dashboard Tracking Essential KPIS For Ecommerce Performance Ecommerce Website Development. Use it as a tool for discussion and navigation on Returning Customers, Channel Revenue, Projected Sales. This template is free to edit as deemed fit for your organization. Therefore download it now.
-
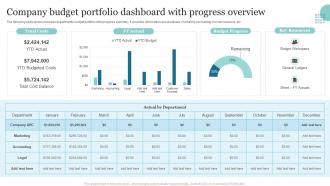 Company Budget Portfolio Dashboard With Progress Overview
The following slide shows business departments budget portfolio with progress summary. It provides information about actuals, marketing accounting, human resource, etc. Introducing our Company Budget Portfolio Dashboard With Progress Overview set of slides. The topics discussed in these slides are Total Costs, Budget Progress, Key Resources. This is an immediately available PowerPoint presentation that can be conveniently customized. Download it and convince your audience.
-
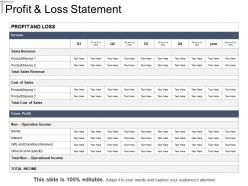 Profit and loss statement powerpoint presentation
Presenting a PPT slide named Profit and Loss Statement PowerPoint Presentation. This PowerPoint slide is professionally made and is editable for your convenience. It contains refined content. The text and content can be changed. The font color, size, and style can be formatted. Alter the color and shape of the diagrams. Get easy access to slide owing to its compatibility with Google Slides. Conversion of the slide to PDF and JPG formats is possible.
-
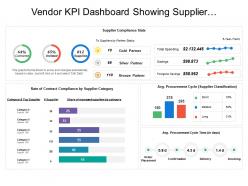 Vendor kpi dashboard showing supplier compliance stats and procurement cycle time
Presenting this set of slides with name - Vendor Kpi Dashboard Showing Supplier Compliance Stats And Procurement Cycle Time. This is a four stage process. The stages in this process are Vendor, Supplier, Retailer.
-
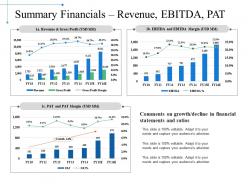 Summary financials revenue ebitda pat powerpoint slide download
Presenting this set of slides with name - Summary Financials Revenue Ebitda Pat Powerpoint Slide Download. This is a four stage process. The stages in this process are Business, Marketing, Finance, Planning, Analysis.
-
 Company profile bmw group company profile with overview financials and statistics from 2014-2018
This report is an extensively researched profile on company Company Profile BMW Group Company Profile With Overview Financials And Statistics From 2014 to 2018 in industry Consumer Goods And FMCG and Retail and Trade and E-Commerce and has been prepared by SlideTeam industry experts after extensively researching through hundreds of data sources. This is part of our Company Profiles products selection, and you will need a Paid account to download the actual report with accurate data and sources for each statistic and fact. Downloaded report will be in Powerpoint and will contain the actual editable slides with the actual data and sources for each data where applicable. Download it immediately and use it for your business.
-
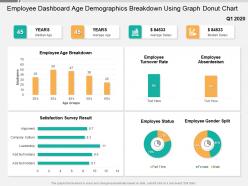 Employee dashboard age demographics breakdown using graph donut chart
Presenting this set of slides with name Employee Dashboard Age Demographics Breakdown Using Graph Donut Chart. The topics discussed in these slide is Employee Dashboard Age Demographics Breakdown Using Graph Donut Chart. This is a completely editable PowerPoint presentation and is available for immediate download. Download now and impress your audience.
-
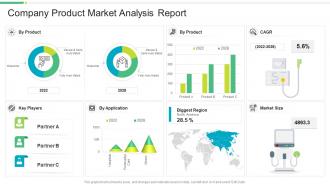 Company product market analysis report
Introducing our Company Product Market Analysis Report set of slides. The topics discussed in these slides are Company Product Market Analysis Report. This is an immediately available PowerPoint presentation that can be conveniently customized. Download it and convince your audience.
-
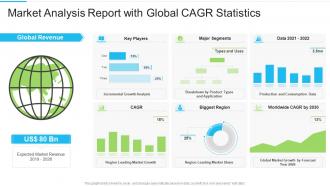 Market analysis report with global cagr statistics
Presenting our well-structured Market Analysis Report With Global CAGR Statistics. The topics discussed in this slide are Market Analysis Report With Global CAGR Statistics. This is an instantly available PowerPoint presentation that can be edited conveniently. Download it right away and captivate your audience.
-
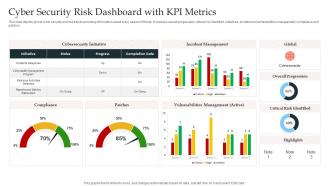 Cyber Security Risk Dashboard Snapshot With KPI Metrics
This slide depicts global cyber security and risk trends providing information about every aspect of threat. It includes overall progression, critical risk identified, initiatives, incident and vulnerabilities management, compliance and patches. Introducing our Cyber Security Risk Dashboard Snapshot With KPI Metrics set of slides. The topics discussed in these slides are Incident Management, Global, Cybersecurity, Vulnerabilities Management. This is an immediately available PowerPoint presentation that can be conveniently customized. Download it and convince your audience.
-
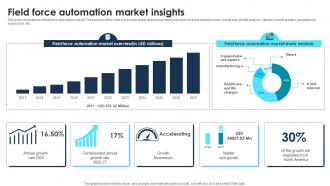 Field Force Automation Market Insights
This slide shows trends of field force automation market. The purpose of this slide is to provide target audience an extensive report of recent developments, market size, growth analysis, category market growths, geographical expansions, etc. Introducing our Field Force Automation Market Insights set of slides. The topics discussed in these slides are Automation Market, Accelerating, Automation Market Overview. This is an immediately available PowerPoint presentation that can be conveniently customized. Download it and convince your audience.
-
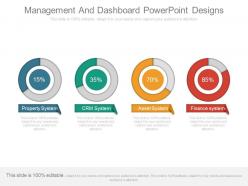 Ppt management and dashboard powerpoint designs
The PPT template use high-resolution icons and the graphics. It is a completely editable PPT slide icon to ensure you edit all the required information in the template. User can replace the traditional watermark in the template with company’s name or logo. This ready to use management PPT icon is useful for the business owners, human resource individuals and the management learners. The stages in this process are property system, crm system, asset system, finance system.
-
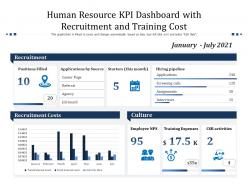 Human resource kpi dashboard with recruitment and training cost
Presenting our well structured Human Resource KPI Dashboard With Recruitment And Training Cost. The topics discussed in this slide are Human Resource KPI Dashboard With Recruitment And Training Cost. This is an instantly available PowerPoint presentation that can be edited conveniently. Download it right away and captivate your audience.
-
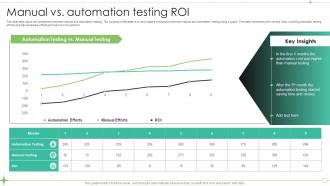 Manual Vs Automation Testing ROI
This slide talks about the comparison between manual and automation testing. The purpose of this slide is to showcase a comparison between manual and automation testing using a graph. The table represents nine months data, including automatic testing efforts and manual testing efforts and returns on investment. Presenting our well structured Manual Vs Automation Testing ROI. The topics discussed in this slide are Automation Testing, Manual Testing, ROI. This is an instantly available PowerPoint presentation that can be edited conveniently. Download it right away and captivate your audience.
-
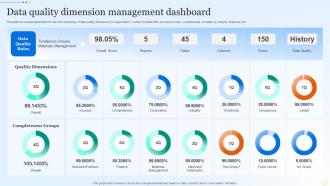 Data Quality Dimension Management Dashboard
This slide showcases dashboard for real time monitoring of data quality dimensions for organization. It further includes KPIs such as accuracy, completeness, consistency, integrity, timeliness, etc. Introducing our Data Quality Dimension Management Dashboard set of slides. The topics discussed in these slides are Data Quality Rules,Timeliness Groups,Materials Management,Quality Dimensions. This is an immediately available PowerPoint presentation that can be conveniently customized. Download it and convince your audience.
-
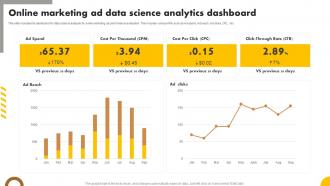 Online Marketing Ad Data Science Analytics Dashboard
This slide includes the dashboard for data science analysis for online marketing ad performance evaluation. This includes various KPIs such as Ad spend, Ad reach, Ad clicks, CPC, etc. Introducing our Online Marketing Ad Data Science Analytics Dashboard set of slides. The topics discussed in these slides are Marketing, Data, Analytics. This is an immediately available PowerPoint presentation that can be conveniently customized. Download it and convince your audience.
-
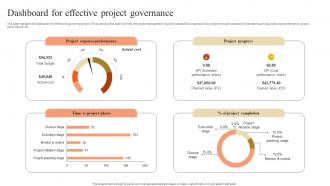 Dashboard For Effective Project Governance
This slide highlights the dashboard for effectively governing project. The purpose of this slide is to help the project management track and assess the progress of any project through evaluation of indicators such as project cost performance, project performance, etc. Introducing our Dashboard For Effective Project Governance set of slides. The topics discussed in these slides are Governance, Dashboard, Performance. This is an immediately available PowerPoint presentation that can be conveniently customized. Download it and convince your audience.
-
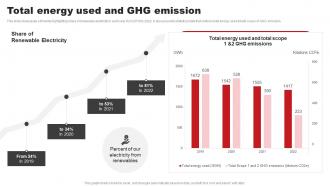 Total Energy Used And Ghg Emission ABB Company Profile CP SS
This slide showcases a timeline highlighting share of renewable electricity in each year from 2019 to 2022. It also presents statistical data that outlines total energy used and total scope of GHG emission. Present the topic in a bit more detail with this Total Energy Used And Ghg Emission ABB Company Profile CP SS. Use it as a tool for discussion and navigation on Share Renewable Electricity, Percent Our, Electricity Renewables. This template is free to edit as deemed fit for your organization. Therefore download it now.
-
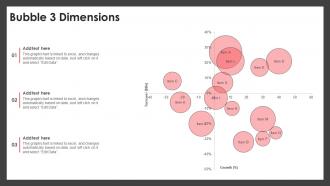 Bubble 3 Dimensions PU CHART SS
Introducing our Bubble 3 Dimensions PU CHART SS set of slides. The topics discussed in these slides are Bubbles 4 Dimensions. This is an immediately available PowerPoint presentation that can be conveniently customized. Download it and convince your audience.
-
 Quality Improvement Budgeting Powerpoint Presentation Slides
Presenting Quality Improvement Budgeting PowerPoint Presentation Slides. Change PowerPoint structure, font, text, color and design as per your way. Easy to put in company logo, brand or name. Ideal for marketing professionals, business managers, entrepreneurs and big organizations. This presentation theme is totally attuned with Google slide. Easy conversion to other software like JPG and PDF format. Image quality remains unchanged even when you resize the image.
-
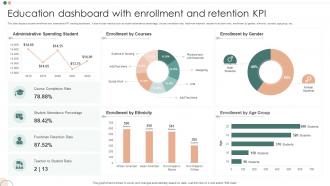 Education Dashboard With Enrollment And Retention KPI
This slide displays student enrollment and attendance KPI tracking dashboard. It also include metrics such as student attendance percentage, course completion rate, freshman retention, teacher-to-student ratio, enrollment by gender, ethnicity, courses, age group, etc. Introducing our Education Dashboard With Enrollment And Retention KPI set of slides. The topics discussed in these slides are Education Dashboard, Enrollment And Retention KPI. This is an immediately available PowerPoint presentation that can be conveniently customized. Download it and convince your audience.
-
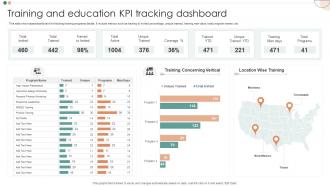 Training And Education KPI Tracking Dashboard
This slide showcases dashboard for tracking training programs details. It include metrics such as training to invited percentage, unique trained, training man days, total program names, etc. Introducing our Training And Education KPI Tracking Dashboard set of slides. The topics discussed in these slides are Training And Education, KPI Tracking Dashboard. This is an immediately available PowerPoint presentation that can be conveniently customized. Download it and convince your audience.
-
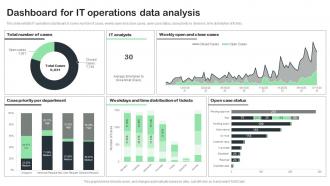 Dashboard For IT Operations Data Analysis
This slide exhibits IT operations dashboard. It covers number of cases, weekly open and close cases, open case status, case priority by divisions, time distribution of tickets. Introducing our Dashboard For IT Operations Data Analysis set of slides. The topics discussed in these slides are Case Priority, Distribution Of Tickets, Open Case Status. This is an immediately available PowerPoint presentation that can be conveniently customized. Download it and convince your audience.
-
 0115 business man with bar graph and growth chart powerpoint template
Efficiently created Presentation design. Insert your valuable trade details such as image, icon or sign. Translatable into various format options i.e. JPEG or PDF. User friendly structure of the PPT designs. Choice to edit the content, style, size and orientation of the PowerPoint layout. Use of high resolution images and the graphics in the designing. Comfort to share the presentation template in standard and widescreen view.
-
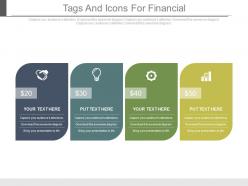 Four tags and icons for financial update powerpoint slides
The visuals impose a stunning impact with its high-resolution picture quality. Download the template in various file formats available. Conduct an easy play of templates in Google slides and other software options. Utilize the unlimited customize options to fabricate the Ppt as per your suitability. Insert the desired text and other details of your company with a few clicks.
-
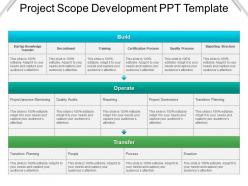 Project scope development ppt template
Presenting Project Scope Development PPT Template which is completely editable. You can open and save your presentation in various formats like PDF, JPG, and PNG. The template is compatible with Google Slides, which makes it accessible at once. The slide is readily available in both 4:3 and 16:9 aspect ratio. Customize the colors, fonts, font type, and font size of the template as per your requirements.
-
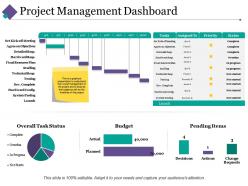 Project management dashboard snapshot ppt pictures infographic template
Displaying project management dashboard snapshot PPT picture infographic template. Alter the design with trade components like name and picture. Presentation slide is well-harmonized with Google slides. Colors and text can be replaced as the PowerPoint graphic comes with easy editing options. Rapid and easy download with saving options. PPT diagram can be viewed in both standard and widescreen display view. Flexible with other software options such as PDF or JPG formats.
-
 Procurement optimization dashboard showing suppliers and saving powerpoint template
This slide shows graphs of various metrics for the procurement optimization. Data covered under this dashboard include the number of parts per supplier, total savings, top subcategories by spend, suppliers per month and saving per month. This is a Procurement Optimization Dashboard Showing Suppliers And Saving Powerpoint Template drafted with a diverse set of graphics, that can be reformulated and edited as per your needs and requirements. Just download it in your system and make use of it in PowerPoint or Google Slides, depending upon your presentation preferences.
-
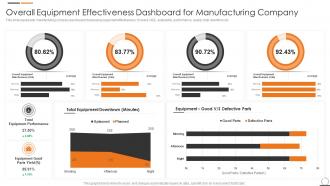 Overall Equipment Effectiveness Dashboard For Manufacturing Company
This slide represents manufacturing company dashboard showcasing equipment effectiveness. It covers OEE, availability, performance, quality, total downtime etc. Introducing our Overall Equipment Effectiveness Dashboard For Manufacturing Company set of slides. The topics discussed in these slides are Equipment, Effectiveness, Dashboard, Manufacturing. This is an immediately available PowerPoint presentation that can be conveniently customized. Download it and convince your audience.
-
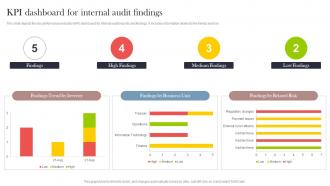 KPI Dashboard For Internal Audit Findings
This slide depicts the key performance indicator KPI dashboard for internal audit reports and findings. It includes information related to the trends and risk. Introducing our KPI Dashboard For Internal Audit Findings set of slides. The topics discussed in these slides are Findings, High Findings, Medium Findings, Low Findings. This is an immediately available PowerPoint presentation that can be conveniently customized. Download it and convince your audience.
-
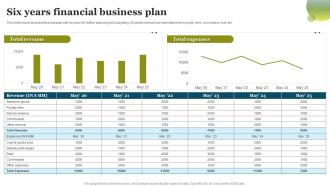 Six Years Financial Business Plan
This slide shows business financial plan with six years for further planning and budgeting. It include revenue and expenditure from royalty fees, commission, rent, etc. Introducing our Six Years Financial Business Plan set of slides. The topics discussed in these slides are Total Revenue, Financial Business, Plan. This is an immediately available PowerPoint presentation that can be conveniently customized. Download it and convince your audience.
-
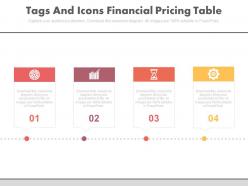 Four tags and icons financial pricing table powerpoint slides
Applicable by marketing department of several organizations along with entrepreneurs and managerial students. Plethora of professionally crafted slides. Thoroughly editable PowerPoint presentation. Modify the content at your personal comfort and need. Personalize it with your company name and logo. Download and save the presentation in desired format. Compatible with wide variety of online and offline software options.
-
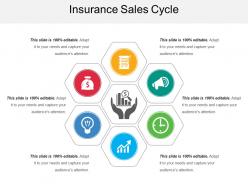 Insurance sales cycle
Presenting this set of slides with name - Insurance Sales Cycle. This is a six stage process. The stages in this process are Insurance Sales, Insurance Leads, Insurance Conversions.
-
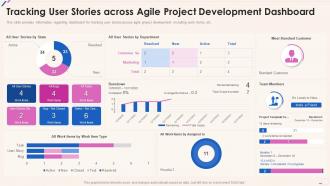 Tracking User Stories Across Agile Project Development Dashboard Agile Playbook
This slide provides information regarding dashboard for tracking user stories across agile project development including work items, etc. Deliver an outstanding presentation on the topic using this Tracking User Stories Across Agile Project Development Dashboard Agile Playbook. Dispense information and present a thorough explanation of Customer, Marketing, Stories Remaining, Total Scope Increase using the slides given. This template can be altered and personalized to fit your needs. It is also available for immediate download. So grab it now.
-
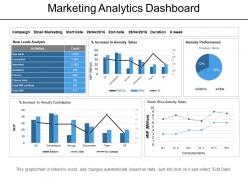 Marketing analytics dashboard powerpoint slide clipart
Presenting Marketing Analytics Assessment PowerPoint Templates. The designs are 100% editable in this PowerPoint template. The font size, font color, graphic colors, and slide background can be customized without any hassle. The users can add or remove the images according to their needs. This template includes one slide which is designed by keeping compatibility with Google Slides in mind. It is available in both standard and widescreen.
-
 Financial ratio kpi dashboard showing liquidity ratio analysis current ratio and quick ratio
Presenting this set of slides with name - Financial Ratio Kpi Dashboard Showing Liquidity Ratio Analysis Current Ratio And Quick Ratio. This is a three stage process. The stages in this process are Accounting Ratio, Financial Statement, Financial Ratio.
-
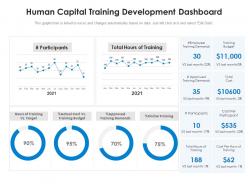 Human capital training development dashboard
Introducing our Human Capital Training Development Dashboard set of slides. The topics discussed in these slides are Training Budget, Training Demands, Online Training. This is an immediately available PowerPoint presentation that can be conveniently customized. Download it and convince your audience.
-
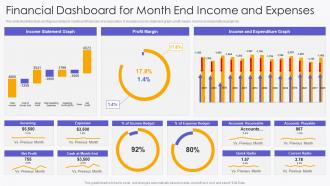 Financial Dashboard Snapshot For Month End Income And Expenses
This slide illustrates facts and figures related to month end financials of a corporation. It includes income statement graph, profit margin, income and expenditure graph etc. Introducing our Financial Dashboard Snapshot For Month End Income And Expenses set of slides. The topics discussed in these slides are Financial Dashboard For Month End Income And Expenses. This is an immediately available PowerPoint presentation that can be conveniently customized. Download it and convince your audience.
-
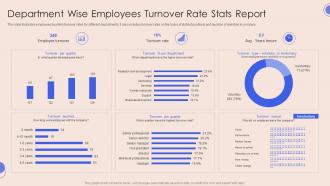 Department Wise Employees Turnover Rate Stats Report
This slide illustrates employees quarterly turnover rates for different departments. It also includes turnover rates on the basis of distinct positions and duration of retention in company. Presenting our well structured Department Wise Employees Turnover Rate Stats Report. The topics discussed in this slide are Turnover Per Quarter, Turnover Buckets, Turnover Reason. This is an instantly available PowerPoint presentation that can be edited conveniently. Download it right away and captivate your audience.
-
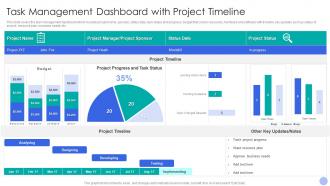 Task Management Dashboard With Project Timeline
This slide covers the task management dashboard which includes project name, sponsor, status date, task status and progress, budget that covers resources, hardware and software with timeline, key updates such as status of project, resource plan, business needs, etc. Presenting our well structured Task Management Dashboard With Project Timeline. The topics discussed in this slide are Management, Dashboard, Timeline. This is an instantly available PowerPoint presentation that can be edited conveniently. Download it right away and captivate your audience.
-
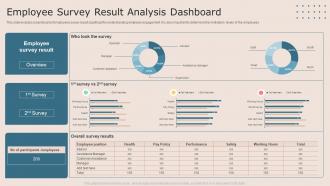 Employee Survey Result Analysis Dashboard
This slide includes a dashboard of employees survey result significant for understanding employee engagement. It is also important to determine the motivation levels of the employees. Presenting our well structured Employee Survey Result Analysis Dashboard. The topics discussed in this slide are Employee Survey, Result Analysis, Dashboard. This is an instantly available PowerPoint presentation that can be edited conveniently. Download it right away and captivate your audience.
-
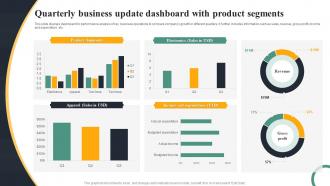 Quarterly Business Update Dashboard With Product Segments
This slide displays dashboard for performance analysis of key business operations to compare companys growth in different quarters. It further includes information such as sales, revenue, gross profit, income and expenditure, etc. Introducing our Quarterly Business Update Dashboard With Product Segments set of slides. The topics discussed in these slides are Product Segments, Income And Expenditure, Electronics. This is an immediately available PowerPoint presentation that can be conveniently customized. Download it and convince your audience.
-
 Quarterly Business Sales Performance Review
The following slide highlights the quarter wise sales performance to analyse the trend. It includes elements such as product wise sales revenue graph along with comparison of planned VS actual results etc. Presenting our well structured Quarterly Business Sales Performance Review. The topics discussed in this slide are Product Wise, Sales Analysis. This is an instantly available PowerPoint presentation that can be edited conveniently. Download it right away and captivate your audience.


