Financials PowerPoint Templates, Financial Statement PPT Templates
- Sub Categories
-
- 30 60 90 Day Plan
- About Us Company Details
- Action Plan
- Agenda
- Annual Report
- Audit Reports
- Balance Scorecard
- Brand Equity
- Business Case Study
- Business Communication Skills
- Business Plan Development
- Business Problem Solving
- Business Review
- Capital Budgeting
- Career Planning
- Change Management
- Color Palettes
- Communication Process
- Company Location
- Company Vision
- Compare
- Competitive Analysis
- Corporate Governance
- Cost Reduction Strategies
- Custom Business Slides
- Customer Service
- Dashboard
- Data Management
- Decision Making
- Digital Marketing Strategy
- Digital Transformation
- Disaster Management
- Diversity
- Equity Investment
- Financial Analysis
- Financial Services
- Financials
- Growth Hacking Strategy
- Human Resource Management
- Innovation Management
- Interview Process
- Knowledge Management
- Leadership
- Lean Manufacturing
- Legal Law Order
- Management
- Market Segmentation
- Marketing
- Media and Communication
- Meeting Planner
- Mergers and Acquisitions
- Metaverse
- Newspapers
- Operations and Logistics
- Organizational Structure
- Our Goals
- Performance Management
- Pitch Decks
- Pricing Strategies
- Process Management
- Product Development
- Product Launch Ideas
- Product Portfolio
- Project Management
- Purchasing Process
- Quality Assurance
- Quotes and Testimonials
- Real Estate
- Risk Management
- Sales Performance Plan
- Sales Review
- SEO
- Service Offering
- Six Sigma
- Social Media and Network
- Software Development
- Solution Architecture
- Stock Portfolio
- Strategic Management
- Strategic Planning
- Supply Chain Management
- Swimlanes
- System Architecture
- Team Introduction
- Testing and Validation
- Thanks-FAQ
- Time Management
- Timelines Roadmaps
- Value Chain Analysis
- Value Stream Mapping
- Workplace Ethic
-
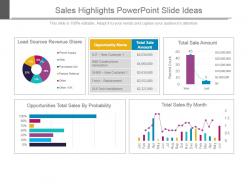 Sales highlights powerpoint slide ideas
Presenting sales highlights powerpoint slide ideas. This is a sales highlights powerpoint slide ideas. This is a five stage process. The stages in this process are lead sources revenue share, opportunity name, total sale amount, total sale amount, opportunities total sales by probability, total sales by month.
-
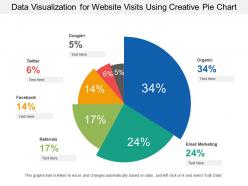 Data visualization for website visits using creative pie chart
Presenting this set of slides with name - Data Visualization For Website Visits Using Creative Pie Chart. This is a six stage process. The stages in this process are Data Visualization, Data Management, Data Representation.
-
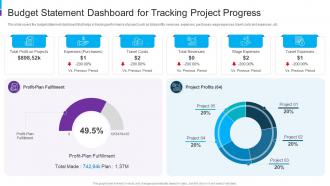 Budget Statement Dashboard For Tracking Project Progress
This slide covers the budget statement dashboard that helps in tracking performance of project such as total profits, revenues, expenses, purchases, wage expenses, travel costs and expenses , etc. Presenting our well structured Budget Statement Dashboard For Tracking Project Progress. The topics discussed in this slide are Profit Plan Fulfilment, Project Profits, Travel Costs, Total Revenues, Wage Expenses, Travel Expenses. This is an instantly available PowerPoint presentation that can be edited conveniently. Download it right away and captivate your audience.
-
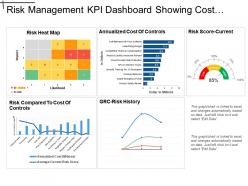 Risk Management Kpi Dashboard Showing Cost Of Control And Risk Score
Presenting this set of slides with name - Risk Management Kpi Dashboard Showing Cost Of Control And Risk Score. This is a five stage process. The stages in this process are Risk Management, Risk Assessment, Project Risk.
-
 Crowdfunding Technical Strategies And Challenges Powerpoint Presentation Slides
Introducing Crowdfunding Technical Strategies And Challenges PowerPoint presentation comprising a total of 58 slides. Each slide focuses on one of the aspects of Crowdfunding with content extensively researched by our business research team. Our team of PPT designers used the best of professional PowerPoint templates, images, icons and layouts. Also included are impressive, editable data visualization tools like charts, graphs and tables. When you download this presentation by clicking the Download button, you get the presentation in both standard and widescreen format. All slides are fully customizable. Change the colors, font, size, add and remove things as per your need and present before your audience.
-
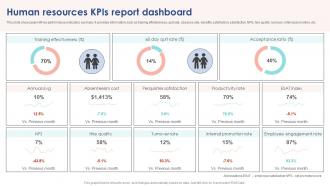 Human Resources KPIs Report Dashboard
This slide showcases HR key performance indicators summary. It provides information such as training effectiveness, quit rate, absence rate, benefits satisfaction, satisfaction, NPS, hire quality, turnover, internal promotion, etc. Introducing our Human Resources KPIs Report Dashboard set of slides. The topics discussed in these slides are Absenteeism Cost, Perquisites Satisfaction, Productivity Rate. This is an immediately available PowerPoint presentation that can be conveniently customized. Download it and convince your audience.
-
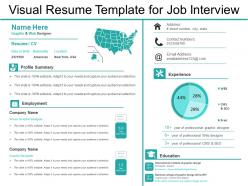 Visual resume template for job interview
Presenting Visual Resume Template For Job Interview. You can make changes to the slideshow according to the needs. Add appealing data visualization tools including charts, graphs, tables, etc. to the slide. The template is also compatible with Google Slides. It is further editable in MS PowerPoint and similar software. Save it into common images or document formats such as JPEG, PNG or PDF. High-quality graphics will prevent distortion at any cost.
-
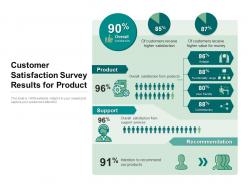 Customer satisfaction survey results for product
Presenting this set of slides with name Customer Satisfaction Survey Results For Product. This is a one stage process. The stages in this process are Product, Support, Recommendation. This is a completely editable PowerPoint presentation and is available for immediate download. Download now and impress your audience.
-
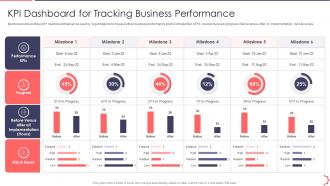 Kpi Dashboard For Tracking Business AI Playbook Accelerate Digital Transformation
Mentioned slide portrays KPI dashboard that can be used by organizations to measure their business performance post AI introduction. KPIS covered here are progress, Before versus After AI Implementation, risks and issues. Present the topic in a bit more detail with this Kpi Dashboard For Tracking Business AI Playbook Accelerate Digital Transformation . Use it as a tool for discussion and navigation on KPI Dashboard For Tracking Business Performance . This template is free to edit as deemed fit for your organization. Therefore download it now.
-
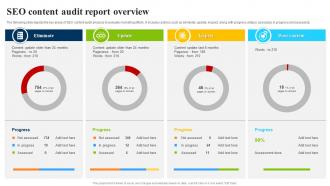 SEO Content Audit Report Overview
The following slide depicts the key areas of SEO content audit analysis to evaluate marketing efforts. It includes actions such as eliminate, update, inspect, along with progress status assessed, in progress and assessed. Introducing our SEO Content Audit Report Overview set of slides. The topics discussed in these slides are Eliminate, Update, Inspect, Poor Content, Progress. This is an immediately available PowerPoint presentation that can be conveniently customized. Download it and convince your audience.
-
 Six staged circle pie chart with percentage powerpoint slides
This PPT slide can be used for business and finance related presentations. All the icons used here are 100% editable in a PowerPoint software, you can change the color, size, and orientation of any icon to your liking. You can insert your company logo in the PPT slide, which is also compatible with google slides.
-
 Due Diligence Powerpoint Presentation Slides
Presenting this set of slides with name - Due Diligence Powerpoint Presentation Slides. This is a one stage process. The stages in this process are Investment Audit, Reasonable Investigation, Due Diligence.
-
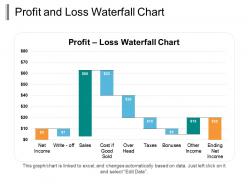 Profit and loss waterfall chart ppt infographic template
Presenting the Profit And Loss Waterfall Chart PPT Infographic Template. You can edit this template in PowerPoint. The PPT layout is customizable. You can link the slide to your excel sheet and the graph will change accordingly. The slide is available in both standard and wide screen formats. You can change the colors of the chart and bars and the background as well to suit your needs. So go ahead and make your presentation with a few clicks.
-
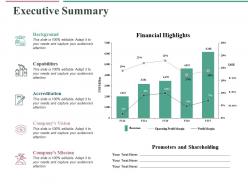 Executive summary ppt professional display
Presenting this set of slides with name - Executive Summary Ppt Professional Display. This is a five stage process. The stages in this process are Bar Chart, Marketing, Strategy, Planning, Finance.
-
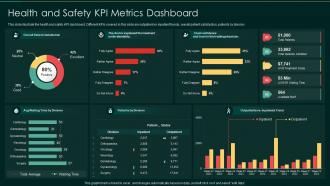 Health and safety kpi metrics dashboard
Presenting our well structured Health And Safety KPI Metrics Dashboard. The topics discussed in this slide are Health And Safety KPI Metrics Dashboard. This is an instantly available PowerPoint presentation that can be edited conveniently. Download it right away and captivate your audience.
-
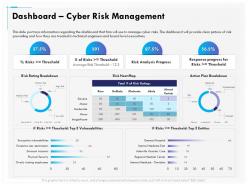 Dashboard Cyber Risk Management Breakdown Ppt Infographics
This slide portrays information regarding the dashboard that firm will use to manage cyber risks. The dashboard will provide clear picture of risk prevailing and how they are treated to technical engineers and board level executives. Presenting this set of slides with name Dashboard Cyber Risk Management Breakdown Ppt Infographics. The topics discussed in these slides are Dashboard Cyber Risk Management. This is a completely editable PowerPoint presentation and is available for immediate download. Download now and impress your audience.
-
 Crowd funding powerpoint presentation slides
Presenting Crowdfunding PowerPoint Presentation Slides. Set of 57 PowerPoint Slides and professional layouts. When you download the PPT, you get the deck in both widescreen (16:9) and standard (4:3) aspect ratio. This ready-to-use PPT comprises visually stunning PowerPoint templates, vector icons, images, data-driven charts and graphs and business diagrams. The PowerPoint presentation is 100% editable. Customize the presentation background, font, and colours as per your company’s branding. The slide templates are compatible with Google slides, PDF and JPG formats
-
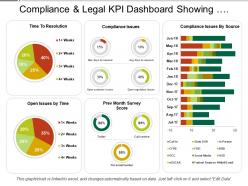 Compliance and legal kpi dashboard showing compliance issues and resolution time
Presenting this set of slides with name - Compliance And Legal Kpi Dashboard Showing Compliance Issues And Resolution Time. This is a three stage process. The stages in this process are Compliance And Legal, Legal Governance, Risk Management.
-
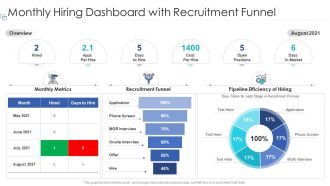 Monthly hiring dashboard with recruitment funnel
Presenting our well structured Monthly Hiring Dashboard With Recruitment Funnel. The topics discussed in this slide are Monthly Hiring Dashboard With Recruitment Funnel. This is an instantly available PowerPoint presentation that can be edited conveniently. Download it right away and captivate your audience.
-
 Hr metrics staff composition dashboard sample ppt files
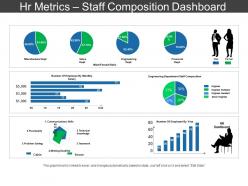
Presenting HR Metrics Staff Composition Dashboard Sample PPT Files which is completely editable. You can open and save your presentation in various formats like PDF, JPG, and PNG. Freely access this template in both 4:3 and 16:9 aspect ratio. Change the color, font, font size, and font type of the slides as per your requirements. This template is adaptable with Google Slides which makes it easily accessible at once.
-
 Build operate transfer framework powerpoint template
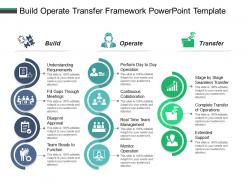
Presenting Build Operate Transfer Framework PowerPoint Template. The slide supports both widescreen(16:9) and standard screen(4:3) ratios. Moreover, the template is compatible with Google Slides. You can save this template into multiple image or document formats such as JPEG, PNG or PDF with ease. High-quality graphics will ensure that quality is not affected when size is enlarged.
-
 Effective pipeline management sales customer deal tracking in dashboard
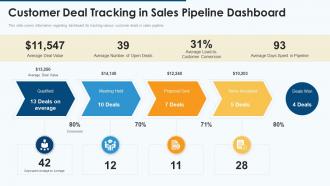
This slide covers information regarding dashboard for tracking various customer deals in sales pipeline. Increase audience engagement and knowledge by dispensing information using Effective Pipeline Management Sales Customer Deal Tracking In Dashboard. This template helps you present information on four stages. You can also present information on Qualified, Meeting Held, Proposal Sent, Terms Accepted using this PPT design. This layout is completely editable so personaize it now to meet your audiences expectations.
-
 Executive summary ppt pictures icon
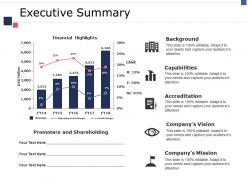
Presenting this set of slides with name - Executive Summary Ppt Pictures Icon. This is a five stage process. The stages in this process are Financial Highlights, Background, Capabilities, Accreditation, Usd Million.
-
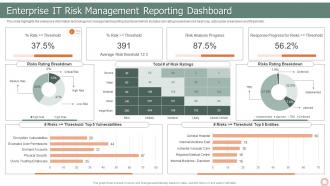 IT Risk Management Strategies Enterprise IT Risk Management Reporting Dashboard
This slide highlights the enterprise information technology risk management reporting dashboard which includes risk rating breakdown risk heat map, action plan breakdown and thresholds. Deliver an outstanding presentation on the topic using this IT Risk Management Strategies Enterprise IT Risk Management Reporting Dashboard. Dispense information and present a thorough explanation of Overspend Project Budget, Data Breach 2021, Key Risks using the slides given. This template can be altered and personalized to fit your needs. It is also available for immediate download. So grab it now.
-
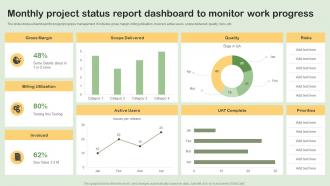 Monthly Project Status Report Dashboard To Monitor Work Progress
The slide shows a dashboard for project progress management. It includes gross margin, billing utilization, invoiced, active users, scope delivered, quality, risks, etc. Presenting our well-structured Monthly Project Status Report Dashboard To Monitor Work Progress. The topics discussed in this slide are Scope Delivered, Gross Margin, Quality, Risks. This is an instantly available PowerPoint presentation that can be edited conveniently. Download it right away and captivate your audience.
-
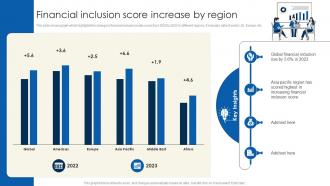 Financial Inclusion Score Financial Inclusion To Promote Economic Fin SS
This slide shows graph which highlights the change in financial inclusion index score from 2022 to 2023 in different regions. It includes data of world, US, Europe, etc. Deliver an outstanding presentation on the topic using this Financial Inclusion Score Financial Inclusion To Promote Economic Fin SS. Dispense information and present a thorough explanation of Global Financial Inclusion, Financial Inclusion Score, Key Insights using the slides given. This template can be altered and personalized to fit your needs. It is also available for immediate download. So grab it now.
-
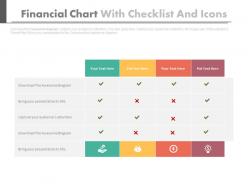 Financial chart with checklist and icons powerpoint slides
Well crafted and professionally equipped PowerPoint visual. Use of bright and bold colors for maximum visual appeal. Ease of editing every component of the PPT template. Guidance for executing the changes has been provided for assistance. Modify and personalize the presentation by including the company name and logo. Compatible with varied number of format options. Compatible with multiple software options available both online and offline. Widely used by entrepreneurs, business strategists, business analysts, stakeholders, students and teachers.
-
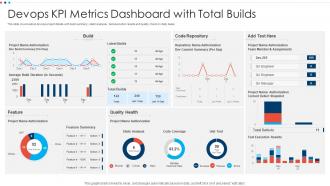 Devops KPI Metrics Dashboard With Total Builds
This slide covers about devops project details with build summary, static analysis , test execution results and quality check on daily basis. Introducing our Devops KPI Metrics Dashboard With Total Builds set of slides. The topics discussed in these slides are Devops KPI Metrics Dashboard with Total Builds. This is an immediately available PowerPoint presentation that can be conveniently customized. Download it and convince your audience.
-
 Contact center software market industry overview ppt guidelines
This slide shows some of the global market trends of Contact Center Software Market Industry worldwide. The slide shows the global Contact Center Software Market growth rate CAGR, fastest growing market and largest market, trends that drive market growth, major industry players etc. Present the topic in a bit more detail with this Contact Center Software Market Industry Overview Ppt Guidelines. Use it as a tool for discussion and navigation on Contact Center Software Market Industry Overview. This template is free to edit as deemed fit for your organization. Therefore download it now.
-
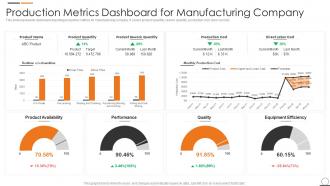 Production Metrics Dashboard For Manufacturing Company
This slide represents dashboard depicting production metrics for manufacturing company. It covers product quantity, rework quantity, production cost, labor cost etc. Introducing our Production Metrics Dashboard For Manufacturing Company set of slides. The topics discussed in these slides are Dashboard, Manufacturing, Production. This is an immediately available PowerPoint presentation that can be conveniently customized. Download it and convince your audience.
-
 Financial Proposal Powerpoint Presentation Slides
Presenting budget proposal presentation slides. This professionally designed deck consists of total of 69 PPT slides. This deck has been designed after an extensive research done by the experts. Our PowerPoint experts have crafted this deck by adding all the necessary design elements. You will find visuals according to the content. This ready-to-use deck has professional visuals, layouts, diagrams, icons, charts, graphs, and more. These templates are completely editable. Edit the color, text, icon, and font size as per your need. Click the download button now.
-
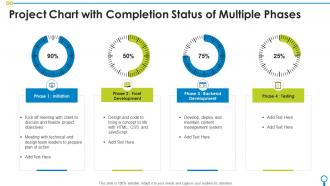 Project Chart With Completion Status Of Multiple Phases
Introducing our Project Chart With Completion Status Of Multiple Phases set of slides. The topics discussed in these slides are Project Chart With Completion Status Of Multiple Phases. This is an immediately available PowerPoint presentation that can be conveniently customized. Download it and convince your audience.
-
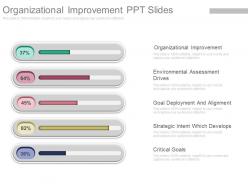 View organizational improvement ppt slides
High quality of images and icons. Strikingly beautiful Presentation slide. Easily amendable PowerPoint design as can be edited smoothly. Access to demonstrate the PPT template in widescreen view. Adaptable designs as compatible with Google slides. Downloading is easy and can be altered into JPEG and PDF. Suitable for business presenters, management and the entrepreneurs.The stages in this process are organizational improvement, environmental assessment drives and much more.
-
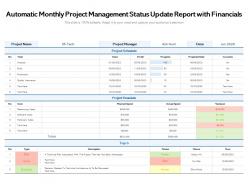 Automatic monthly project management status update report with financials
Presenting this set of slides with name Automatic Monthly Project Management Status Update Report With Financials. The topics discussed in these slides are Task, Start, Finish, Progress, Projected Date, Concerns, Item, Planned Spend, Actual Spend, Variance, Type, Description, Status, Owner, Due. This is a completely editable PowerPoint presentation and is available for immediate download. Download now and impress your audience.
-
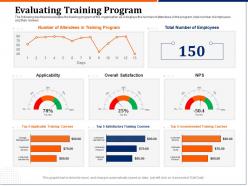 Evaluating training program satisfaction ppt powerpoint design inspiration
The following dashboard evaluates the training program of the organization as it displays the number of attendees in the program total number of employees and their reviews. Presenting this set of slides with name Evaluating Training Program Satisfaction Ppt Powerpoint Design Inspiration. The topics discussed in these slides are Evaluating Training Program. This is a completely editable PowerPoint presentation and is available for immediate download. Download now and impress your audience.
-
 Financial technology bear bull dollar icon image
Presenting this set of slides with name - Financial Technology Bear Bull Dollar Icon Image. This is a fifteen stage process. The stages in this process are Financial Technology, Fintech, Financial Services.
-
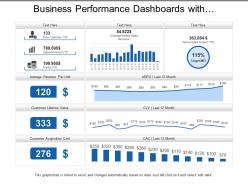 Business performance dashboards with average revenue and customer lifetime value
Presenting, our business performance dashboards with average revenue and customer lifetime value PPT template. You can download this engaging PPT template and take a report of the full version of this PPT deck which includes editing the text, adjusting the colors according to your liking, watermark gets expelled, include your company's logo and get slides in widescreen version.
-
 Cybersecurity Risk Management Framework Information Security Risk Management Dashboard
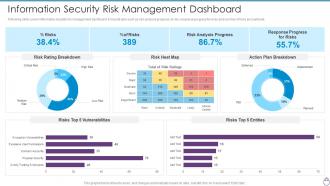
Following slide covers information security risk management dashboard. It include kpis such as risk analysis progress, percent risk, response progress for risks and number of risks encountered. Deliver an outstanding presentation on the topic using this Cybersecurity Risk Management Framework Information Security Risk Management Dashboard. Dispense information and present a thorough explanation of Risk Rating Breakdown, Risk Heat Map, Action Plan Breakdown, Risks Top 5 Vulnerabilities, Risks Top 5 Entities using the slides given. This template can be altered and personalized to fit your needs. It is also available for immediate download. So grab it now.
-
 Monthly social media dashboard snapshot ppt design
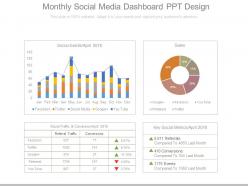
Presenting monthly social media dashboard snapshot ppt design. This is a monthly social media dashboard ppt design. This is a four stage process. The stages in this process are social events, sales, social traffic and conversion, key social metrics, referrals, conversions, events.
-
 Financial management in healthcare powerpoint presentation slides
Presenting this set of slides with name - Financial Management In Healthcare Powerpoint Presentation Slides. This PPT deck displays forty slides with in-depth research. Our topic oriented Financial Management In Healthcare Powerpoint Presentation Slides presentation deck is a helpful tool to plan, prepare, document and analyze the topic with a clear approach. It showcases all kind of editable templates infographs for an inclusive and comprehensive Financial Management In Healthcare Powerpoint Presentation Slides presentation. Download PowerPoint templates in both widescreen and standard screen. The presentation is fully supported by Google Slides. It can be easily converted into JPG or PDF format.
-
 Cyber Security Key Metrics Monitoring Dashboard
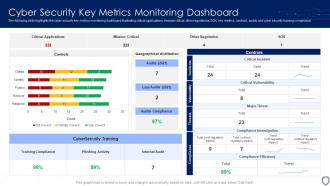
The following slide highlights the cyber security key metrics monitoring dashboard illustrating critical applications, mission critical, other regulations, SOX, key metrics, controls, audits and cyber security training compliance. Introducing our Cyber Security Key Metrics Monitoring Dashboard set of slides. The topics discussed in these slides are Training Compliance, Phishing Activity, Internal Audit. This is an immediately available PowerPoint presentation that can be conveniently customized. Download it and convince your audience.
-
 Compliance and legal kpi dashboard showing regulatory compliance
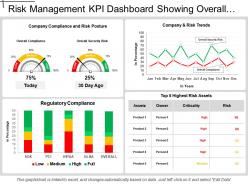
Presenting this set of slides with name - Compliance And Legal Kpi Dashboard Showing Regulatory Compliance. This is a four stage process. The stages in this process are Compliance And Legal, Legal Governance, Risk Management.
-
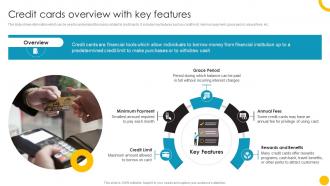 Credit Cards Overview Guide To Use And Manage Credit Cards Effectively Fin SS
This slide shows information which can be used to understand the basics related to credit cards. It includes key features such as credit limit, minimum payment, grace period, annual fees, etc. Increase audience engagement and knowledge by dispensing information using Credit Cards Overview Guide To Use And Manage Credit Cards Effectively Fin SS. This template helps you present information on five stages. You can also present information on Overview, Grace Period, Rewards And Benefits using this PPT design. This layout is completely editable so personaize it now to meet your audiences expectations.
-
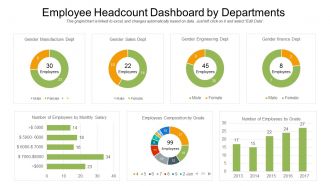 Employee headcount dashboard by departments
Presenting this set of slides with name Employee Headcount Dashboard By Departments. The topics discussed in these slides are Employee, Headcount, Dashboard, Departments. This is a completely editable PowerPoint presentation and is available for immediate download. Download now and impress your audience.
-
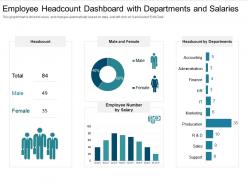 Employee headcount dashboard with departments and salaries
Presenting this set of slides with name Employee Headcount Dashboard With Departments And Salaries. The topics discussed in these slides are Employee, Headcount, Dashboard, Departments, Salaries. This is a completely editable PowerPoint presentation and is available for immediate download. Download now and impress your audience.
-
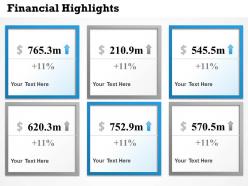 0414 6 staged financial highlight diagram
We are proud to present our 0414 6 staged financial highlight diagram. Deadlines are an element of todays workplace. Our 6 staged financial highlight diagram Powerpoint Templates help you meet the demand. Just browse and pick the slides that appeal to your intuitive senses. Our 6 staged financial highlight diagram Powerpoint Templates will help you be quick off the draw. Just enter your specific text and see your points hit home.
-
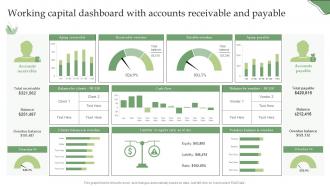 Working Capital Dashboard With Accounts Receivable And Payable
Presenting our well-structured Working Capital Dashboard With Accounts Receivable And Payable. The topics discussed in this slide are Aging Receivable, Receivable Overdue, Payable Overdue, Aging Payable. This is an instantly available PowerPoint presentation that can be edited conveniently. Download it right away and captivate your audience.
-
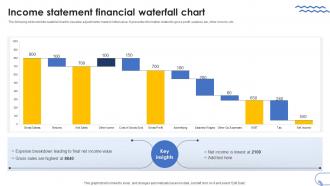 Income Statement Financial Waterfall Chart
The following slide exhibits waterfall chart to visualize adjustments made to initial value. It presents information related to gross profit, salaries, tax, other income, etc. Introducing our Income Statement Financial Waterfall Chart set of slides. The topics discussed in these slides are Income Statement, Financial Waterfall Char. This is an immediately available PowerPoint presentation that can be conveniently customized. Download it and convince your audience.
-
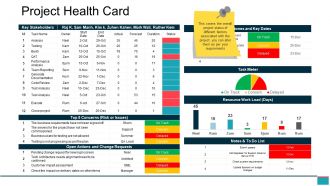 Project health card ppt example file
Presenting this set of slides with name - Project Health Card Ppt Example File. This is a seven stage process. The stages in this process are Open Actions And Change Requests, Notes And To Do List, Milestones And Key Dates, Key Stakeholders.
-
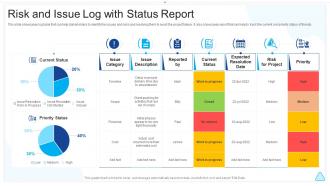 Risk And Issue Log With Status Report
This slide showcases log table that can help stakeholders to identify the issues and risks and resolving them to avoid the project failure. It also showcases report that can help to track the current and priority status of threats Presenting our well structured Risk And Issue Log With Status Report. The topics discussed in this slide are Risk And Issue Log With Status Report. This is an instantly available PowerPoint presentation that can be edited conveniently. Download it right away and captivate your audience.
-
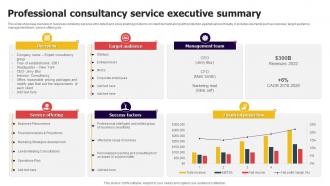 Professional Consultancy Service Executive Summary
This slide showcase overview of business constancy services who detect and solve existing problems on client demand along with protection against various threats. It includes elements such as overview, target audience, management team, service offering etc. Presenting our well structured Professional Consultancy Service Executive Summary. The topics discussed in this slide are Overview, Target Audience, Success Factors. This is an instantly available PowerPoint presentation that can be edited conveniently. Download it right away and captivate your audience.
-
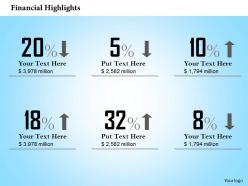 0414 financial result analysis diagram
Proofing and editing can be done with ease in PPT design. Smooth functioning is ensured by the presentation slide show on all software’s. Color, style and position can be standardized, supports font size which can be read from a distance. When projected on the wide screen the PPT layout does not sacrifice on pixels or color resolution. Can be used by the technical support department, teachers, businessmen, managers and other professionals to have a setup a sequence of events.
-
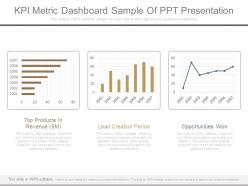 Kpi metric dashboard sample of ppt presentation
Presenting kpi metric dashboard sample of ppt presentation. This is a kpi metric dashboard sample of ppt presentation. This is a three stage process. The stages in this process are top products in revenue, lead creation period, opportunities won.
-
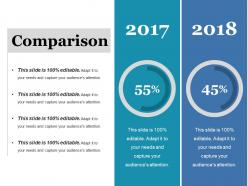 Comparison ppt file themes
Presenting this set of slides with name - Comparison Ppt File Themes. This is a two stage process. The stages in this process are Finance, Business, Year, Comparison, Donut.
-
 Project health card ppt samples download
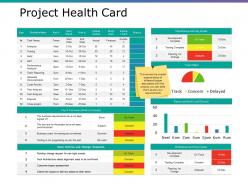
Presenting this set of slides with name - Project Health Card Ppt Samples Download. This is a seven stage process. The stages in this process are Business, Open Actions And Change Requests, Milestones And Key Dates, Marketing.
-
 Data comparison chart powerpoint slide
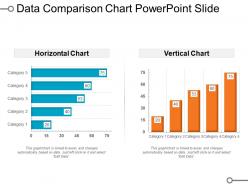
Presenting data comparison chart PowerPoint slide presentation template. You can download this slide and then save into another format such as JPG and PDF and can also display in standard and widescreen view. A user can alter this slide such as color, text, font type, font size and aspect ratio. This slide gets synced with Google Slides, Excel sheet and edit in PowerPoint. You may share this template with large segment because it has great pixel quality. You can insert the relevant content in text placeholder of this slide.
-
 Quality control kpi dashboard showing test case status
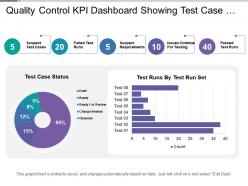
Presenting this set of slides with name - Quality Control Kpi Dashboard Showing Test Case Status. This is a two stage process. The stages in this process are Quality Management, Quality Control, Quality Assurance.
-
 Audit kpi dashboard showing overall assurance internal audit and results
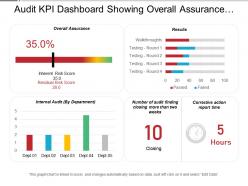
Presenting audit kpi dashboard showing overall assurance internal audit and results presentation slide. The PPT layout is extremely easy to understand as it enables you to roll out various improvements to the editable slides. You can change the text dimension, textual style and furthermore the textual style shading according to your prerequisites. Layout slide can be downloaded rapidly and taxi be spared in configuration of PDF or JPG effectively. The format slide in the wake of being downloaded can be seen in extensive screen show proportion of 16:9 or standard size presentation proportion of 4:3.
-
 Revenue chart for financial value segmentation powerpoint slides
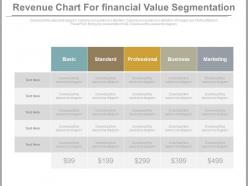
Presenting revenue chart for financial value segmentation powerpoint slides. This Power Point template slide has been crafted with graphic of revenue chart. This PPT slide contains the concept of financial value segmentation. Use this PPT slide for business and finance related presentations.
-
 KPI Dashboard To Measure Effective IT Service Excellence
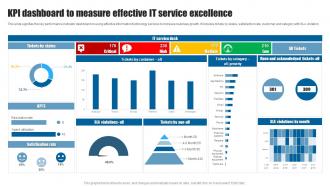
This slide signifies the key performance indicator dashboard on using effective information technology services to increase business growth. It includes tickets by status, satisfaction rate, customer and category with SLA violation. Introducing our KPI Dashboard To Measure Effective IT Service Excellence set of slides. The topics discussed in these slides are Tickets By Status, Satisfication Rate, Violations By Month. This is an immediately available PowerPoint presentation that can be conveniently customized. Download it and convince your audience.


