Financial Services Advisor PowerPoint Templates, Presentation Images & PPT Templates
- Sub Categories
-
- 30 60 90 Day Plan
- About Us Company Details
- Action Plan
- Agenda
- Annual Report
- Audit Reports
- Balance Scorecard
- Brand Equity
- Business Case Study
- Business Communication Skills
- Business Plan Development
- Business Problem Solving
- Business Review
- Capital Budgeting
- Career Planning
- Change Management
- Color Palettes
- Communication Process
- Company Location
- Company Vision
- Compare
- Competitive Analysis
- Corporate Governance
- Cost Reduction Strategies
- Custom Business Slides
- Customer Service
- Dashboard
- Data Management
- Decision Making
- Digital Marketing Strategy
- Digital Transformation
- Disaster Management
- Diversity
- Equity Investment
- Financial Analysis
- Financial Services
- Financials
- Growth Hacking Strategy
- Human Resource Management
- Innovation Management
- Interview Process
- Knowledge Management
- Leadership
- Lean Manufacturing
- Legal Law Order
- Management
- Market Segmentation
- Marketing
- Media and Communication
- Meeting Planner
- Mergers and Acquisitions
- Metaverse
- Newspapers
- Operations and Logistics
- Organizational Structure
- Our Goals
- Performance Management
- Pitch Decks
- Pricing Strategies
- Process Management
- Product Development
- Product Launch Ideas
- Product Portfolio
- Project Management
- Purchasing Process
- Quality Assurance
- Quotes and Testimonials
- Real Estate
- Risk Management
- Sales Performance Plan
- Sales Review
- SEO
- Service Offering
- Six Sigma
- Social Media and Network
- Software Development
- Solution Architecture
- Stock Portfolio
- Strategic Management
- Strategic Planning
- Supply Chain Management
- Swimlanes
- System Architecture
- Team Introduction
- Testing and Validation
- Thanks-FAQ
- Time Management
- Timelines Roadmaps
- Value Chain Analysis
- Value Stream Mapping
- Workplace Ethic
-
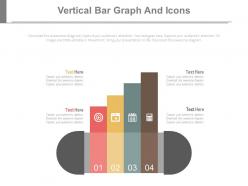 Four staged vertical bar graph and icons powerpoint slides
Presenting four staged vertical bar graph and icons powerpoint slides. This Power Point template diagram slide has been crafted with graphic of four staged vertical bar graph and icons diagram. This PPT diagram contains the concept of financial analysis. Use this PPT diagram for business and marketing related presentations.
-
 As is to be budgeting powerpoint presentation slides
This complete deck focuses on As Is To Be Budgeting Powerpoint Presentation Slides and has professionally designed templates with suitable visuals and appropriate content. This deck consists of a total of twenty slides. All the slides are completely customizable for your convenience. You can change the color, text and font size of these templates. You can add or delete the content if needed. The templates are compatible with Google Slides so it can be easily accessible. It can be saved into various file formats like PDF, JPG. And PNG. It is available in both standard and widescreen formats.
-
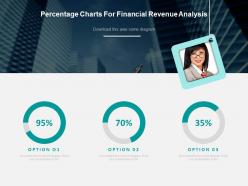 Percentage charts for financial revenue analysis powerpoint slides
Presenting percentage charts for financial revenue analysis powerpoint slides. This is a percentage charts for financial revenue analysis powerpoint slides. This is a three stage process. The stages in this process are financials.
-
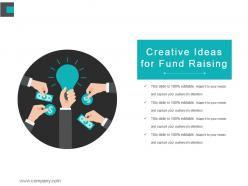 Creative ideas for fund raising powerpoint show
Presenting creative ideas for fund raising powerpoint show. This is a creative ideas for fund raising powerpoint show. This is a five stage process. The stages in this process are creative ideas for fund raising.
-
 Wealth management icon presentation background images
Presenting this set of slides with name - Wealth Management Icon Presentation Background Images. This is a four stage process. The stages in this process are Wealth Management, Financial Management, Investment Management.
-
 Project Cost Control Techniques Icon
Introducing our premium set of slides with Project Cost Control Techniques Icon. Ellicudate the three stages and present information using this PPT slide. This is a completely adaptable PowerPoint template design that can be used to interpret topics like Project Cost Control Techniques Icon. So download instantly and tailor it with your information.
-
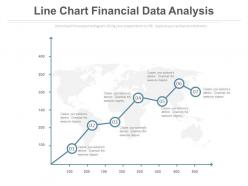 Line chart for finance data analysis powerpoint slides
Perfect PPT slide for marketing and sales people, business analysts, market researchers. Completely editable content including fonts, text, colors, etc. Useful illustration of numerical figures using editable excel linked chart. Compatible with number of software options. Personalize the presentation with individual company name and logo. Excellence in picture quality even on wide screen output. Easy and quick downloading process. Flexible option for conversion in PDF or JPG formats. Compatible with Google slides.
-
 Profit Icon Innovation Bulb Icon Financial Growing Business Gear Manufacturing Currency
It covers all the important concepts and has relevant templates which cater to your business needs. This complete deck has PPT slides on Profit Icon Innovation Bulb Icon Financial Growing Business Gear Manufacturing Currency with well suited graphics and subject driven content. This deck consists of total of thirteen slides. All templates are completely editable for your convenience. You can change the colour, text and font size of these slides. You can add or delete the content as per your requirement. Get access to this professionally designed complete deck presentation by clicking the download button below.
-
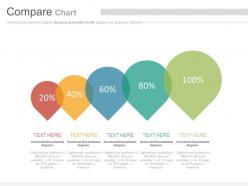 Linear sequential compare chart with percentage powerpoint slides
Presenting linear sequential compare chart with percentage powerpoint slides. This Power Point template diagram slide has been crafted with graphic of linear sequential chart and percentage diagram. This PPT diagram contains the concept of data comparison analysis representation. Use this PPT diagram for business and finance related presentations.
-
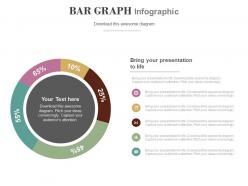 Circle bar graph with percentage analysis powerpoint slides
Presenting circle bar graph with percentage analysis powerpoint slides. This Power Point template slide has been crafted with graphic of circle bar graph and percentage icons. This PPT slide contains the concept of financial analysis. Use this PPT slide for business and marketing related presentations.
-
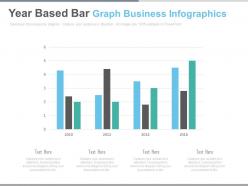 Year based bar graph business infographics powerpoint slides
Presenting year based bar graph business infographics powerpoint slides. This Power Point template diagram with graphic of year based bar graph diagram. This PPT diagram contains the concept of data analysis. Use this PPT diagram for business and finance related presentations.
-
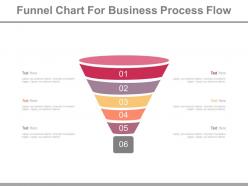 Six staged funnel chart for business process flow powerpoint slides
Presenting six staged funnel chart for business process flow powerpoint slides. This Power Point template diagram has been crafted with graphic of six staged funnel chart diagram. This PPT diagram contains the concept of business process flow representation. Use this PPT diagram for business and finance related presentations.
-
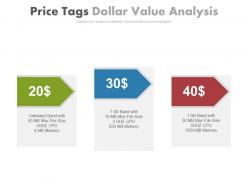 Three price tags dollar value analysis powerpoint slides
Presenting three price tags dollar value analysis powerpoint slides. This is a three price tags dollar value analysis powerpoint slides. This is a three stage process. The stages in this process are financials.
-
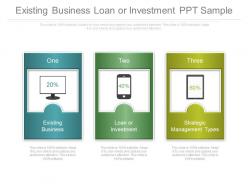 Existing business loan or investment ppt sample
Presenting existing business loan or investment ppt sample. This is a existing business loan or investment ppt sample. This is a three stage process. The stages in this process are business, finance, strategy.
-
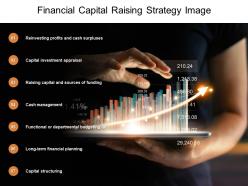 Financial capital raising strategy image
Presenting this set of slides with name Financial Capital Raising Strategy Image. This is a seven stage process. The stages in this process are Financial Strategy, Business Strategy, Cash Management. This is a completely editable PowerPoint presentation and is available for immediate download. Download now and impress your audience.
-
 Financial strategy with chess board image
Presenting this set of slides with name Financial Strategy With Chess Board Image. This is a seven stage process. The stages in this process are Financial Strategy, Business Strategy, Cash Management. This is a completely editable PowerPoint presentation and is available for immediate download. Download now and impress your audience.
-
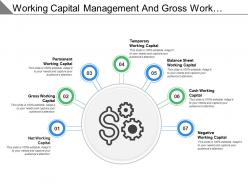 Working capital management and gross working capital
Presenting this set of slides with name - Working Capital Management And Gross Working Capital. This is a seven stage process. The stages in this process are Working Capital Management, Financial Capital, Companys Managerial Accounting.
-
 Financial markets analysis showing financial statistics
Presenting this set of slides with name - Financial Markets Analysis Showing Financial Statistics. This is a four stage process. The stages in this process are Bull Market, Financial Markets, Stock Market.
-
 Cost reduction budget strategy icon
Presenting our set of slides with Cost Reduction Budget Strategy Icon. This exhibits information on three stages of the process. This is an easy to edit and innovatively designed PowerPoint template. So download immediately and highlight information on Cost Reduction Budget Strategy Icon.
-
 Blackboard with text boxes for financial analysis powerpoint slides
Presenting blackboard with text boxes for financial analysis powerpoint slides. This Power Point template diagram slide has been crafted with graphic of black board and text boxes. This PPT diagram contains the concept of financial analysis. Use this PPT diagram for business and finance related presentations.
-
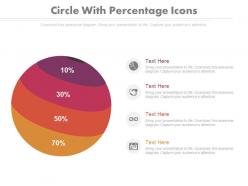 Four staged circle with percentage icons powerpoint slides
Presenting four staged circle with percentage icons powerpoint slides. This Power Point template diagram slide has been crafted with graphic of four staged circle and percentage icons. This PPT diagram slide contains the concept of financial analysis representation. Use this PPT slide for finance and business related presentations.
-
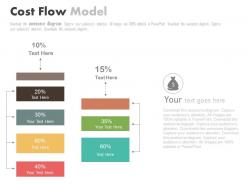 Seven staged cost flow model powerpoint slides
Presenting seven staged cost flow model powerpoint slides. This Power Point template slide has been crafted with graphic of seven staged cost flow model. This PPT slide contains the concept of financial analysis. Use this PPT slide for business and finance related presentations.
-
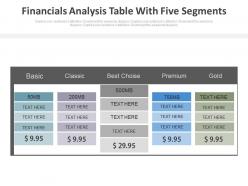 Financial analysis table with five segments powerpoint slides
Presenting financial analysis table with five segments powerpoint slides. This Power Point template diagram with graphic of finance table with five segments. This PPT diagram contains the concept of financial analysis. Use this PPT diagram for business and finance related presentations.
-
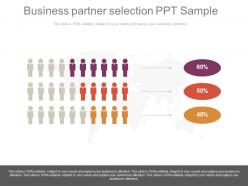 Business partner selection ppt sample
Presenting business partner selection ppt sample. This is a business partner selection ppt sample. This is a three stage process. The stages in this process are business, finance, teamwork, management, success.
-
 Insurance claim process approach document verification approved rejected
Presenting this set of slides with name - Insurance Claim Process Approach Document Verification Approved Rejected. This is a seven stage process. The stages in this process are Insurance Claim Process, Insurance Claim Steps, Insurance Claim Procedure.
-
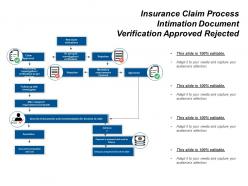 Insurance claim process intimation document verification approved rejected
Presenting this set of slides with name - Insurance Claim Process Intimation Document Verification Approved Rejected. This is a four stage process. The stages in this process are Insurance Claim Process, Insurance Claim Steps, Insurance Claim Procedure.
-
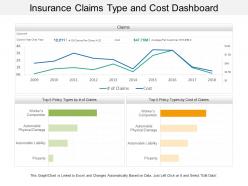 Insurance claims type and cost dashboard
• Stunning match of topic and visuals. • Professional proficiency and brilliant craftsmanship. • Ease of personalization. • Ease of customization with desired contents. • Special assistance to execute the changes has been provided. • Compatibility with multiple numbers of formats. • Compatibility with numerous software options available both online and offline. • High resolution • Used by marketing and business professionals, students and teachers.
-
 Financial services lead management system
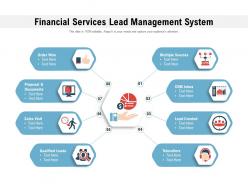
Presenting this set of slides with name Financial Services Lead Management System. This is a eight stage process. The stages in this process are Order Won, Proposal And Documents, Sales Visit, Qualified Leads, Telecallers, Lead Created, CRM Inbox, Multiple Sources. This is a completely editable PowerPoint presentation and is available for immediate download. Download now and impress your audience.
-
 Business plan timeline for planning analysis powerpoint slides
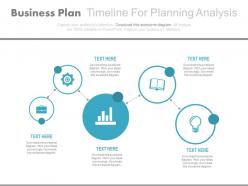
Presenting business plan timeline for planning analysis powerpoint slides. This Power Point template diagram has been crafted with graphic of business plan timeline diagram. This PPT diagram contains the concept of business planning analysis and timeline formation. Use this PPT diagram for business and finance related presentations.
-
 Five staged annual report for business powerpoint slides
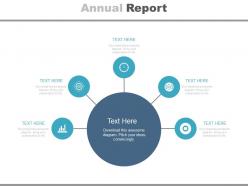
Presenting five staged annual report for business powerpoint slides. This Power Point template diagram has been crafted with graphic of five staged annual report diagram. This PPT diagram contains the concept of annual report analysis. Use this PPT diagram for business and finance related presentations.
-
 Pie chart with percentage analysis and icons powerpoint slides
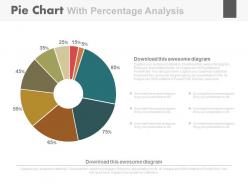
Presenting pie chart with percentage analysis and icons powerpoint slides. This Power Point template diagram has been crafted with graphic of pie chart and percentage diagram. This PPT diagram contains the concept of percentage analysis representation. Use this PPT diagram for business and finance related presentations.
-
 Business development video marketing plan ppt slide
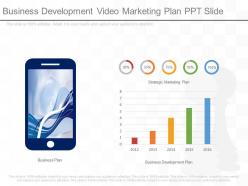
PPT slide supports resize, recolor and reverse the images. Good quality images can be used to compliment and reinforce message. Works well in Windows 7, 8, 10, XP, Vista and Citrix. Editing in presentation slide show can be done from anywhere by any device. Elegant and beautiful presentation which can be oriented and customized according to requirement.The stages in this process are marketing, communication, technology, finance, internet.
-
 Social network benefit business ppt presentation
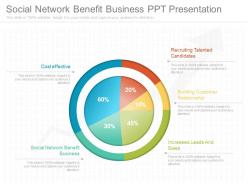
Presenting social network benefit business ppt presentation. This is a social network benefit business ppt presentation. This is a five stage process. The stages in this process are process, strategy, finance, marketing.
-
 Revenue drivers business plan example ppt presentation
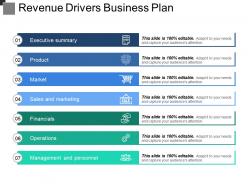
Presenting, revenue drivers business plan example ppt presentation. Displaying relevant content with adjustable data and can be quickly changed to pdf and jpg format. Producing high-resolution PPT slides and interesting figures to illustrate the concepts. Edible background with color, layout, font, and text which can be personalized to incorporate your business data. This revenue drivers layout is available in both standard 4:3 and widescreen format 16:9 after downloading. Include your company logo and edit the illustrations to meet your requirements. Pre Designed format easy to comprehend and can be projected on widescreens formats for business meetings. Compatible with Google Slides.
-
 Bank icon image with piggy bank and circular arrows
Presenting this set of slides with name - Bank Icon Image With Piggy Bank And Circular Arrows. This is a four stage process. The stages in this process are Bank Icon, Finance Icons, Money Icon.
-
 Bank icon white example of ppt presentation
Presenting this set of slides with name - Bank Icon White Example Of Ppt Presentation. This is a one stage process. The stages in this process are Bank Icon, Finance Icons, Money Icon.
-
 Investing concept of risk and return powerpoint presentation slides
Presenting this set of slides with name - Investing Concept Of Risk And Return Powerpoint Presentation Slides. This aptly crafted editable PPT deck contains thirty one slides. Our topic specific Investing Concept Of Risk And Return Powerpoint Presentation Slides presentation deck helps devise the topic with a clear approach. We offer a wide range of custom made slides with all sorts of relevant charts and graphs, overviews, topics subtopics templates, and analysis templates. Speculate, discuss, design or demonstrate all the underlying aspects with zero difficulty. This deck also consists creative and professional looking slides of all sorts to achieve the target of a presentation effectively. You can present it individually or as a team working in any company organization.
-
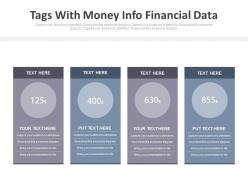 Four tags with money info financial data powerpoint slides
Presenting four tags with money info financial data powerpoint slides. This is a four tags with money info financial data powerpoint slides. This is a four stage process. The stages in this process are financials.
-
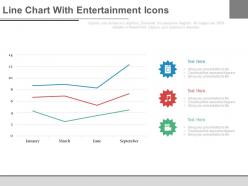 Line chart with entertainment icons month based analysis powerpoint slides
Presenting line chart with entertainment icons month based analysis powerpoint slides. This is a line chart with entertainment icons month based analysis powerpoint slides. This is a three stage process. The stages in this process are financials.
-
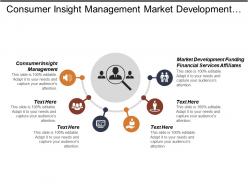 Consumer insight management market development funding financial services affiliates cpb
Presenting this set of slides with name - Consumer Insight Management Market Development Funding Financial Services Affiliates Cpb. This is an editable six stages graphic that deals with topics like Consumer Insight Management, Market Development Funding Financial Services Affiliates to help convey your message better graphically. This product is a premium product available for immediate download, and is 100 percent editable in Powerpoint. Download this now and use it in your presentations to impress your audience.
-
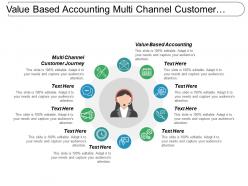 Value based accounting multi channel customer journey financial services cpb
Presenting this set of slides with name - Value Based Accounting Multi Channel Customer Journey Financial Services Cpb. This is an editable ten stages graphic that deals with topics like Value Based Accounting, Multi Channel Customer Journey, Financial Services to help convey your message better graphically. This product is a premium product available for immediate download, and is 100 percent editable in Powerpoint. Download this now and use it in your presentations to impress your audience.
-
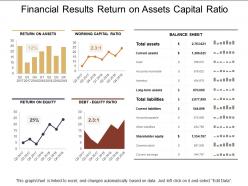 Financial results return on assets capital ratio
Sharing financial results return on assets capital ratio presentation slide. PowerPoint design can be downloaded and save into JPG and PDF format. PPT template can be downloaded in standard and widescreen view. Fully compliant slide design with Google slides. Easy to edit as color, text and font can be amended. Perfect to share business communication as pixels don’t break even when shared on large screen. Presentation graphic can be accessed with different nodes and stages.
-
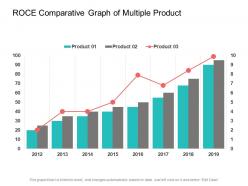 Roce comparative graph of multiple product
Presenting this set of slides with name - Roce Comparative Graph Of Multiple Product. This is a three stages process. The stages in this process are ROCE, Return On Capital Employed, Accounting Ratio.
-
 Risk And Return In Financial Management Powerpoint Presentation Slides
Presenting this set of slides with name - Risk And Return In Financial Management Powerpoint Presentation Slides. This aptly crafted editable PPT deck contains twenty-eight slides. We offer a wide range of custom made slides with all sorts of relevant charts and graphs, overviews, topics subtopics templates, and analysis templates. This deck also consists of creative and professional-looking slides. When you download this deck by clicking the download button below, you get the presentation in both standard and widescreen format. The presentation is fully supported with Google Slides. It can be easily converted into JPG or PDF format.
-
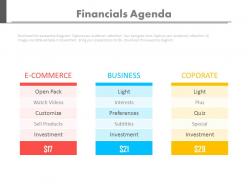 Three tags for ecommerce business and financial agendas powerpoint slides
Presenting three tags for ecommerce business and financial agendas powerpoint slides. This Power Point template diagram slide has been crafted with graphic of three tags diagram. This PPT diagram slide contains the concept of business and financial agenda representation. Use this PPT slide for finance and business related presentations.
-
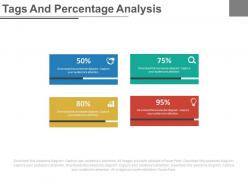 Four colored tags and percentage analysis powerpoint slides
Presenting four colored tags and percentage analysis powerpoint slides. This Power Point template slide has been crafted with graphic of four colored tags and percentage icons. This PPT slide contains the concept of financial data analysis representation. Use this PPT slide for business and finance related presentations.
-
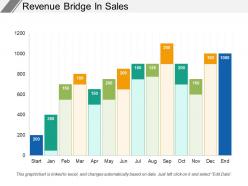 Revenue bridge in sales
Presenting this set of slides with name - Revenue Bridge In Sales. This is a fourteen stage process. The stages in this process are Revenue Bridge, Income Bridge, Earnings Bridge.
-
 Proactive Investing Strategies AI Image PowerPoint Presentation PPT ECS
Introducing a Visual PPT on Proactive Investing Strategies. Every slide in this PowerPoint is meticulously designed by our Presentation Experts. Modify the content as you see fit. Moreover, the PowerPoint Template is suitable for screens and monitors of all dimensions, and even works seamlessly with Google Slides. Download the PPT, make necessary changes, and present with confidence.
-
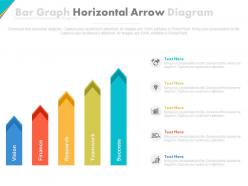 Five staged bar graph horizontal arrow diagram powerpoint slides
Presenting five staged bar graph horizontal arrow diagram powerpoint slides. This Power Point template diagram slide has been crafted with graphic of five staged bar graph and arrow diagram. This PPT diagram contains the concept of business data analysis representation. Use this PPT diagram for business and data related presentations.
-
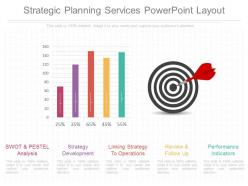 Strategic planning services powerpoint layout
Presenting strategic planning services powerpoint layout. This is a strategic planning services powerpoint layout. This is a five stage process. The stages in this process are swot and pastel analysis, strategy development, linking strategy to operations, review and follow up, performance indicators.
-
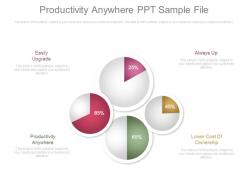 Productivity anywhere ppt sample file
Presenting productivity anywhere ppt sample file. This is a productivity anywhere ppt sample file. This is a four stage process. The stages in this process are easily upgrade, always up, productivity anywhere, lower cost of ownership.
-
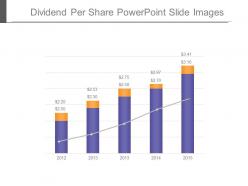 Dividend per share powerpoint slide images
Presenting dividend per share powerpoint slide images. This is a dividend per share powerpoint slide images. This is a five stage process. The stages in this process are business, graph chart, growth, strategy, finance.
-
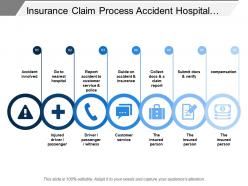 Insurance claim process accident hospital customer service document
Presenting this set of slides with name - Insurance Claim Process Accident Hospital Customer Service Document. This is a seven stage process. The stages in this process are Insurance Claim Process, Insurance Claim Steps, Insurance Claim Procedure.
-
 Financial management policies procedures standardized efficiency control
Presenting this set of slides with name - Financial Management Policies Procedures Standardized Efficiency Control. This is a six stage process. The stages in this process are Financial State, Financial Management, Economy.
-
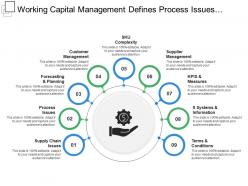 Working capital management defines process issues terms and conditions
Presenting this set of slides with name - Working Capital Management Defines Process Issues Terms And Conditions. This is a nine stage process. The stages in this process are Working Capital Management, Financial Capital, Companys Managerial Accounting.
-
 Budget forecast showing the number of coins with calculator
Presenting this set of slides with name - Budget Forecast Showing The Number Of Coins With Calculator. This is a four stage process. The stages in this process are Budget Forecast, Forecast Vs Actual Budget, Plan Vs Forecast.
-
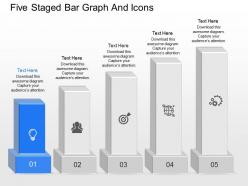 Is five staged bar graph and icons powerpoint template
Presenting is five staged bar graph and icons powerpoint template. Graphic of five staged bar graph and icons has been used to craft this power point template diagram. This PPT diagram contains concept of business result analysis representation. Use this PPT diagram for business and marketing related presentations.
-
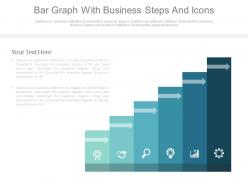 Bar graph with business steps and icons powerpoint slides
Presenting bar graph with business steps and icons powerpoint slides. This is a bar graph with business steps and icons powerpoint slides. This is a three stage process. The stages in this process are financials.
-
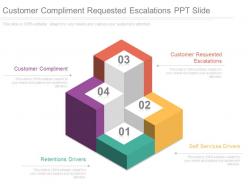 Customer compliment requested escalations ppt slide
Presenting customer compliment requested escalations ppt slide. This is a customer compliment requested escalations ppt slide. This is a four stage process. The stages in this process are strategy, leadership, winners.
-
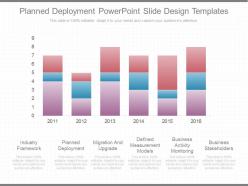 Download planned deployment powerpoint slide design templates
Presenting download planned deployment powerpoint slide design templates. This is a planned deployment powerpoint slide design templates. This is a six stage process. The stages in this process are industry framework, planned deployment, migration and upgrade, defined measurement models, business activity monitoring, business stakeholders.


