Financial Statements Ratio Analysis Interpretation Powerpoint Presentation Slides
Perform a qualitative analysis of your business efficiency, liquidity and profitability with our financial statements ratio analysis interpretation PowerPoint presentation slides. This financial statement ratio analysis PPT has been designed by our team of professional designers to showcase financial statements of companies which involves economic health of business and historical monetary statement. These presentation slides will allow you to measure if your company will pay off debts in near future and check if through its earnings the business will be able to run operations smoothly in long run. This PPT theme of fiscal statement will help you evaluate how your company will manage its assets and liabilities to maximize profits. This Financial Statements Ratio Analysis Interpretation presentation deck will help you measure your ratio analysis types such as solvency ratio, operating performance, risk analysis and growth analysis. This PPT template will provide you useful facts and figures to measure different metrics of the industry and by using these analysis reports you can easily measure competitive positioning and financial stability of an organization. Have great fun with our Financial Statements Ratio Analysis Interpretation Powerpoint Presentation Slides. Every event becomes enjoyable.
- Google Slides is a new FREE Presentation software from Google.
- All our content is 100% compatible with Google Slides.
- Just download our designs, and upload them to Google Slides and they will work automatically.
- Amaze your audience with SlideTeam and Google Slides.
-
Want Changes to This PPT Slide? Check out our Presentation Design Services
- WideScreen Aspect ratio is becoming a very popular format. When you download this product, the downloaded ZIP will contain this product in both standard and widescreen format.
-

- Some older products that we have may only be in standard format, but they can easily be converted to widescreen.
- To do this, please open the SlideTeam product in Powerpoint, and go to
- Design ( On the top bar) -> Page Setup -> and select "On-screen Show (16:9)” in the drop down for "Slides Sized for".
- The slide or theme will change to widescreen, and all graphics will adjust automatically. You can similarly convert our content to any other desired screen aspect ratio.
Compatible With Google Slides

Get This In WideScreen
You must be logged in to download this presentation.
PowerPoint presentation slides
Presenting Financial Statements Ratio Analysis Interpretation PowerPoint Presentation Slides. PowerPoint slides are supported with Google slides. Quick downloading speed and formats can be changed to JPEG and PDF. Perfect for entrepreneurs, sales and corporate person. High resolution presentation themes, does not affect resolution even after resizing. Alter PPT template, font, text, color and design as per your manner. Images do no blur out even when they are projected on wide screen.
People who downloaded this PowerPoint presentation also viewed the following :
Content of this Powerpoint Presentation
Slide 1: This slide inroduces Financial Statements Ratio Analysis Interpretation. State Your Company Name and begin.
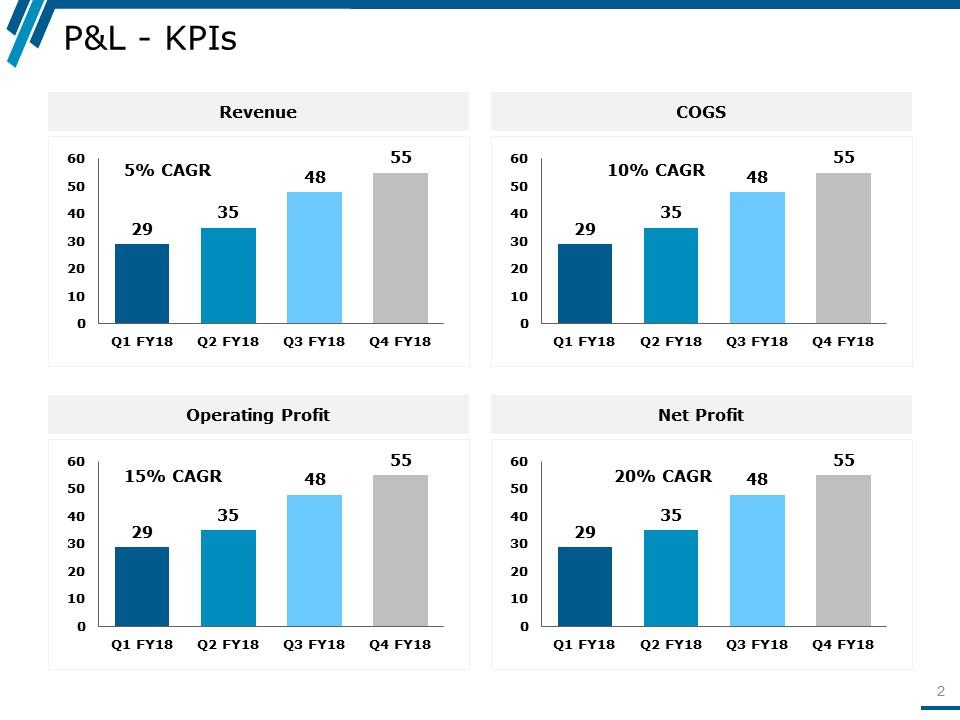
Slide 2: This slide presents P&L - KPIs with these of the following paratmeters- Revenue, Operating Profit, Net Profit.
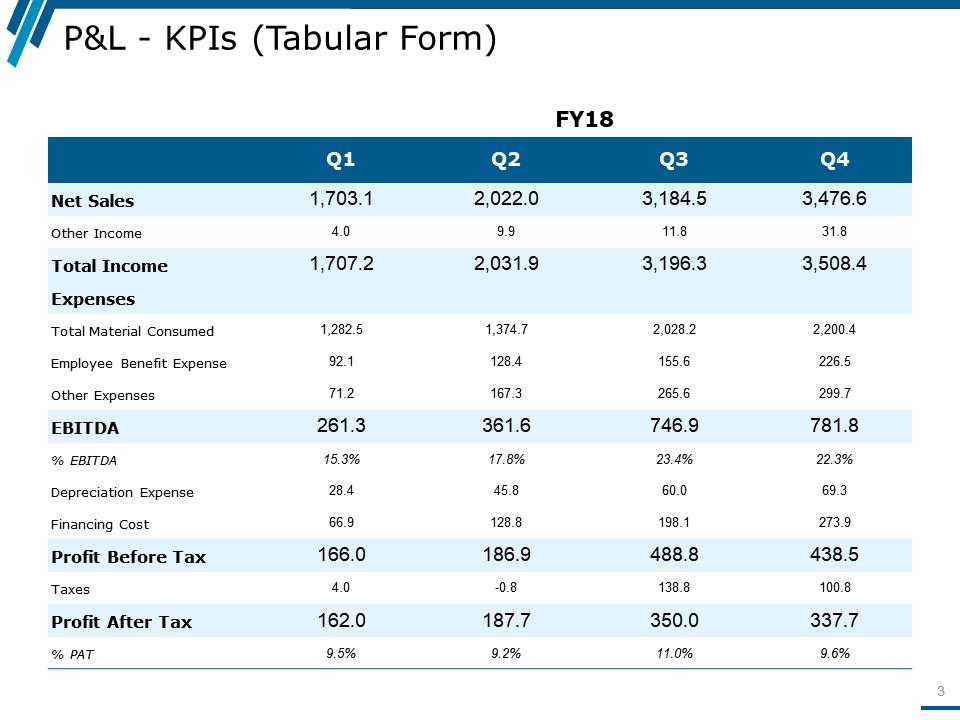
Slide 3: This slide presents P&L - KPIs (Tabular Form).
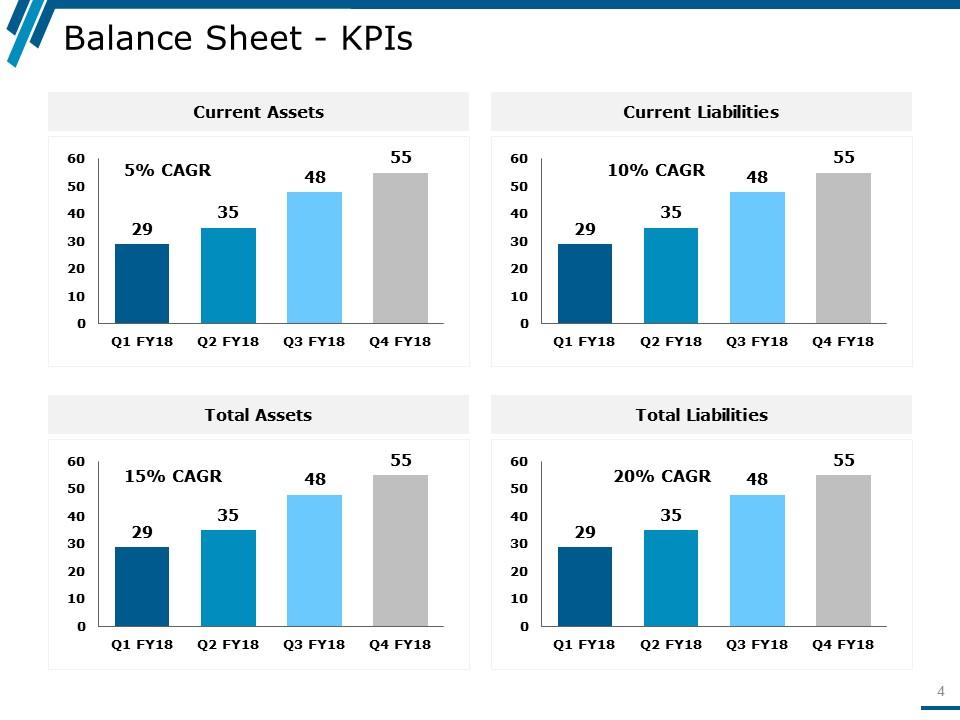
Slide 4: This slide showcases Balance Sheet - KPIs with these of the following factors- Current Assets, Current Liabilities, Total Assets, Total Liabilities.
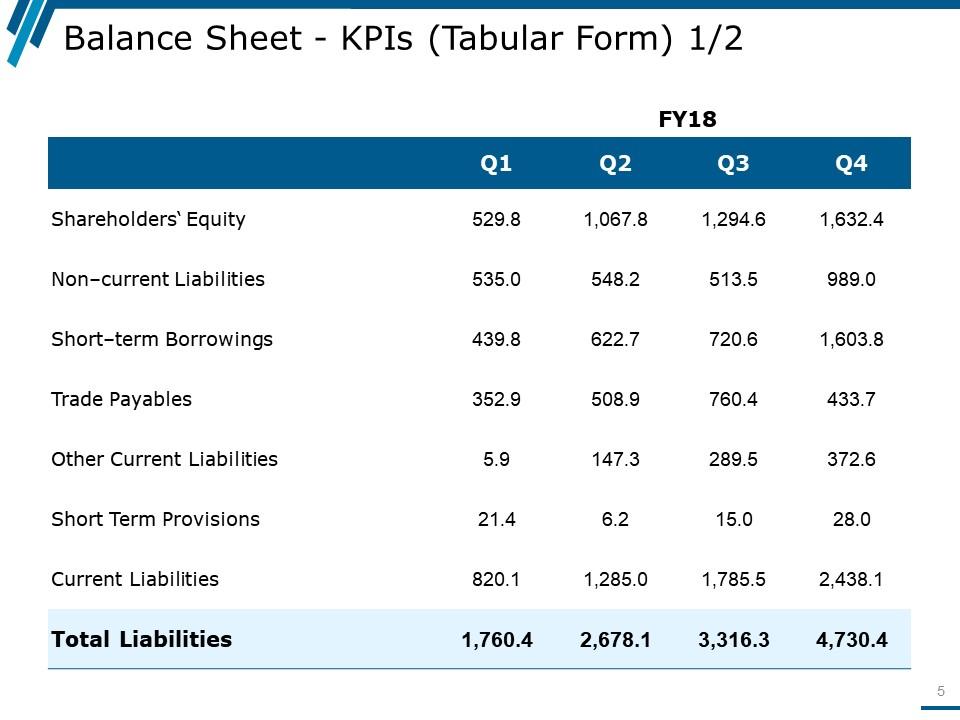
Slide 5: This slide presents Balance Sheet - KPIs (Tabular Form) 1/2.
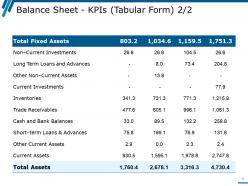
Slide 6: This slide showcases Balance Sheet - KPIs (Tabular Form) 2/2.
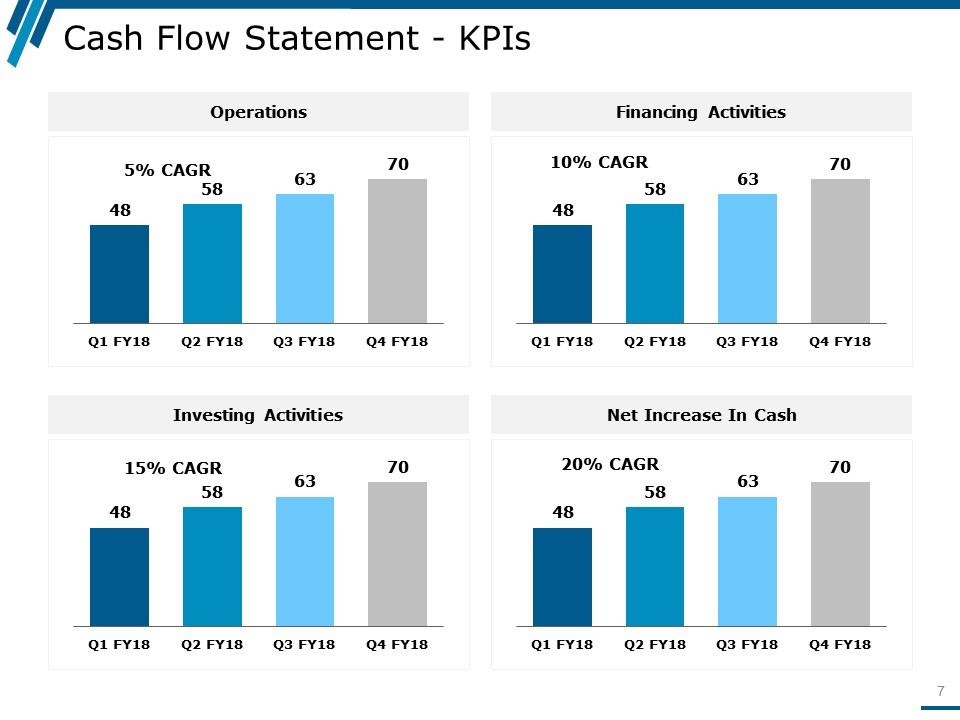
Slide 7: This slide presents Cash Flow Statement - KPIs Operations, Financing Activities, Investing Activities, Net Increase In Cash.
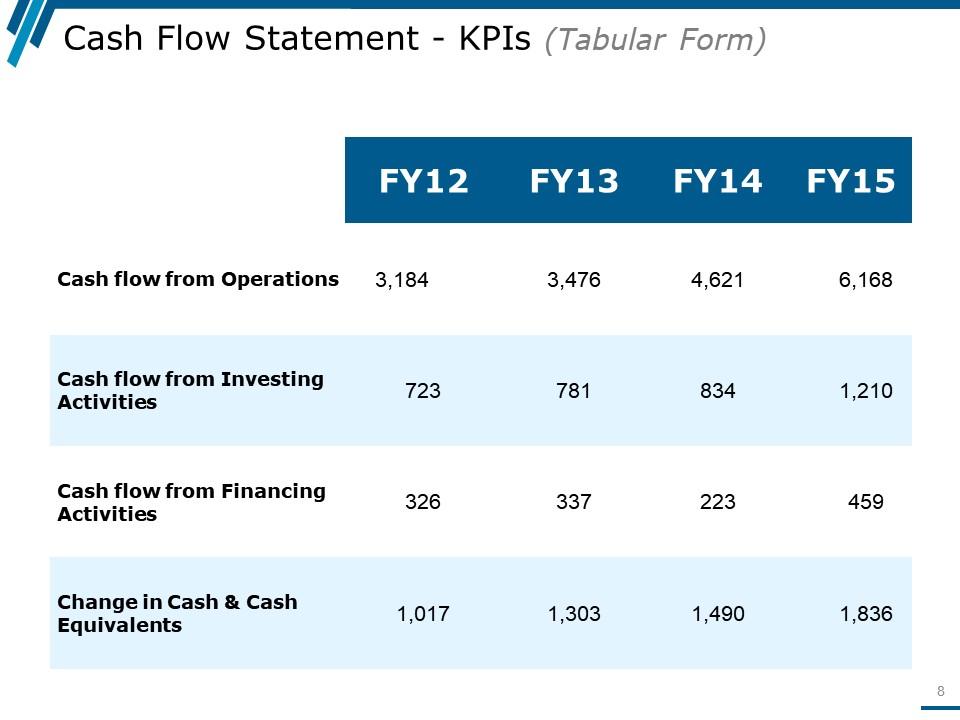
Slide 8: This slide showcases Cash Flow Statement - KPIs (Tabular Form).
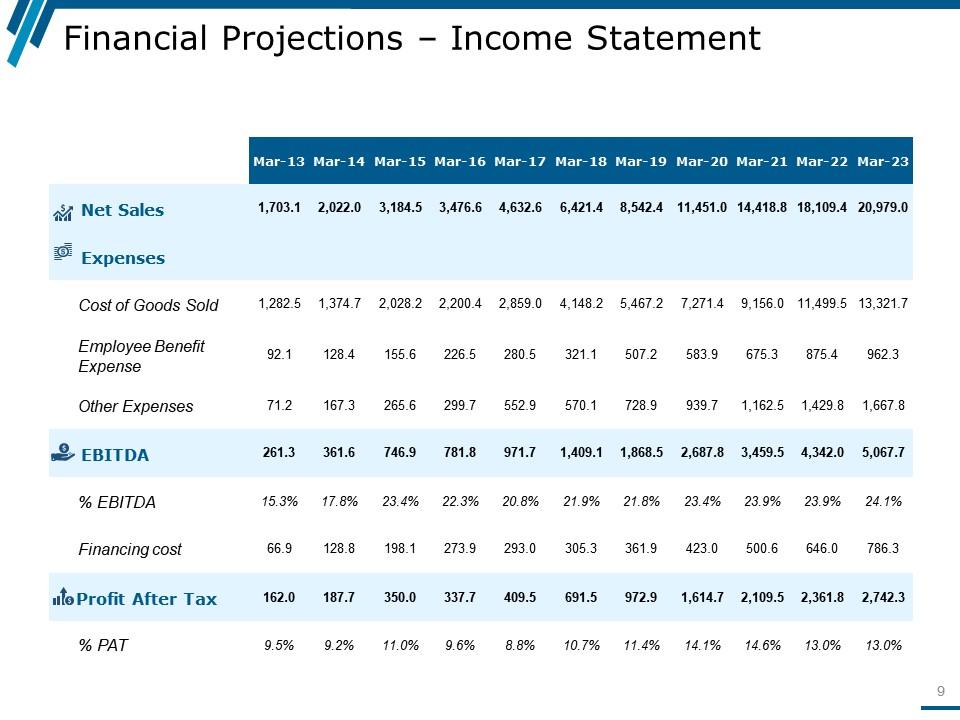
Slide 9: This slide presents Financial Projections – Income Statement.
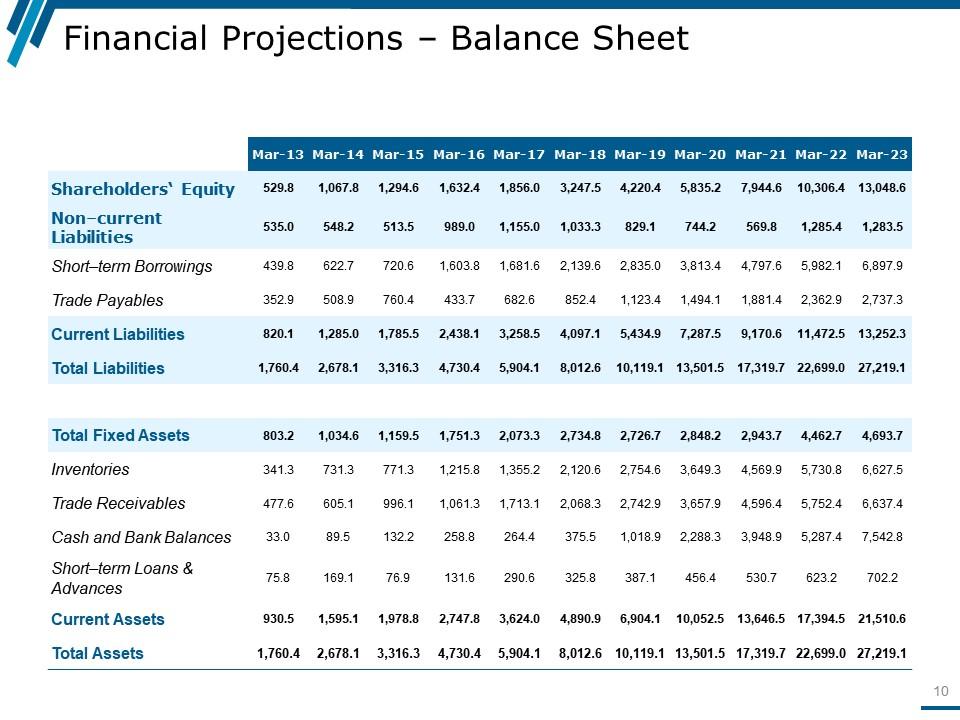
Slide 10: This slide showcases Financial Projections – Balance Sheet.
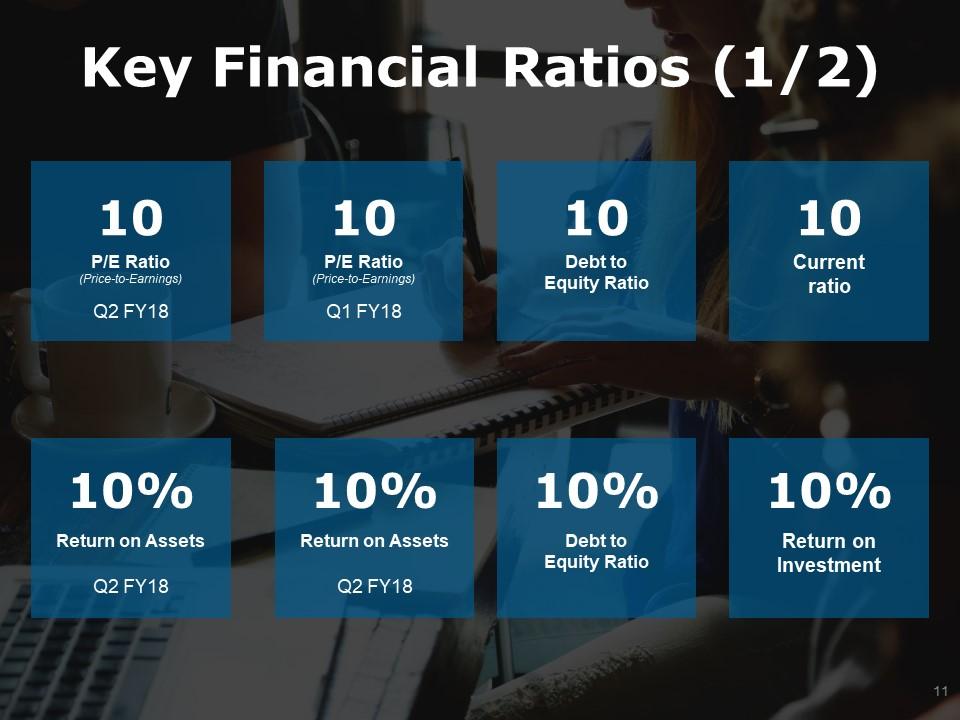
Slide 11: This slide presents Key Financial Ratios (1/2).
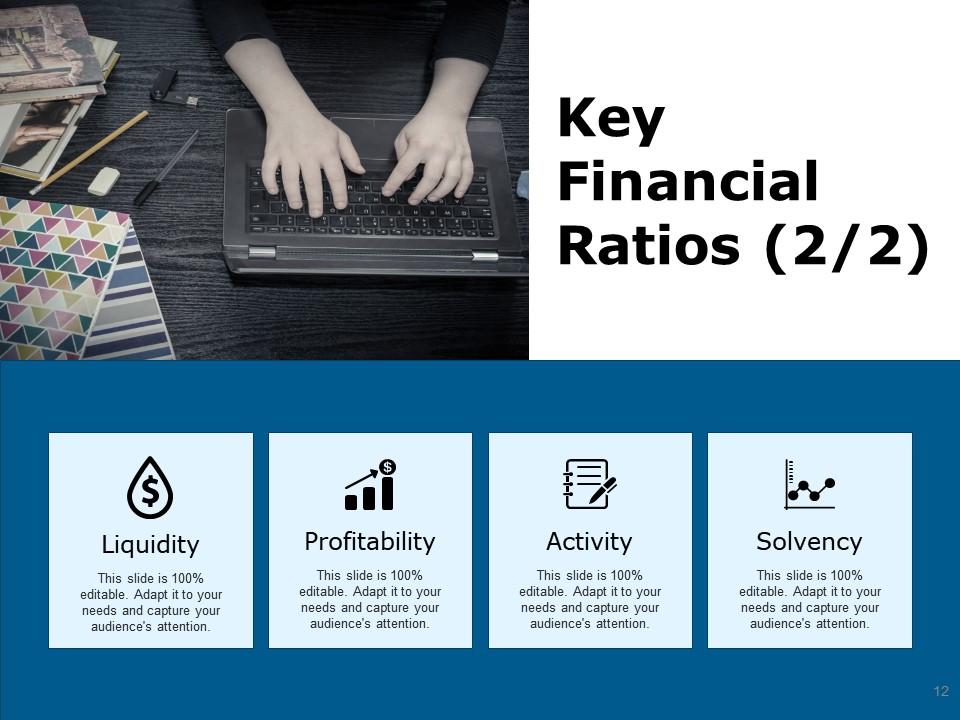
Slide 12: This slide showcases Key Financial Ratios (2/2) which further showcases - Liquidity, Profitability, Solvency, Activity.
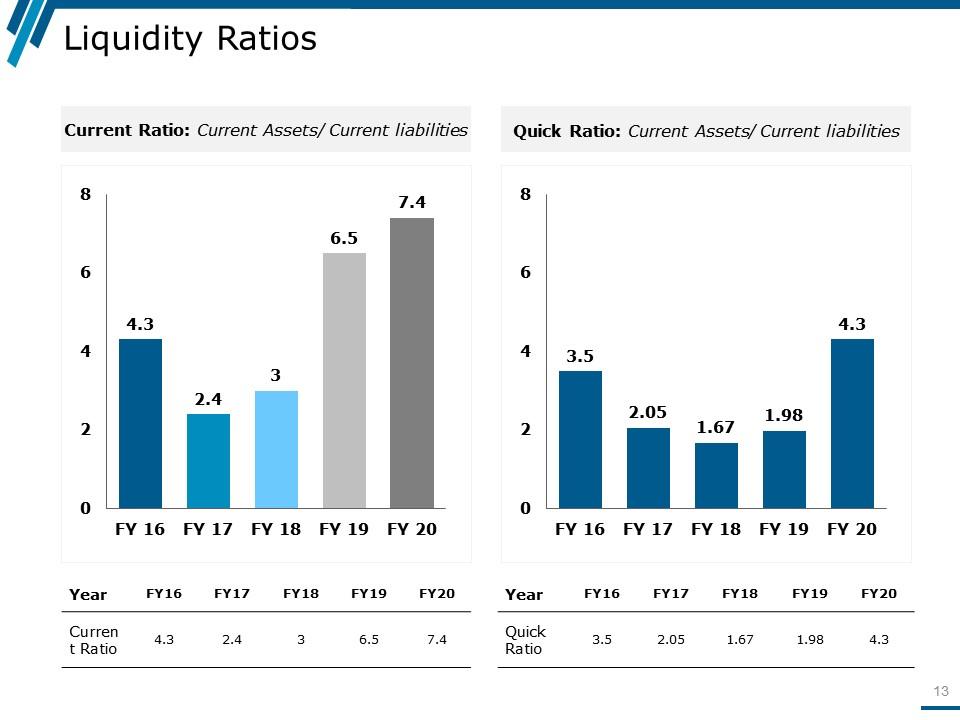
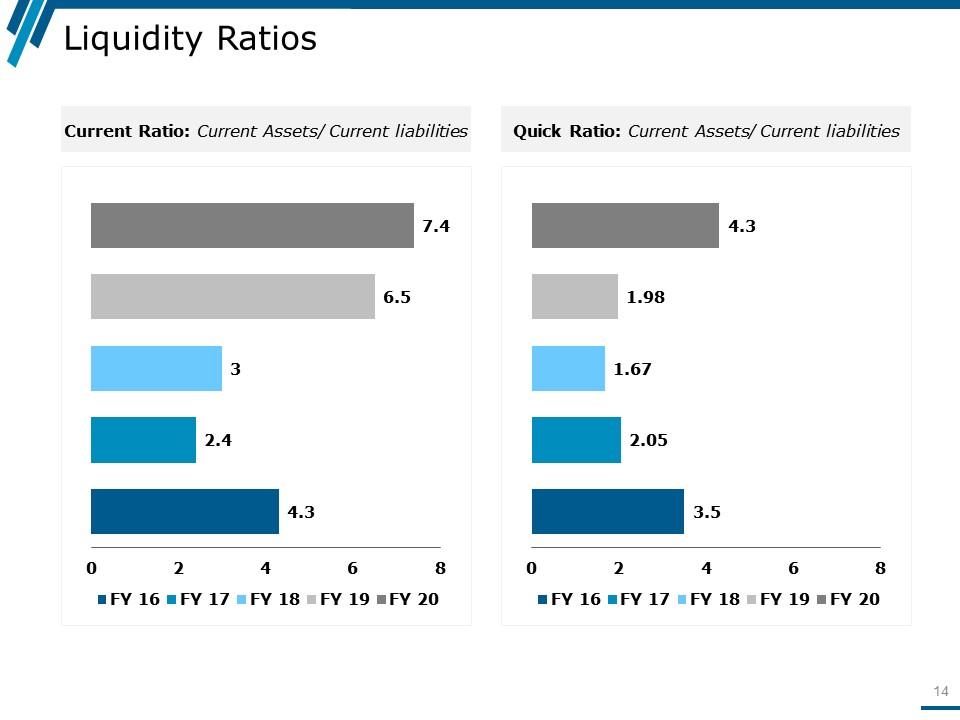
Slide 13: This slide presents Liquidity Ratios with these of the two factors- Quick Ratio, Current Ratio.
Slide 14: This slide showcases Liquidity Ratios.
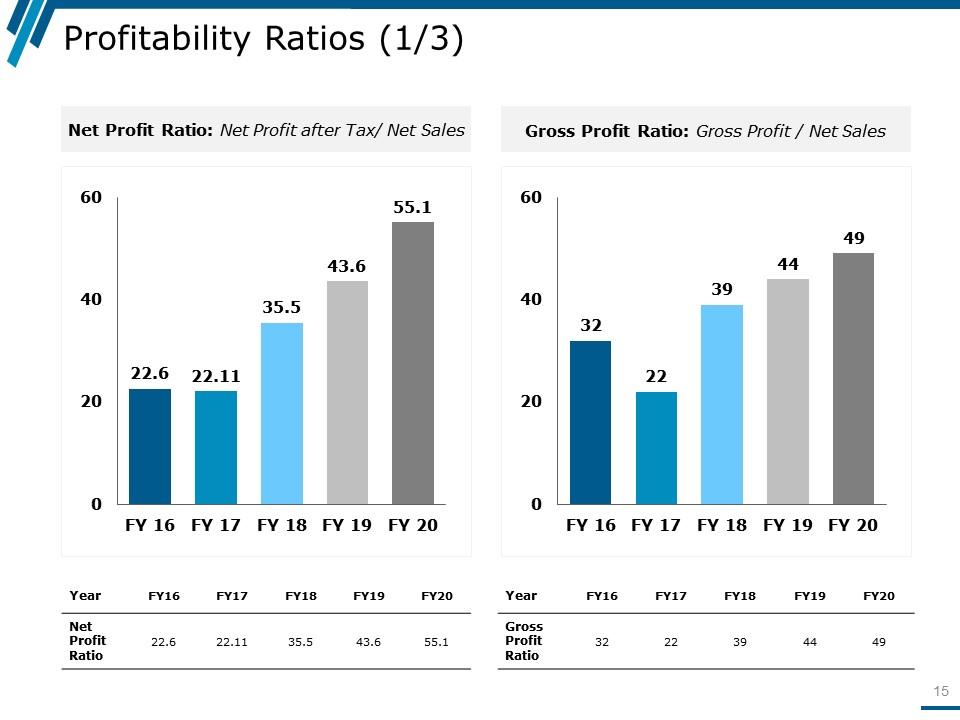
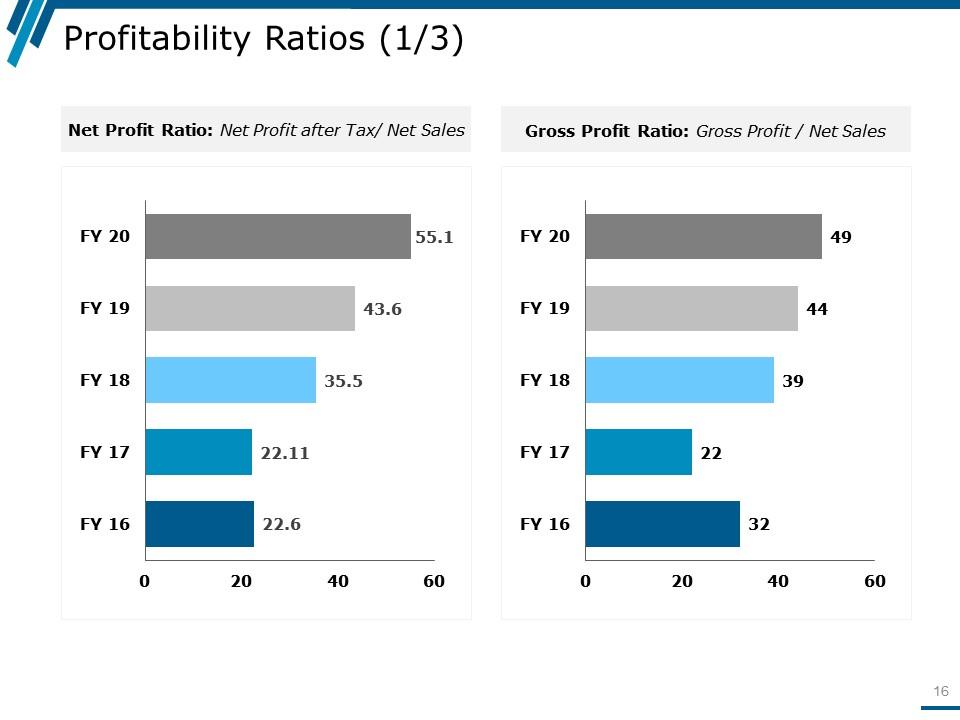
Slide 15: This slide shows Profitability Ratios (1/3). You can add your data and use it.
Slide 16: This slide presents Profitability Ratios (1/3) with which you can show the ratios of gross and net profit.
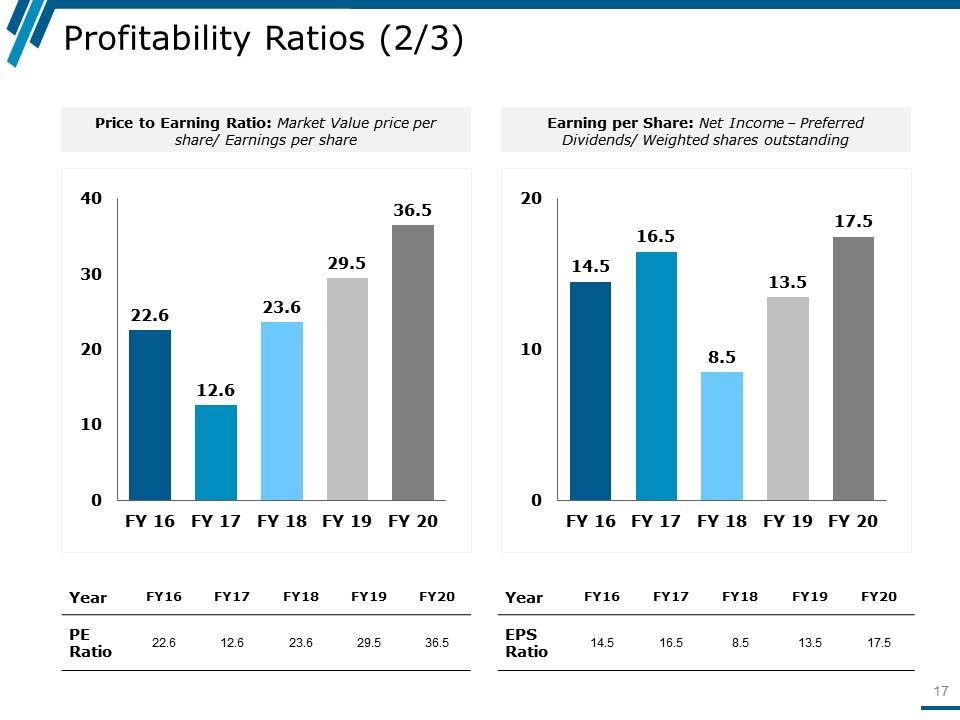
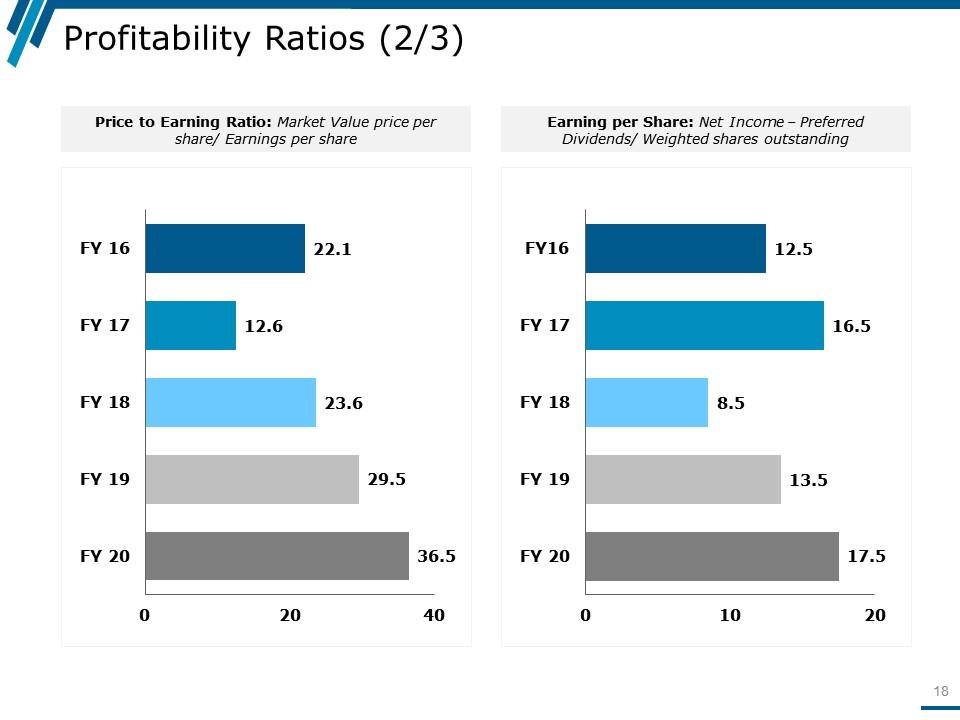
Slide 17: This slide showcases Profitability Ratios (2/3).
Slide 18: This slide presents Profitability Ratios (2/3).
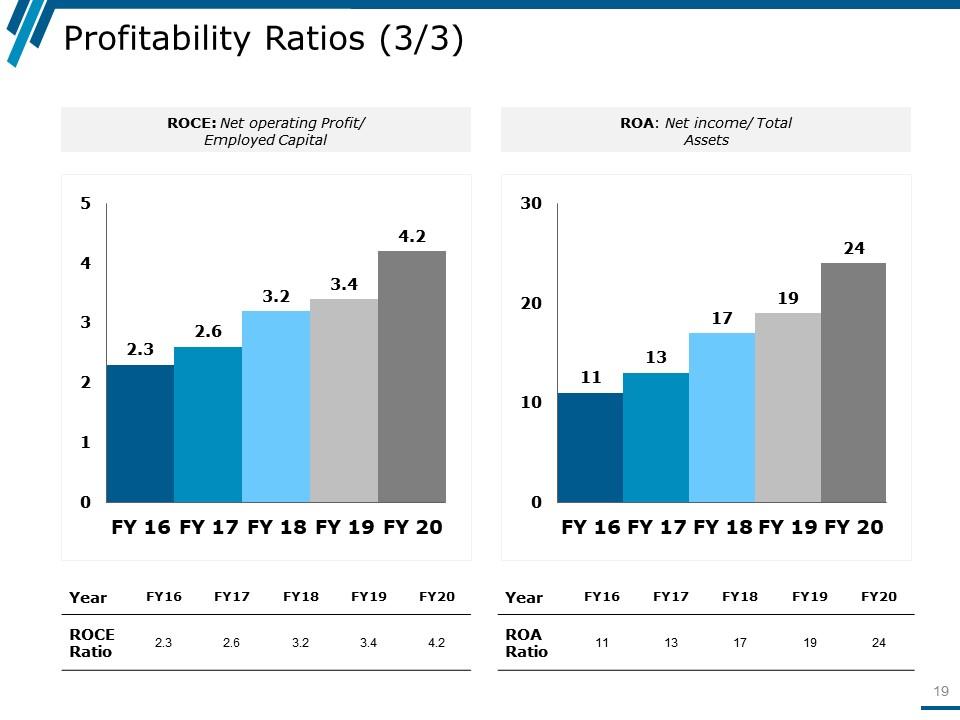
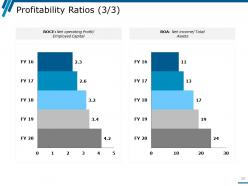
Slide 19: This slide showcases Profitability Ratios (3/3). Add the data and use it.
Slide 20: This slide presents Profitability Ratios (3/3). Add the details and make it for your own use.
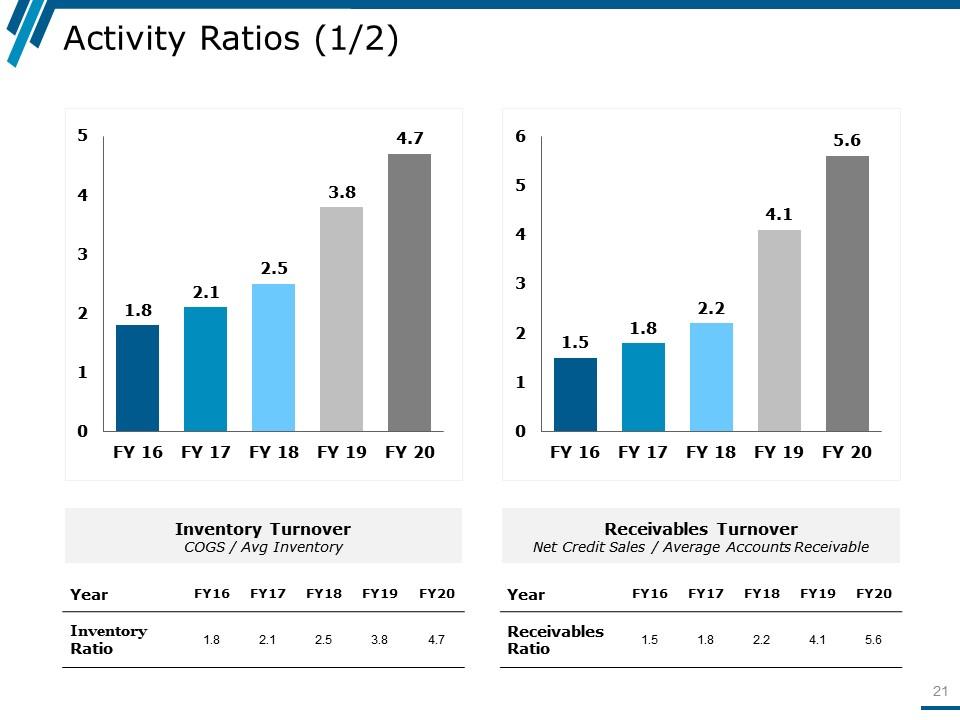
Slide 21: This slide shows Activity Ratios (1/2) with these of the following factors- Receivables Turnover, Net Credit Sales , Inventory Turnover, COGS / Avg Inventory.
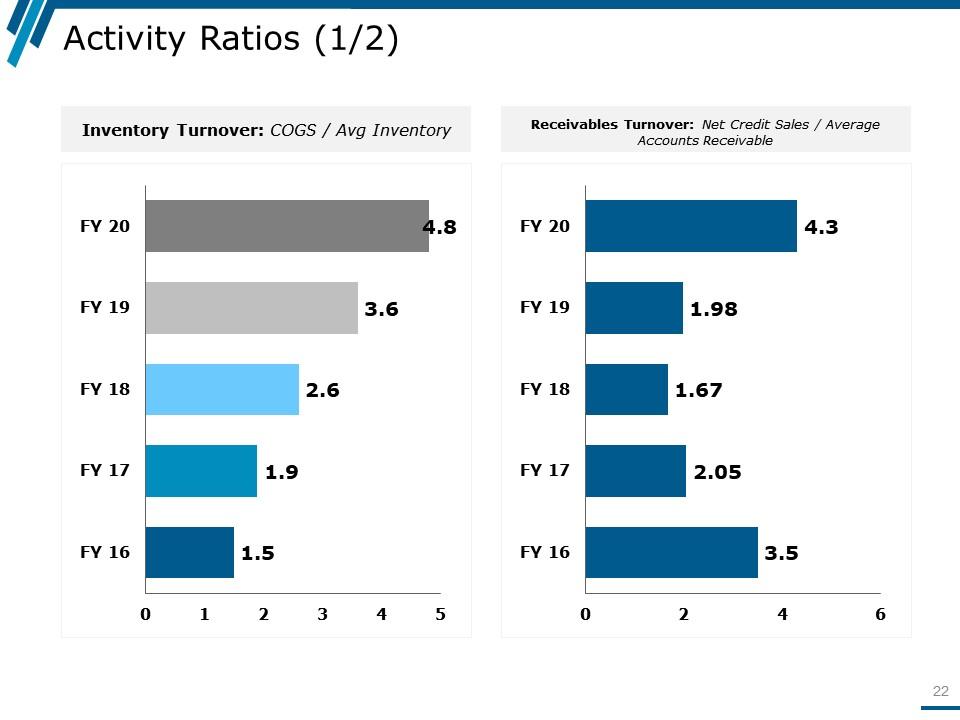
Slide 22: Thi slide showcases Activity Ratios (1/2) with these of the factors.
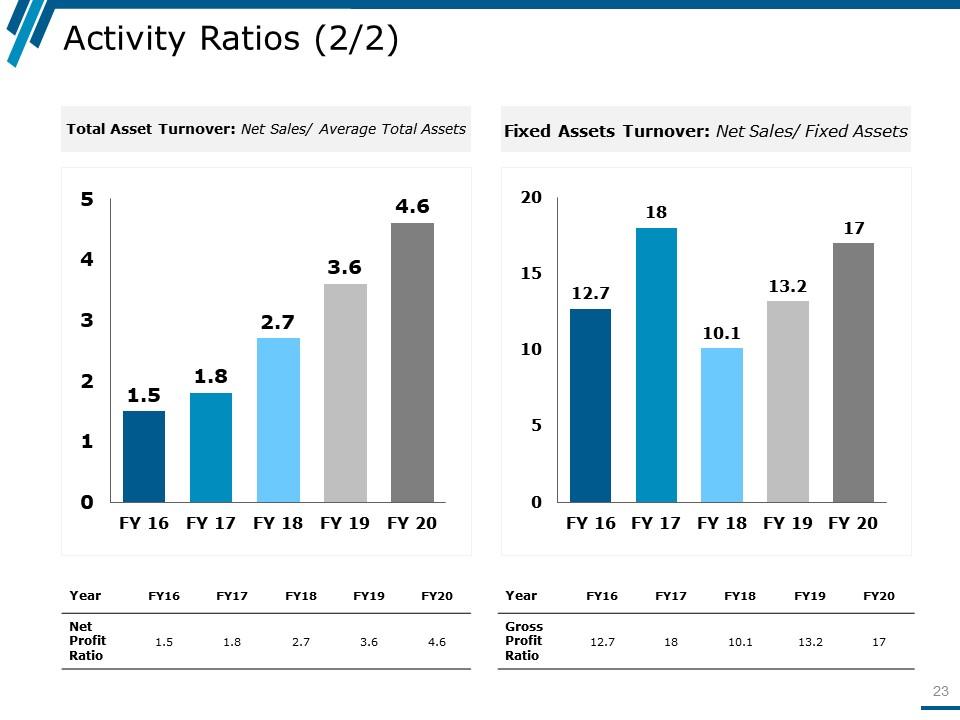
Slide 23: This slide presents Activity Ratios (2/2).
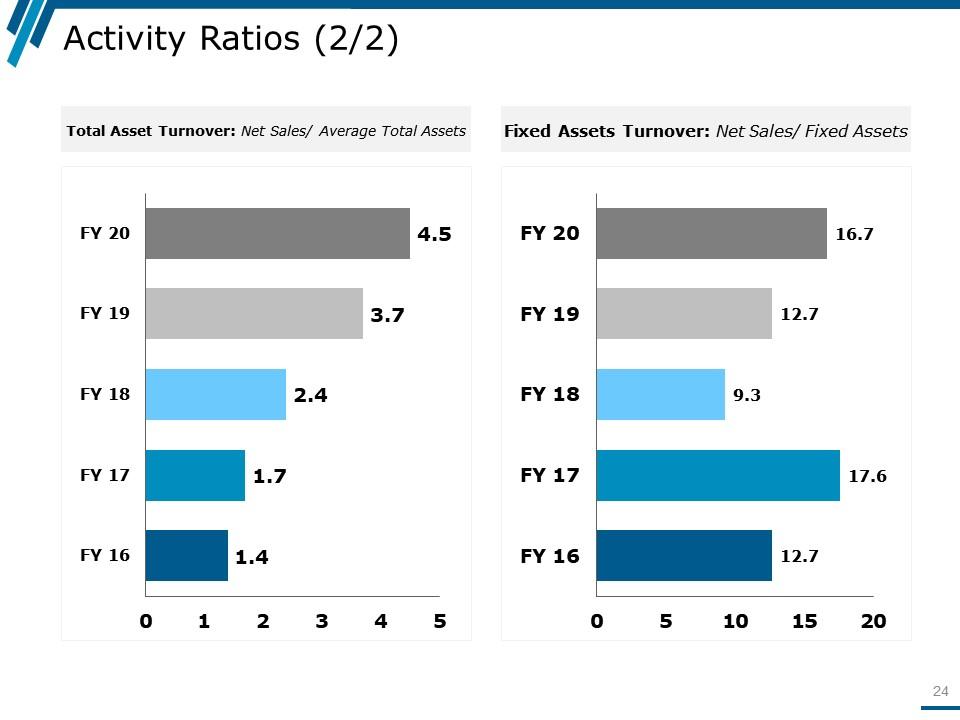
Slide 24: This slide shows Activity Ratios (2/2).
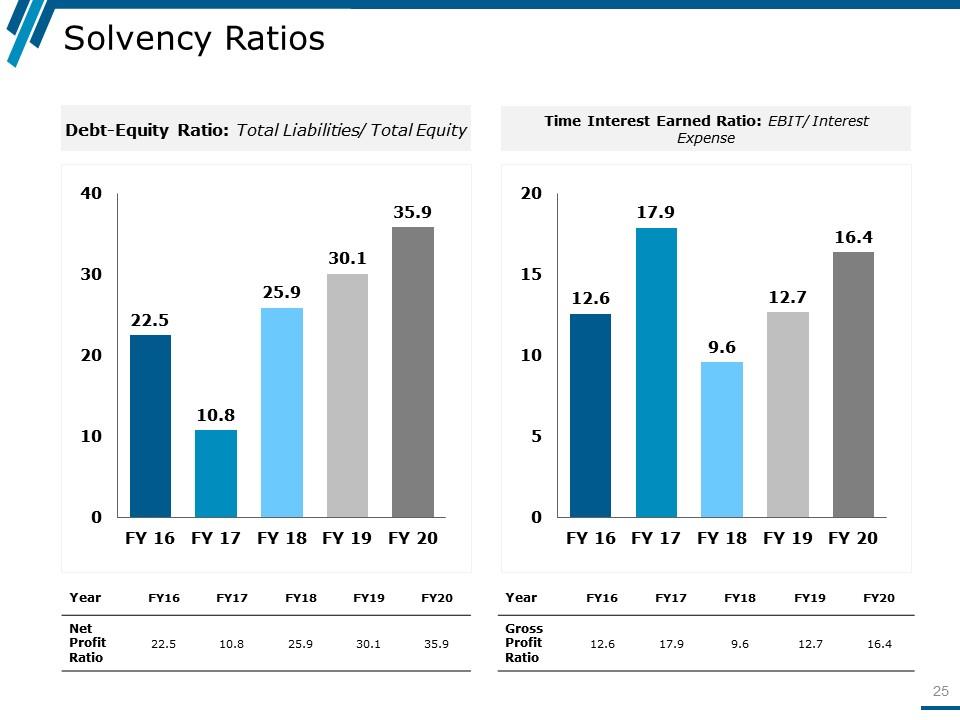
Slide 25: This slide presents Solvency Ratios. Add your own data and use it.
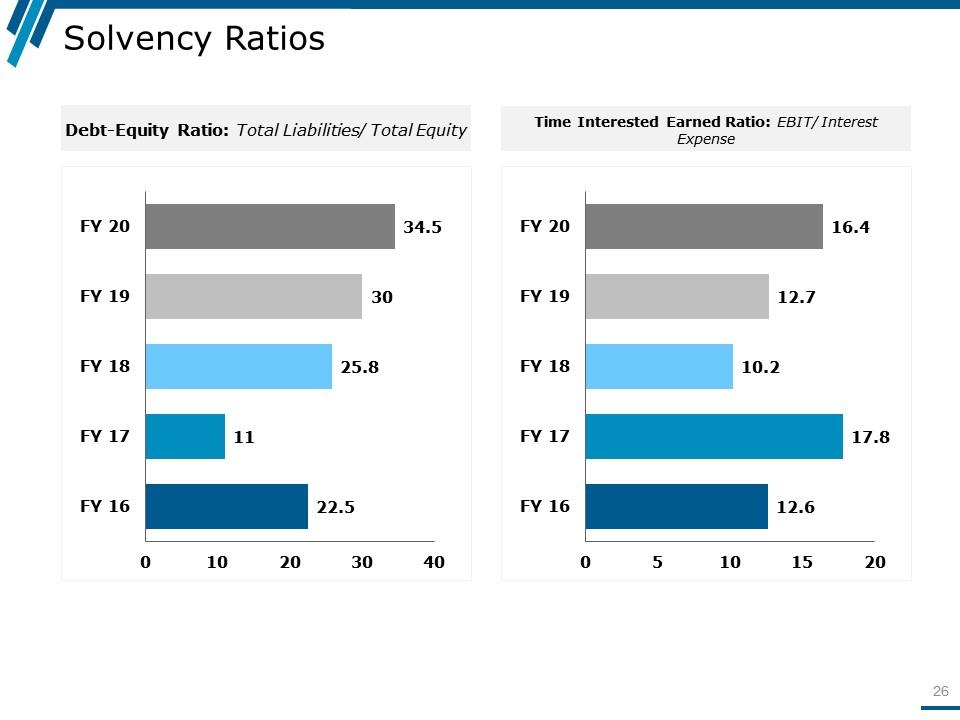
Slide 26: This slide showcases Solvency Ratios. You can use it as per your requirement.
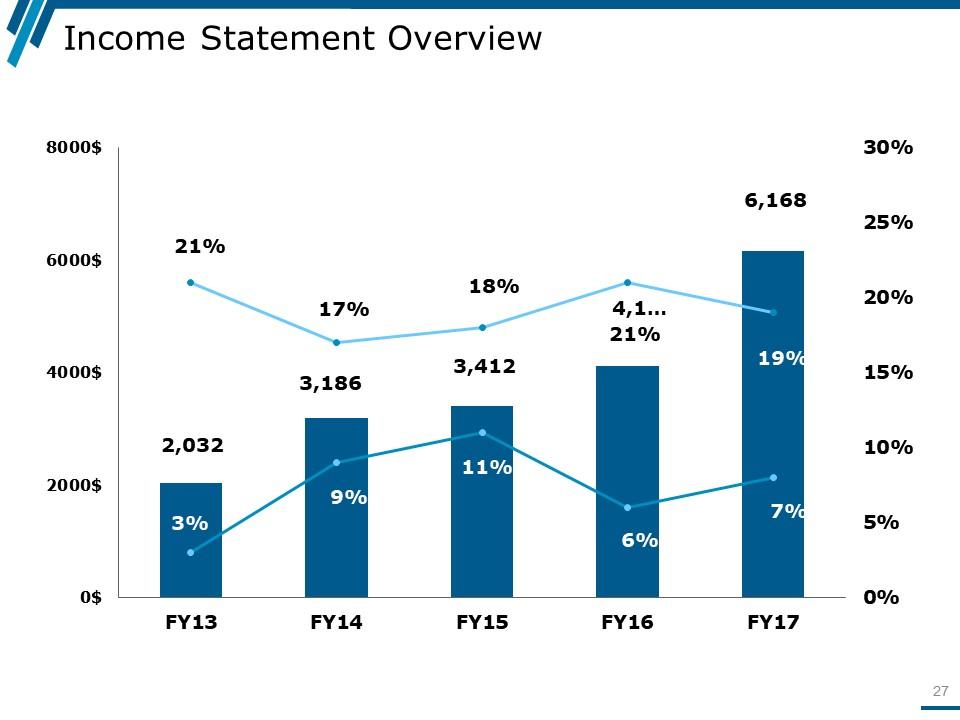
Slide 27: This slide presents Income Statement Overview.
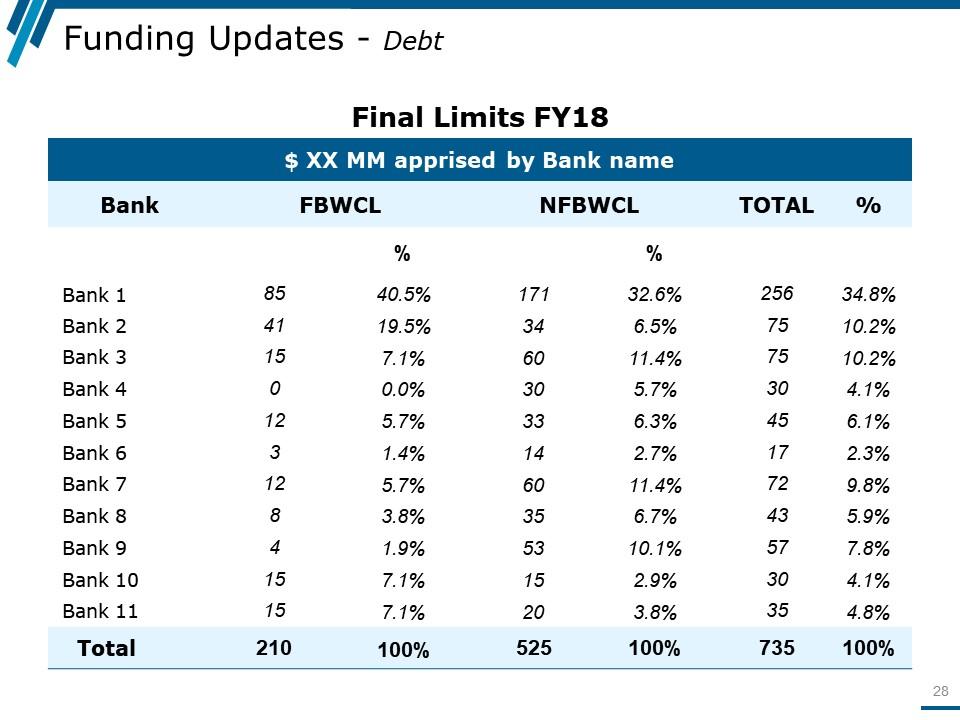
Slide 28: This slide showcases Funding Updates - Debt.
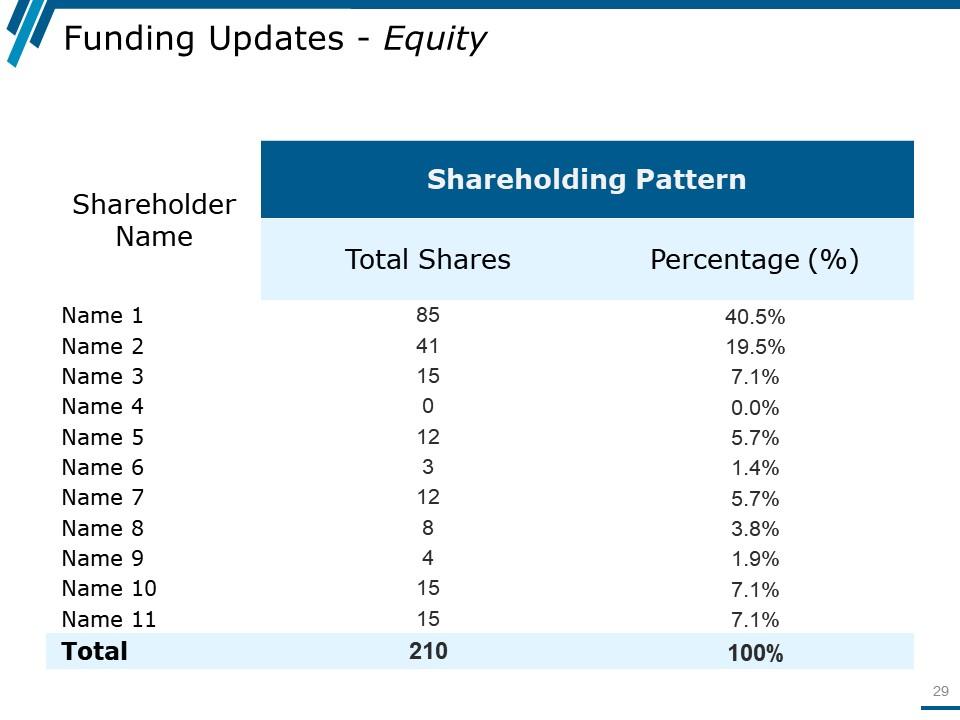
Slide 29: This slide presents Funding Updates - Equity.
Slide 30: This slide is a Coffee Break image for a halt.
Slide 31: This slide forwards to Charts & Graphs.
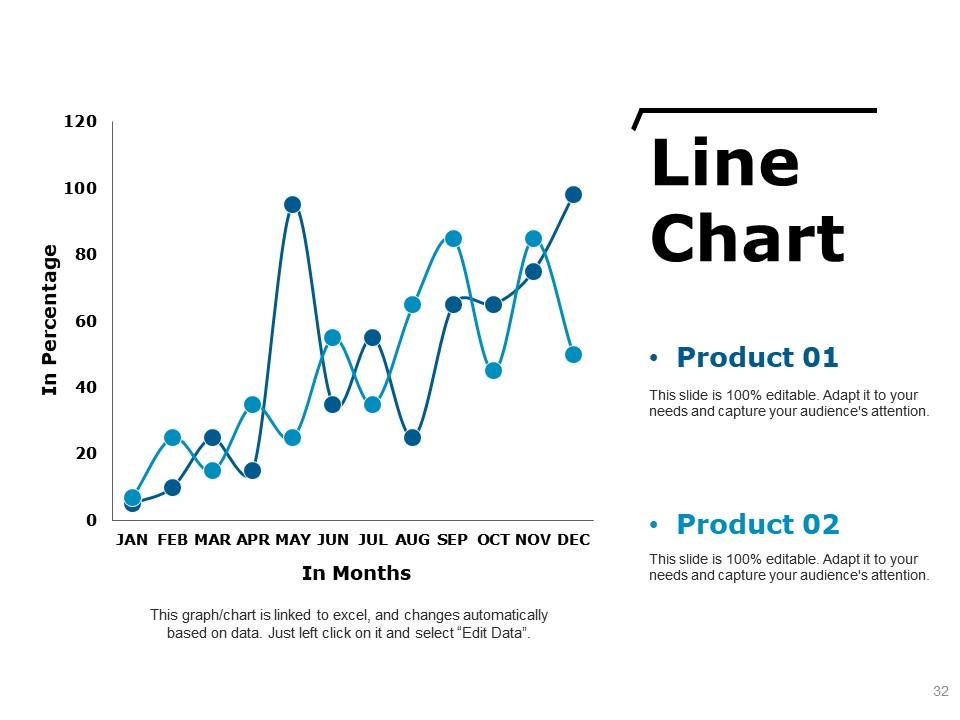
Slide 32: This slide shows a Line Chart for two product comparison
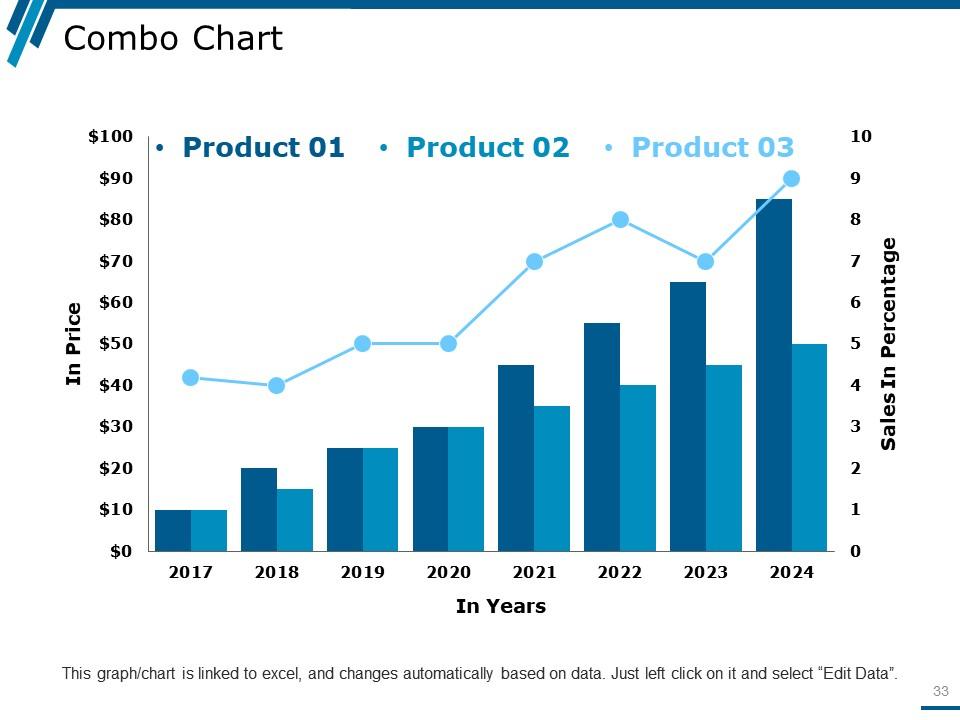
Slide 33: This slide showcases Combo Chart.
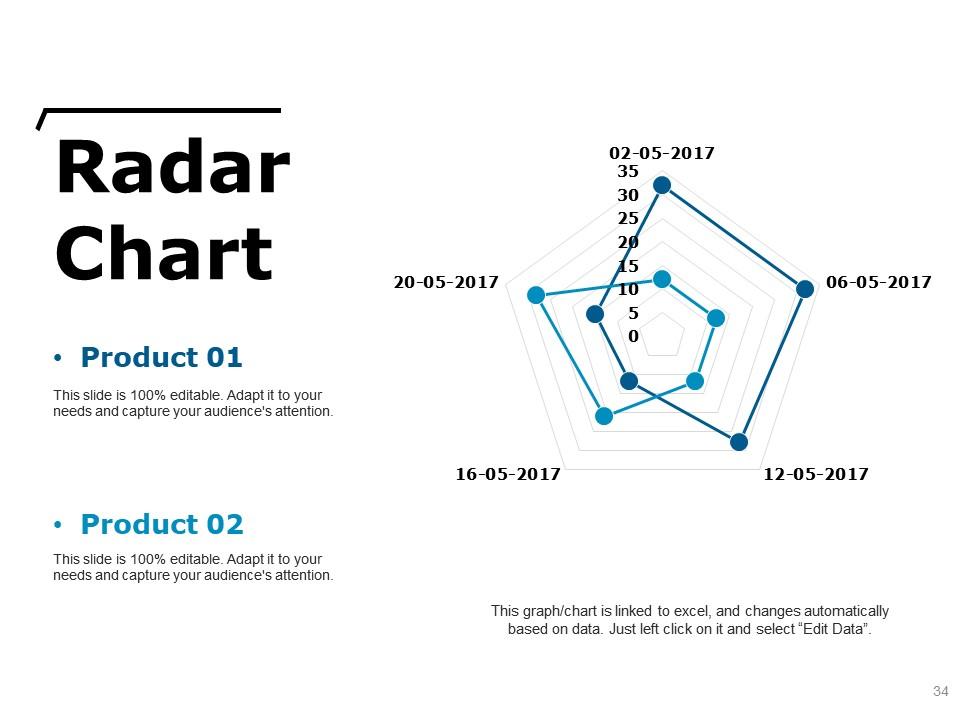
Slide 34: This is a Radar Chart slide for product/entity comparison
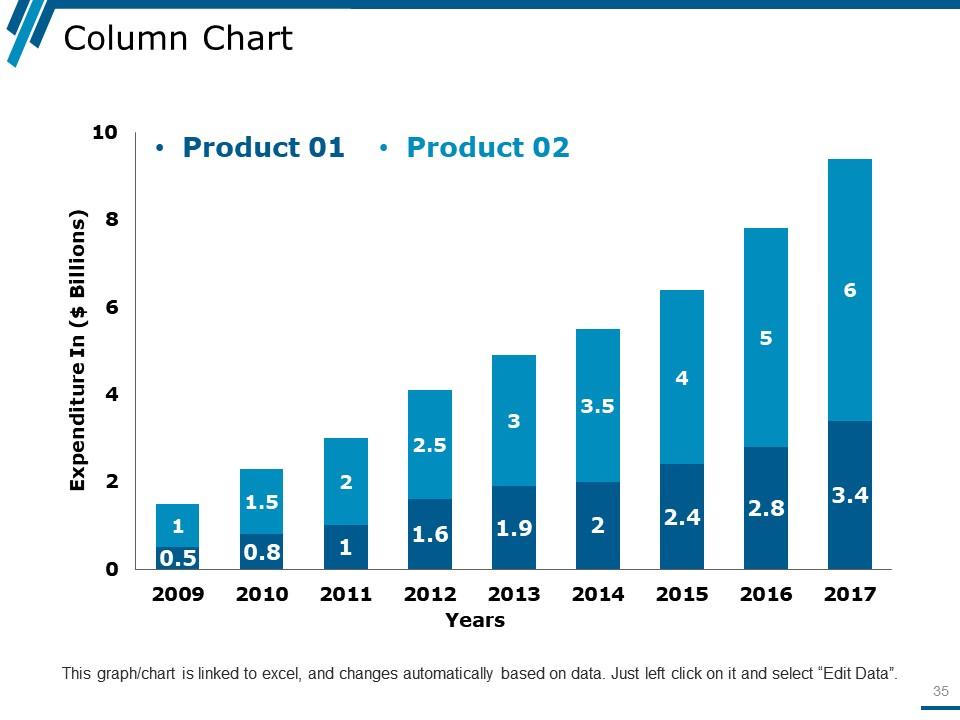
Slide 35: This slide shows Column Chart.
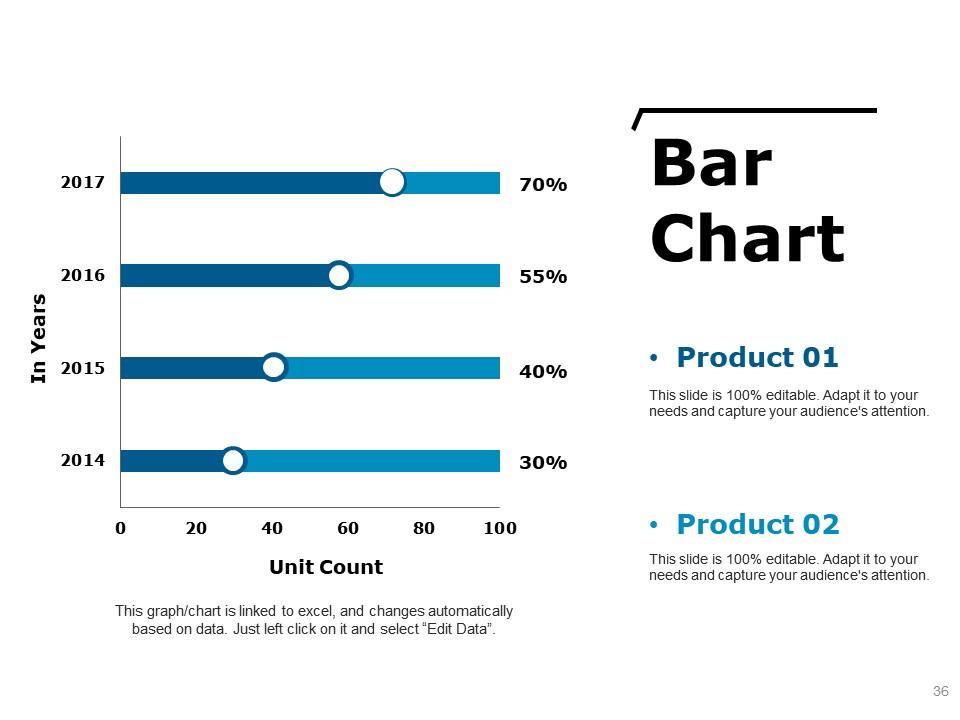
Slide 36: This slide presents Bar Chart. You can use it as required.
Slide 37: This slide is titled Additional Slides to move forward.
Slide 38: This is a Vision, Mission and Goals slide. State them here
Slide 39: This is an Our Team slide with name, image &text boxes to put the required information.
Slide 40: This is an About Us slide showing Our Company, Value Client, and Premium services as examples.
Slide 41: This is an Our Goal slide. State them here.
Slide 42: This slide shows Comparison of Positive Factors v/s Negative Factors with thumbsup and thumb down imagery.
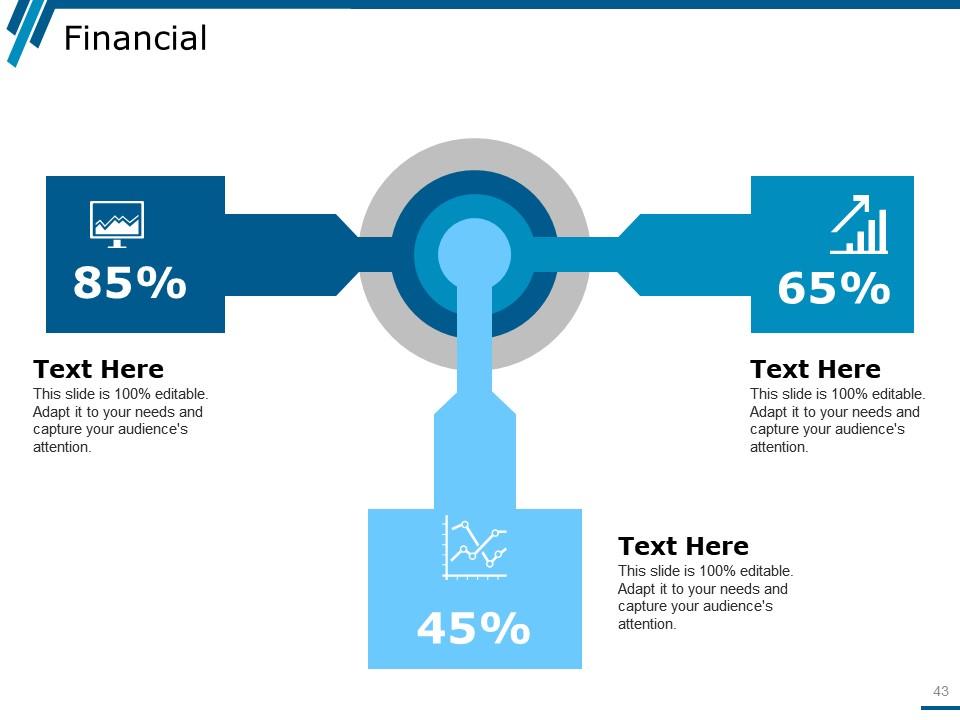
Slide 43: This is a Financial Score slide to show financial aspects here.
Slide 44: This is a Quotes slide to convey message, beliefs etc.
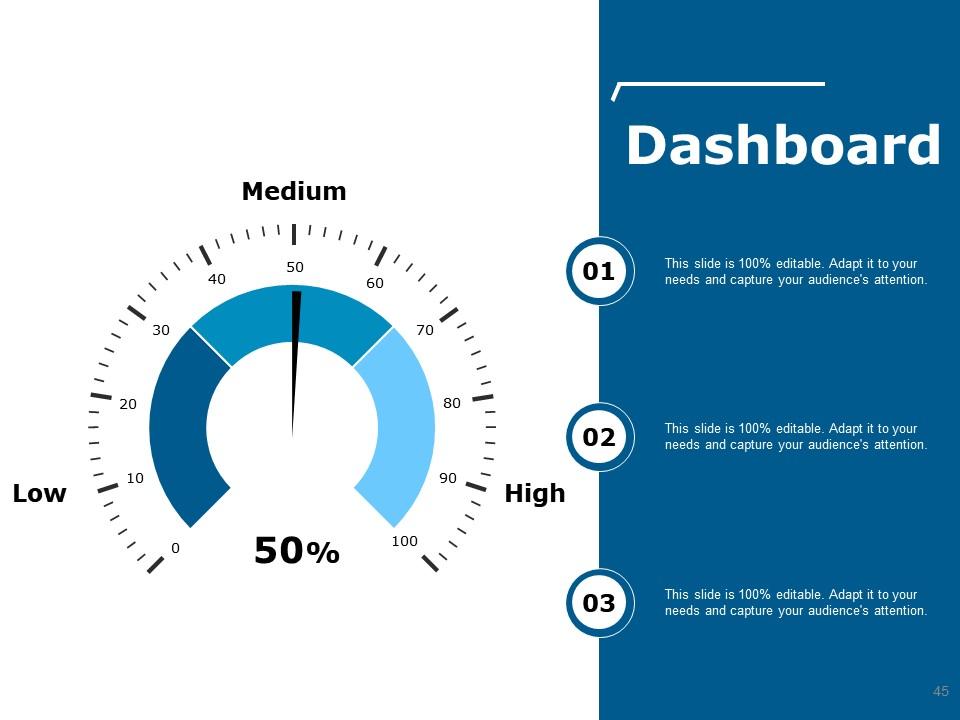
Slide 45: This is a Dashboard slide to show- Strategic System, Success, Goal Process, Sales Review, Communication Study.
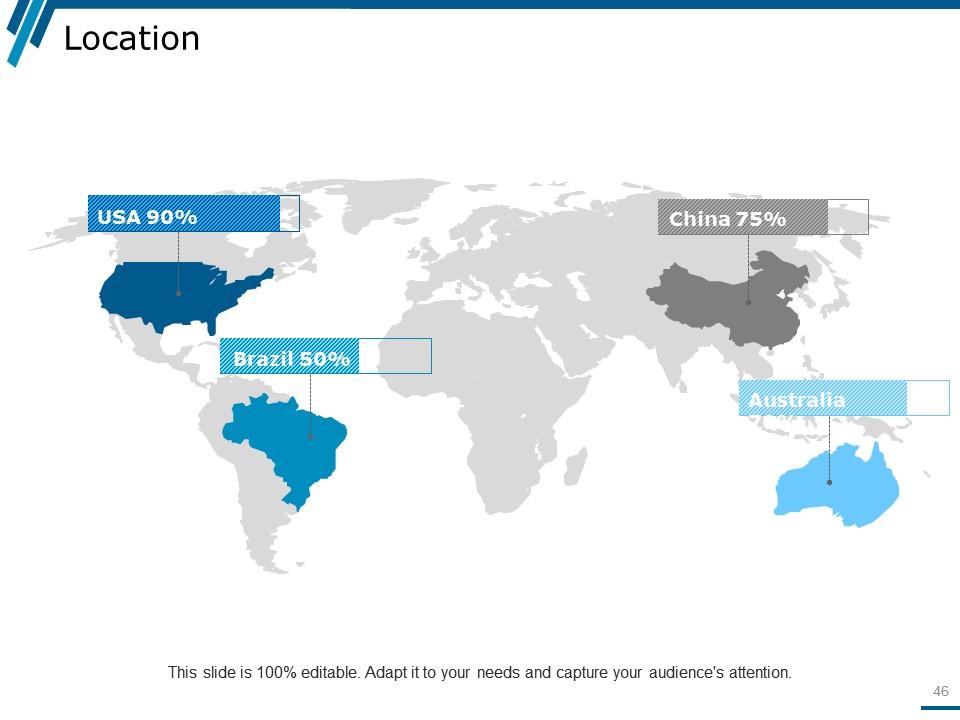
Slide 46: This is a Location slide to show global growth, presence etc. on world map.
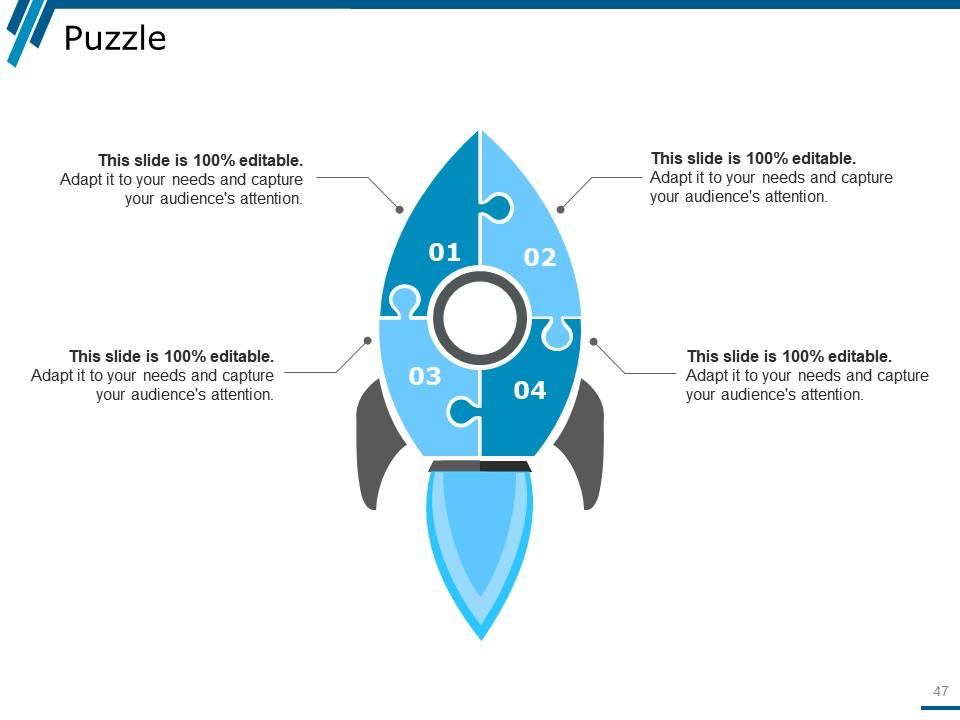
Slide 47: This slide showcases a Puzzle with imagery.
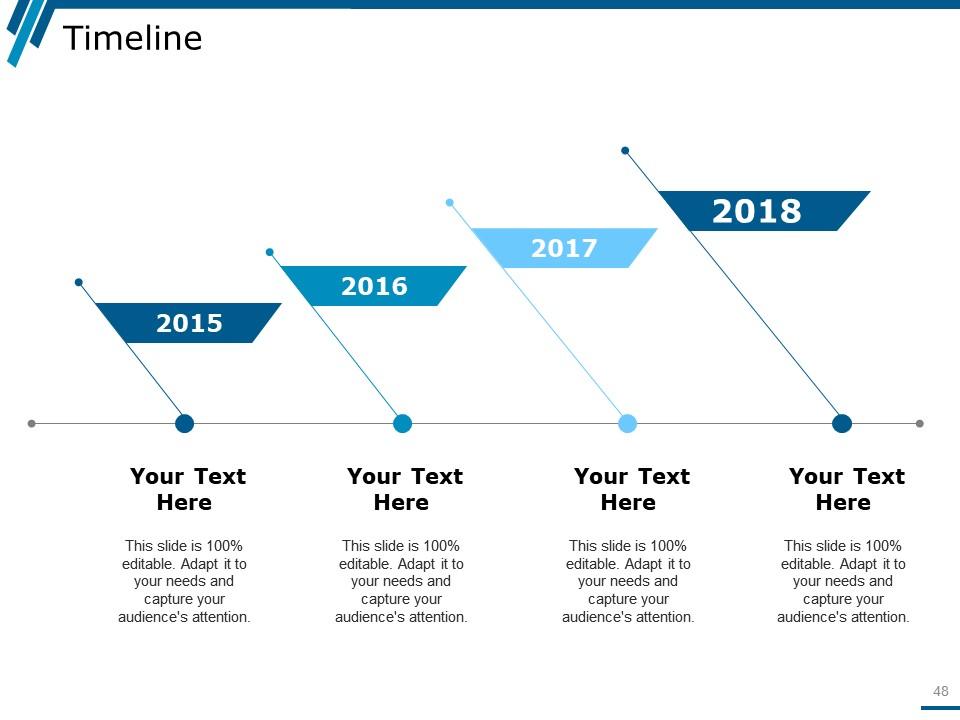
Slide 48: This slide presents a Timeline to show growth, milestones etc.
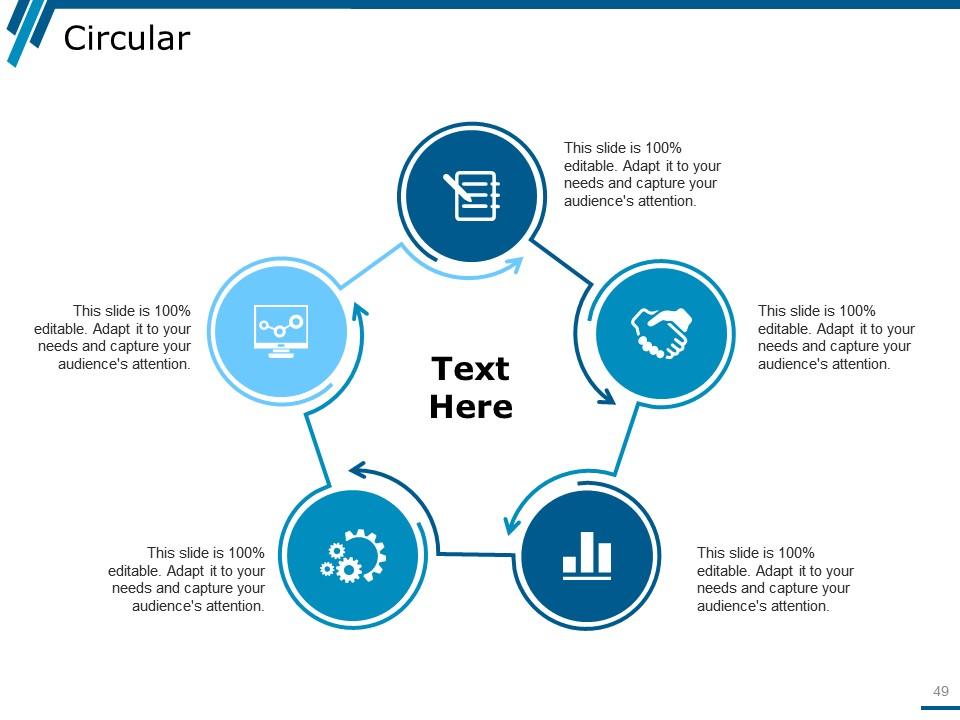
Slide 49: This is a Circular image slide to show information etc.
Slide 50: This is a Target slide. State your targets here.
Slide 51: This slide presents a Mind map with text boxes. Mind Map
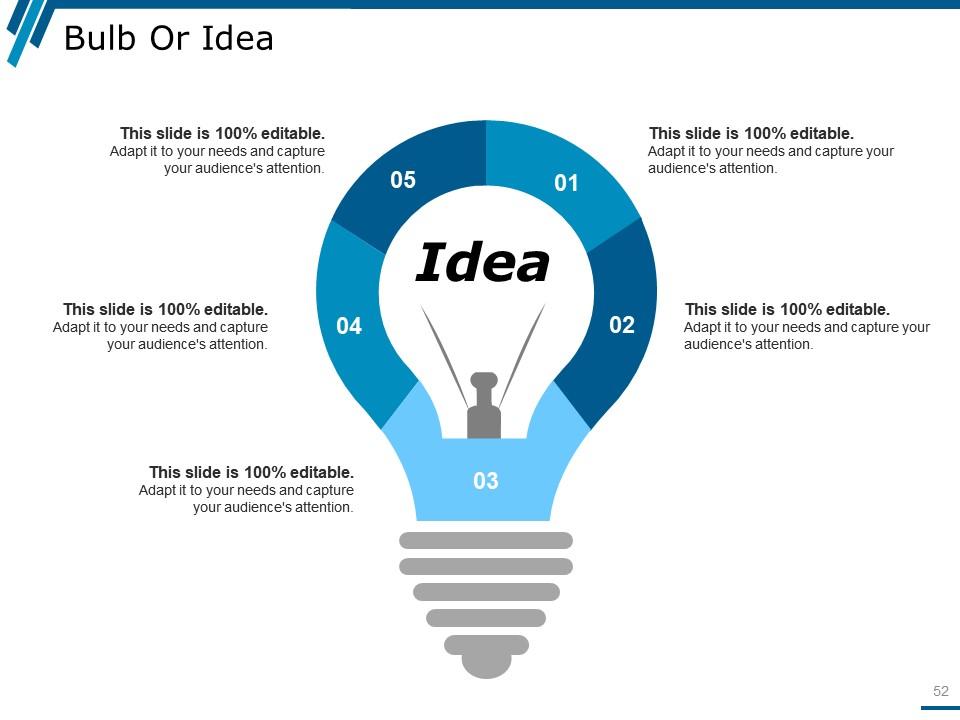
Slide 52: This is a Bulb/idea image slide to show information, ideas, innovation specific stuff etc.
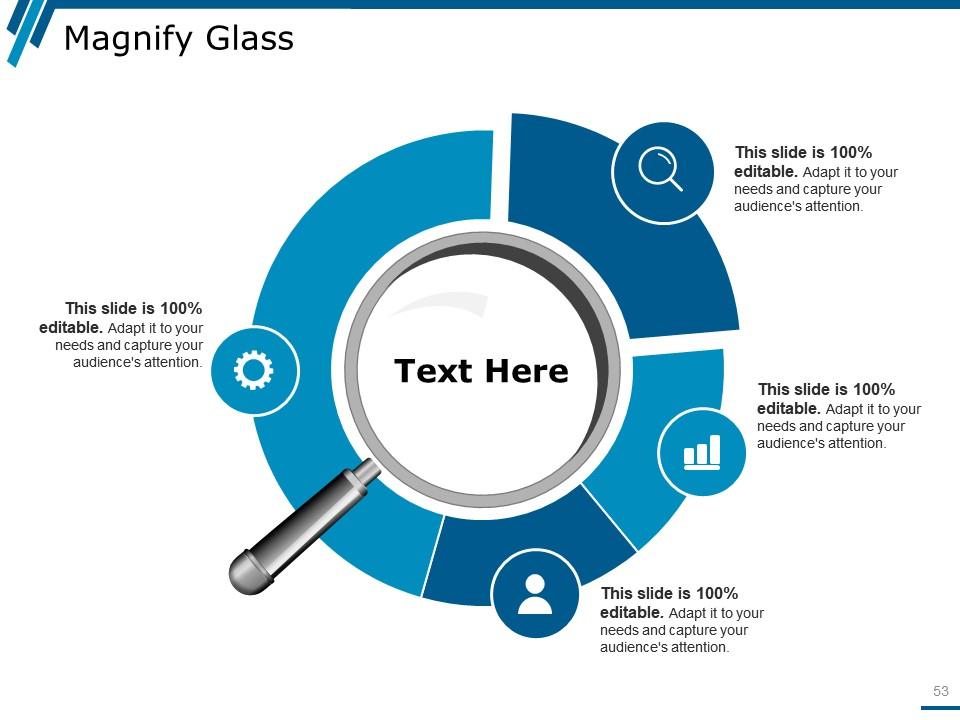
Slide 53: This is a Magnifying glass image slide to show information, scoping aspects etc.
Slide 54: This is a Thank You image slide with Address, Email and Contact number.
Financial Statements Ratio Analysis Interpretation Powerpoint Presentation Slides with all 54 slides:
Gift yourself with our Financial Statements Ratio Analysis Interpretation Powerpoint Presentation Slides. Be absolutely delighted with your choice.
-
Awesomely designed templates, Easy to understand.
-
Unique and attractive product design.


