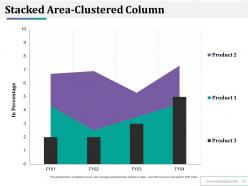
Company Evp Framework Powerpoint Presentation Slides
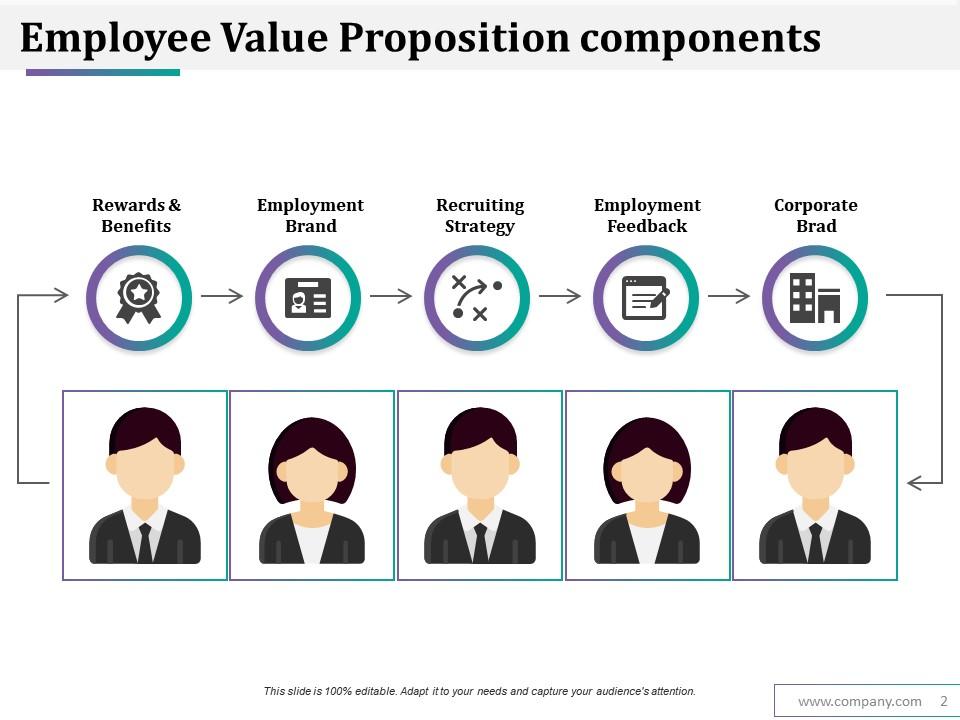
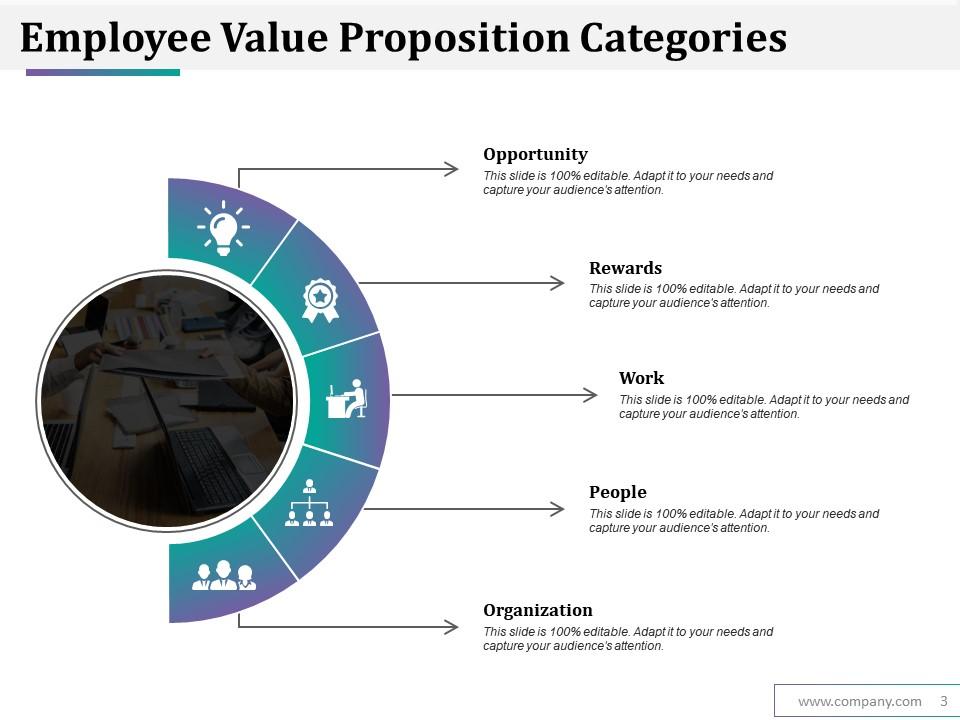
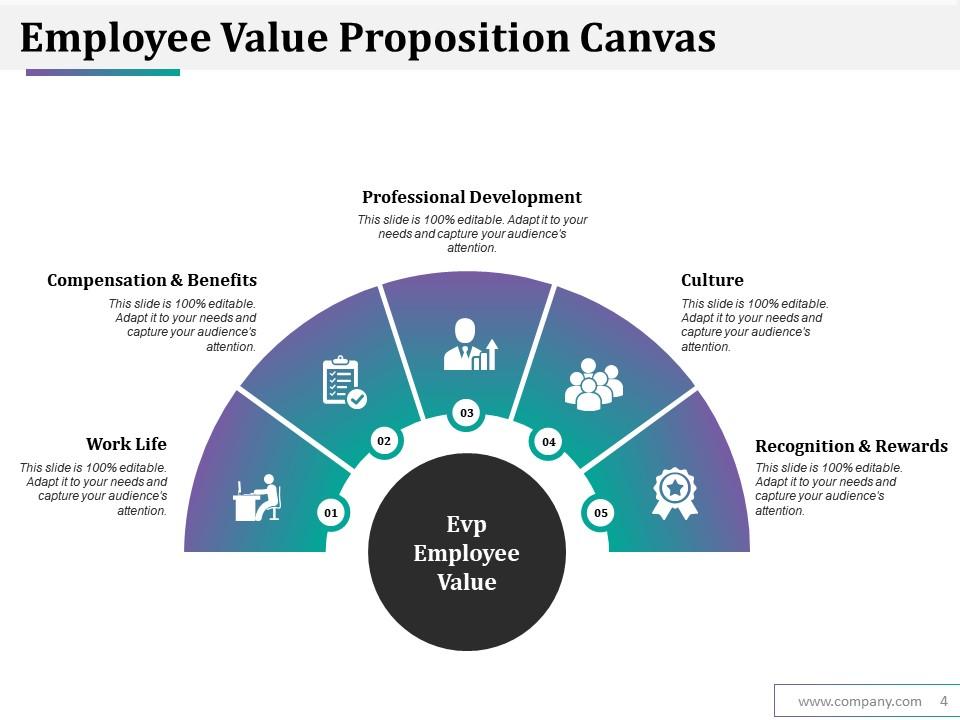
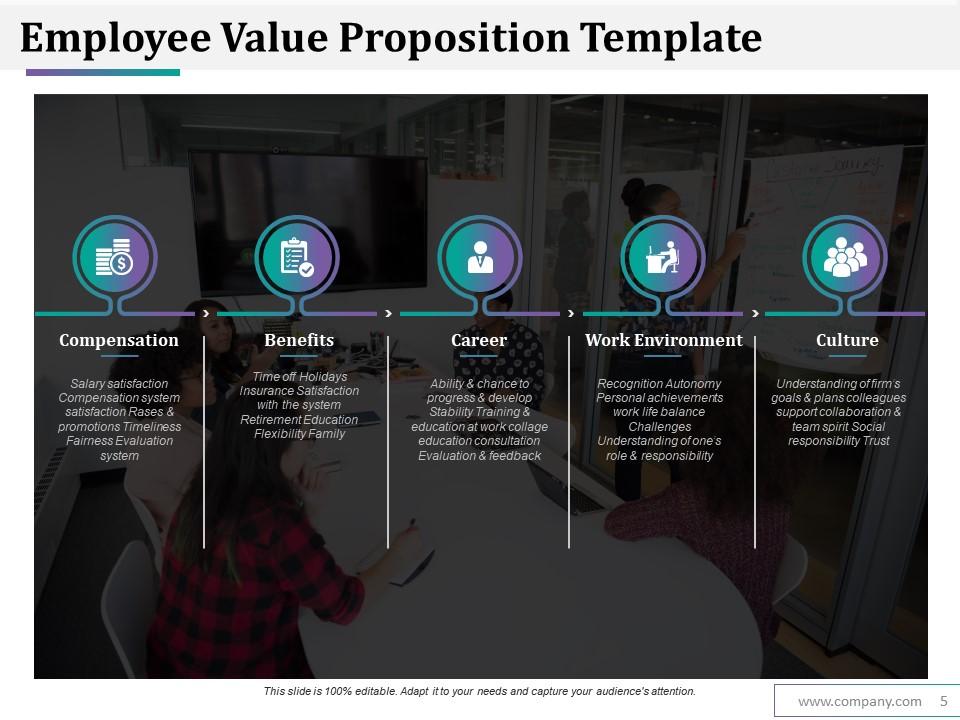
Offer a set of values to your employees using Company Evp Framework PowerPoint Presentation Slides. Incorporate this content-ready company evp framework PPT slideshow to present employees benefits and attract candidates. Let these professionally designed employee value proposition PowerPoint templates engage and retain new hires. Give them a chance to make yourself their employer of choice, evoke perfect candidate’s interest by luring them with ready-made employee value proposition PPT slides. Hire best talent that are well suited for your company. This ready-to-use company evp framework complete PPT presentation has a lot to offer you. It covers topics like evp components, evp categories, evp framework, and more. Pick your category, add your content and you are good to present. HR managers can avail these PPT templates to make their work easy. Grab this employee benefits complete presentation and become favorite of your employees. Enable folks to fight their inhibitions with our Company Evp Framework Powerpoint Presentation Slides. Encourage them to demonstrate confidence.
- Google Slides is a new FREE Presentation software from Google.
- All our content is 100% compatible with Google Slides.
- Just download our designs, and upload them to Google Slides and they will work automatically.
- Amaze your audience with SlideTeam and Google Slides.
-
Want Changes to This PPT Slide? Check out our Presentation Design Services
- WideScreen Aspect ratio is becoming a very popular format. When you download this product, the downloaded ZIP will contain this product in both standard and widescreen format.
-

- Some older products that we have may only be in standard format, but they can easily be converted to widescreen.
- To do this, please open the SlideTeam product in Powerpoint, and go to
- Design ( On the top bar) -> Page Setup -> and select "On-screen Show (16:9)” in the drop down for "Slides Sized for".
- The slide or theme will change to widescreen, and all graphics will adjust automatically. You can similarly convert our content to any other desired screen aspect ratio.
Compatible With Google Slides

Get This In WideScreen
You must be logged in to download this presentation.
PowerPoint presentation slides
Presenting employee value proposition presentation slides. This deck comprises of total of 23 slides. Each PPT template consists of professional visuals with an appropriate content. These presentation templates have been designed keeping the customers requirement in mind. This complete presentation covers all the design elements such as layout, diagrams, icons, and more. This presentation deck has been crafted after an extensive research. You can easily customize each template. Customize colour, text, icon, and font size as per your requirement. Easy to download. Compatible with all screen types and monitors. Supports Google Slides. Premium Customer Support available.
People who downloaded this PowerPoint presentation also viewed the following :
Content of this Powerpoint Presentation
Slide 1: This slide introduces Capital Expenditure. State Your Company Name and begin.
Slide 2: This slide showcases Capex Summary (Option 1 of 2). Add the data to for two financial year.
Slide 3: This slide presents Capex Summary (Option 2 of 2). Use the graph as per your need.
Slide 4: This slide showcases Capital Expenditure Details – FY 18.
Slide 5: This slide shows Capital Expenditure Valuation Methods. Add the details and make use of it.
Slide 6: This slide showcase Discounted Payback Period with advantage and disadvantages.
Slide 7: This slide shows Discounted Payback Period – Valuation Summary. You can add the data in the table as per your requirement.
Slide 8: This slide presents Net Present Value Method. You can use the formula for calculations.
Slide 9: This slide shows NPV Advantages & Disadvantages. You can your own or edit it as per your requirement.
Slide 10: This slide showcases Net Present Value – Valuation Summary table. You can add the information and use it accordingly.
Slide 11: This slide presents Internal Rate of Return. You can add the data as per your need.
Slide 12: This slide displays Internal Rate Of Return with these - Advantages, Disadvantages.
Slide 13: This slide presents Internal Rate of Return – Valuation Summary. Use it as per your requirement.
Slide 14: This slide showcases Valuation Methods Comparison with these you can compare the results of- Discounted Payback Period, The most suitable choice for valuation.
Slide 15: This slide shows Capital Asset Expenditure Icon.
Slide 16: This is a Coffee Break slide to halt. You may change it as per requirement. ge. Just right click and replace image.
Slide 17: This slide is titled Charts & Graphs to move forward.
Slide 18: This is a Column Chart slide for product/entity comparison.
Slide 19: This is an Area Chart slide for product/entity comparison.
Slide 20: This slide presents Donut Pie Chart. Add your parameters and use it.
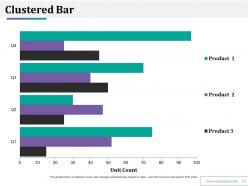
Slide 21: This slide shows a Bar Chart for two product comparison.
Slide 22: This slide presents Area Chart for comparing two of the products.
Slide 23: This slide presents a Radar Chart graph/chart. Compare Product 01, Product 02 and use as per required.
Slide 24: This slide is titled Additional slides to proceed forward
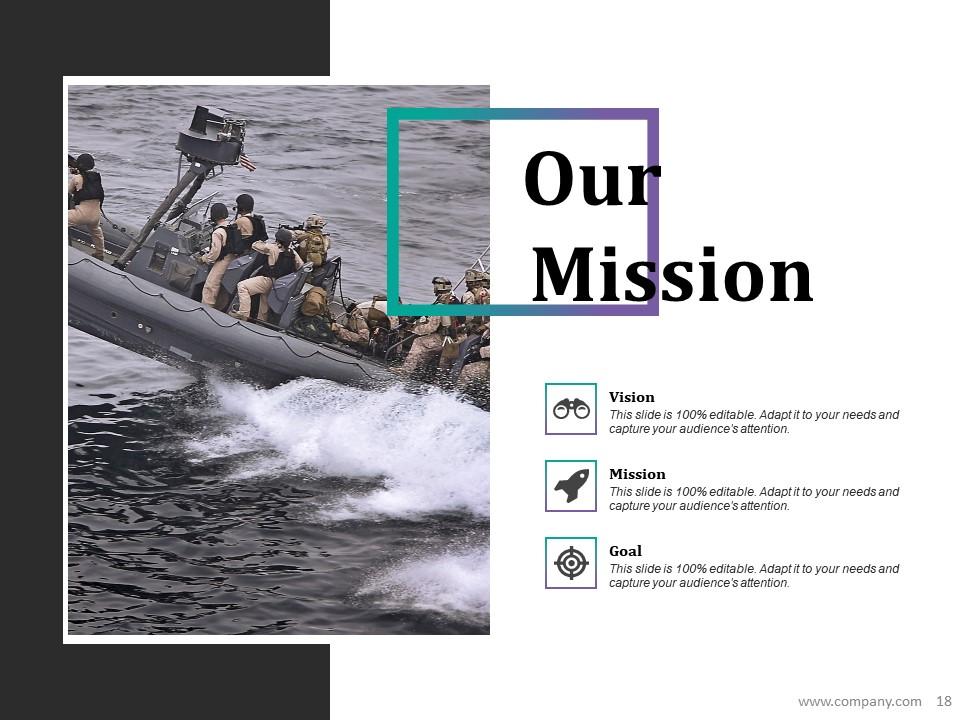
Slide 25: This is Our mission slide with imagery and text boxes to go with.
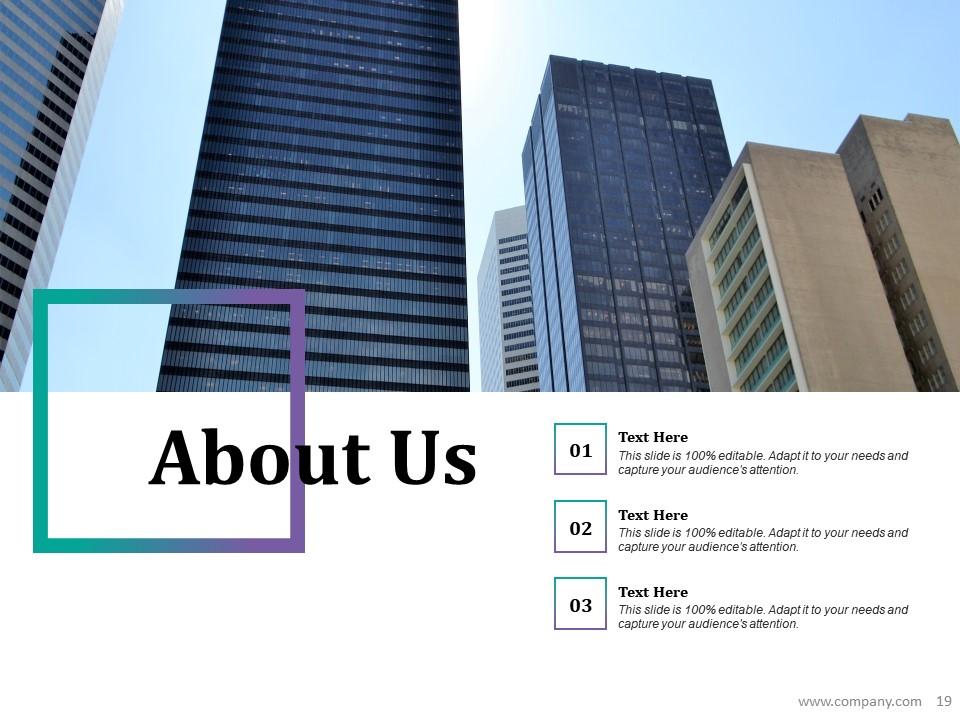
Slide 26: This is an About us slide to state company specifications etc.
Slide 27: This slide presents a Project Management Team with names and designation.
Slide 28: This is an Our Goal slide. State your important goals here.
Slide 29: This slide showcases comparison slide. You can use it to compare the men and women.
Slide 30: This slide presents Financial scores to display.
Slide 31: This is a Dashboard slide displaying- Revenue, Purchase Value, Units Sold.
Slide 32: This is a Quotes slide to convey message, beliefs etc.
Slide 33: This is a Timelines slide to show- Plan, Budget, Schedule, Review.
Slide 34: This is a Puzzle slide with the following subheadings- PPC Advertising, Media Marketing, Print Marketing, E-mail Campaigns.
Slide 35: This slide shows Target image with text boxes.
Slide 36: This is a Location slide to show global growth, presence etc. on world map.
Slide 37: This slide shows a Mind map for representing entities.
Slide 38: This is a Post it slide to mark reminders, events etc.
Slide 39: This is a Venn diagram image slide to show information, specifications etc.
Slide 40: This slide displays a Bulb or idea image.
Slide 41: This is a Thank You image slide with Address, Email and Contact number.
Company Evp Framework Powerpoint Presentation Slides with all 23 slides:
Our Company Evp Framework Powerpoint Presentation Slides contain a few comical images. It helps introduce the joke.
-
Best Representation of topics, really appreciable.
-
Informative presentations that are easily editable.


