Performance Management PowerPoint Templates, PPT Presentation & Slide Graphics
- Sub Categories
-
- 30 60 90 Day Plan
- About Us Company Details
- Action Plan
- Agenda
- Annual Report
- Audit Reports
- Balance Scorecard
- Brand Equity
- Business Case Study
- Business Communication Skills
- Business Plan Development
- Business Problem Solving
- Business Review
- Capital Budgeting
- Career Planning
- Change Management
- Color Palettes
- Communication Process
- Company Location
- Company Vision
- Compare
- Competitive Analysis
- Corporate Governance
- Cost Reduction Strategies
- Custom Business Slides
- Customer Service
- Dashboard
- Data Management
- Decision Making
- Digital Marketing Strategy
- Digital Transformation
- Disaster Management
- Diversity
- Equity Investment
- Financial Analysis
- Financial Services
- Financials
- Growth Hacking Strategy
- Human Resource Management
- Innovation Management
- Interview Process
- Knowledge Management
- Leadership
- Lean Manufacturing
- Legal Law Order
- Management
- Market Segmentation
- Marketing
- Media and Communication
- Meeting Planner
- Mergers and Acquisitions
- Metaverse
- Newspapers
- Operations and Logistics
- Organizational Structure
- Our Goals
- Performance Management
- Pitch Decks
- Pricing Strategies
- Process Management
- Product Development
- Product Launch Ideas
- Product Portfolio
- Project Management
- Purchasing Process
- Quality Assurance
- Quotes and Testimonials
- Real Estate
- Risk Management
- Sales Performance Plan
- Sales Review
- SEO
- Service Offering
- Six Sigma
- Social Media and Network
- Software Development
- Solution Architecture
- Stock Portfolio
- Strategic Management
- Strategic Planning
- Supply Chain Management
- Swimlanes
- System Architecture
- Team Introduction
- Testing and Validation
- Thanks-FAQ
- Time Management
- Timelines Roadmaps
- Value Chain Analysis
- Value Stream Mapping
- Workplace Ethic
-
 Improving Key Skills Required For Mobile App Marketing Campaign MKT SS V
The following slide presents various skills required by ad campaign manager to administer multiple tasks and convert digital customers. It includes elements such as analytical skills, budget management, search engine optimization SEO etc. Increase audience engagement and knowledge by dispensing information using Improving Key Skills Required For Mobile App Marketing Campaign MKT SS V. This template helps you present information on three stages. You can also present information on Useful Insights, Create Reports, Negotiate Terms using this PPT design. This layout is completely editable so personaize it now to meet your audiences expectations.
-
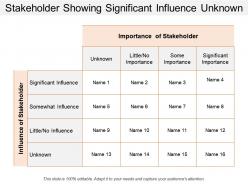 Stakeholder showing significant influence unknown
Presenting this set of slides with name - Stakeholder Showing Significant Influence Unknown. This is a four stage process. The stages in this process are Stakeholder Matrix, Stakeholder Analysis, Stakeholder Mapping.
-
 Earned value management icon process 3
Presenting this set of slides with name - Earned Value Management Icon Process 3. This is a three stage process. The stages in this process are Earned Value Management, Gained Value Management, Earned Value Performance Management.
-
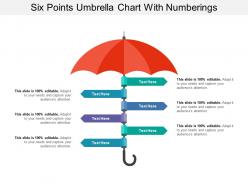 Six points umbrella chart with numberings
Presenting this set of slides with name - Six Points Umbrella Chart With Numberings. This is a six stage process. The stages in this process are Umbrella Chart, Umbrella Graph, Umbrella Statistics.
-
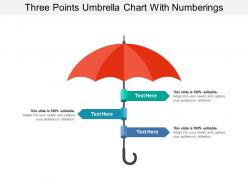 Three points umbrella chart with numberings
Presenting this set of slides with name - Three Points Umbrella Chart With Numberings. This is a three stage process. The stages in this process are Umbrella Chart, Umbrella Graph, Umbrella Statistics.
-
 Arrow pointing down 7 features
Presenting arrow pointing down 7 features. This is a arrow pointing down 7 features. This is a seven stage process. The stages in this process are arrow pointing down, download, downward sign.
-
 Blue molecule icon with white background
Presenting blue molecule icon with white background. This is a blue molecule icon with white background. This is a two stage process. The stages in this process are chemical formula icons, mathematical formula icons.
-
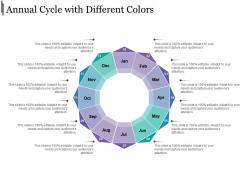 Annual cycle with different colors
Presenting this set of slides with name - Annual Cycle With Different Colors. This is a twelve stage process. The stages in this process are Annual Cycle, Annual Process, Annual Performance Review.
-
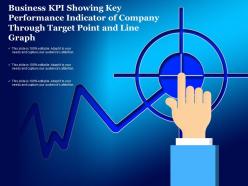 Business kpi showing key performance indicator of company through target point and line graph
Presenting this set of slides with name - Business Kpi Showing Key Performance Indicator Of Company Through Target Point And Line Graph. This is a three stage process. The stages in this process are Business Kpi, Business Dashboard, Business Metrics.
-
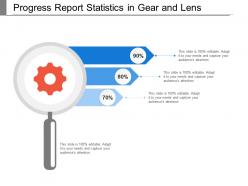 Progress report statistics in gear and lens
Presenting this set of slides with name - Progress Report Statistics In Gear And Lens. This is a three stage process. The stages in this process are Progress Report, Growth Report, Improvement Report.
-
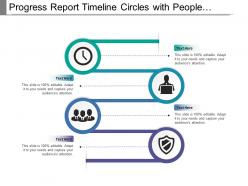 Progress report timeline circles with people and clock image
Presenting this set of slides with name - Progress Report Timeline Circles With People And Clock Image. This is a five stage process. The stages in this process are Progress Report, Growth Report, Improvement Report.
-
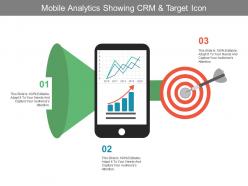 Mobile analytics showing crm and target icon
Presenting this set of slides with name - Mobile Analytics Showing Crm And Target Icon. This is a three stage process. The stages in this process are Mobile Analytics, Mobile Tracking, Mobile Web Analytics.
-
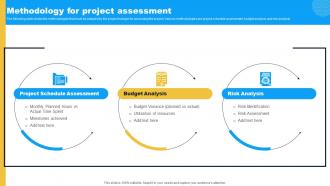 Methodology For Project Assessment Project Feasibility Assessment To Improve
The following slide shows the methodologies that must be adopted by the project manger for assessing the project. Various methodologies are project schedule assessment, budget analysis and risk analysis.Introducing Methodology For Project Assessment Project Feasibility Assessment To Improve to increase your presentation threshold. Encompassed with three stages, this template is a great option to educate and entice your audience. Dispence information on Schedule Assessment, Budget Analysis, Risk Analysis, using this template. Grab it now to reap its full benefits.
-
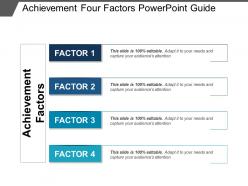 Achievement four factors powerpoint guide
Presenting achievement four factors powerpoint guide. This is a achievement four factors powerpoint guide. This is a four stage process. The stages in this process are winner, accomplishment, achievement.
-
 7 factors with checklist and tickmark performance icon
Presenting 7 Factors With Checklist And Tickmark Performance Icon which is designed by our professionals for your convenience. You can save your presentation in various formats like PDF, JPG and PNG. Change the colors, fonts, font size, and font types as per your business requirement. It is available in both 4:3 and 16:9 aspect ratio. This template is adaptable with Google Slides which makes it easily accessible at once.
-
 Performance 6 steps checklist magnifying glass icon
Presenting Performance 6 Steps Checklist Magnifying Glass Icon. Get this template that completely works on your command. Add a suitable icon in the middle of the circle and adjust the size of the layout accordingly. You can modify the color, font size, font type according to your presentation theme. This slide is made up of high-resolution graphics that offers you high-quality images. It can be downloaded in JPG and PDF formats. Download this slide in both the standard screen and widescreen aspect ratios.
-
 Business highlights with magnifying glass icon
Presenting this set of slides with name - Business Highlights With Magnifying Glass Icon. This is a one stage process. The stages in this process are Highlights, High Point, High Spot.
-
 Performance Efficiency Administration In Energy Sector Powerpoint Presentation Slides
Presenting this set of slides with name - Performance Efficiency Administration In Energy Sector Powerpoint Presentation Slides. This aptly crafted editable PPT deck contains thirty-three slides. Our topic-specific Performance Efficiency Administration In Energy Sector Powerpoint Presentation Slides presentation deck helps devise the topic with a clear approach. We offer a wide range of custom made slides with all sorts of relevant charts and graphs, overviews, topics subtopics templates, and analysis templates. Download PowerPoint templates in both widescreen and standard screen. The presentation is fully supported by Google Slides. It can be easily converted into JPG or PDF format.
-
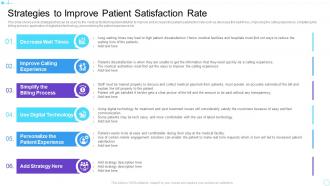 Strategies to improve patient satisfaction rate ppt slides outline
This slide shows some strategies that can be used by the medical facility hospital institution to improve and increase the patient satisfaction rate such as decrease the wait times, improving the calling experience, simplifying the billing process, application of digitalized technology, personalizing the patient experience etc. Increase audience engagement and knowledge by dispensing information using Strategies To Improve Patient Satisfaction Rate Ppt Slides Outline. This template helps you present information on six stages. You can also present information on Decrease Wait Times, Improve Calling Experience, Billing Process, Use Digital Technology, Patient Experience using this PPT design. This layout is completely editable so personaize it now to meet your audiences expectations.
-
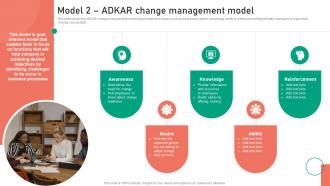 Model 2 Adkar Change Management Model Change Management Approaches
This slide shows the ADKAR change management model that includes five stages such as awareness, desire, knowledge, ability and reinforcement that will help managers to implement change successfully.Introducing Model 2 Adkar Change Management Model Change Management Approaches to increase your presentation threshold. Encompassed with five stages, this template is a great option to educate and entice your audience. Dispence information on Business Processes, Identifying Challenges, Achieving Desired, using this template. Grab it now to reap its full benefits.
-
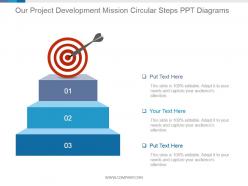 Our project development mission circular steps ppt diagrams
Presenting our project development mission circular steps ppt diagrams. This is a our project development mission circular steps ppt diagrams. This is a three stage process. The stages in this process are business, marketing, target, mission, goal, management.
-
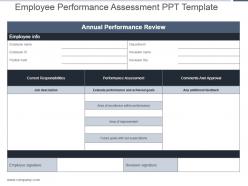 Employee performance assessment ppt template
Presenting employee performance assessment ppt template. This is a employee performance assessment ppt template. This is a three stage process. The stages in this process are current responsibilities, performance assessment, comments and approval, future goals with set expectations.
-
 Tax benefits icon powerpoint slide ideas
Presenting tax benefits icon PowerPoint slide ideas PPT slide. The smartly crafted PowerPoint visuals are hundred percent editable and so are customizable as per the need of an individual. One can easily modify the color scheme, fonts text, layout, and orientation as per the need. Also, the slide is compatible with numerous format options and software options too. There is the use of high-resolution graphics which can either be used as it is or posts some modification.
-
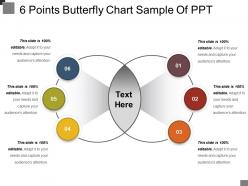 6 points butterfly chart sample of ppt
Presenting 6 points butterfly chart sample of ppt. This is a 6 points butterfly chart sample of ppt. This is a six stage process. The stages in this process are butterfly chart, butterfly graph.
-
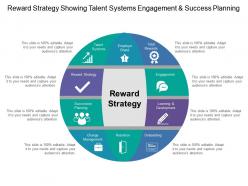 Reward strategy showing talent systems engagement and success planning
Presenting this set of slides with name - Reward Strategy Showing Talent Systems Engagement And Success Planning. This is a four stage process. The stages in this process are Reward Strategy, Reward Plan, Incentive Strategy.
-
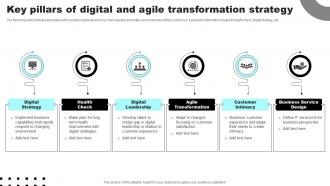 Key Pillars Of Digital And Agile Transformation Strategy
The following slide exhibits parameters which enable organizations to be more reactive and better serve interests of their customers. It presents information related to health check, digital strategy, etc.Presenting our set of slides with Key Pillars Of Digital And Agile Transformation Strategy. This exhibits information on six stages of the process. This is an easy to edit and innovatively designed PowerPoint template. So download immediately and highlight information on Digital Strategy, Digital Leadership, Agile Transformation.
-
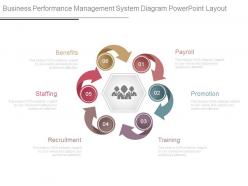 Business performance management system diagram powerpoint layout
Presenting business performance management system diagram powerpoint layout. This is a business performance management system diagram powerpoint layout. This is a six stage process. The stages in this process are payroll, promotion, training, recruitment, staffing, benefits.
-
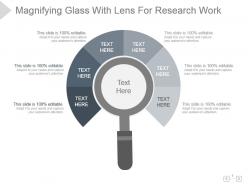 Magnifying glass with lens for research work presentation diagram
Presenting magnifying glass with lens for research work presentation diagram. Presenting magnifying glass with lens for research work presentation diagram. This is a magnifying glass with lens for research work presentation diagram. This is a six stage process. The stages in this process are magnifying glass, lens, research work, strategy, management, technology.
-
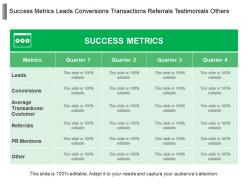 Success Metrics Leads Conversions Transactions Referrals Testimonials
Presenting this set of slides with name - Success Metrics Leads Conversions Transactions Referrals Testimonials Others. This is a four stage process. The stages in this process are Success Metrics, Key Performance Indicators, Scorecards.
-
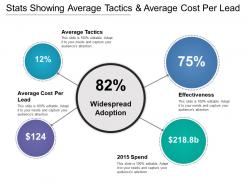 Stats showing average tactics and average cost per lead
Presenting this set of slides with name - Stats Showing Average Tactics And Average Cost Per Lead. This is a four stage process. The stages in this process are Stats, Statistics, Data.
-
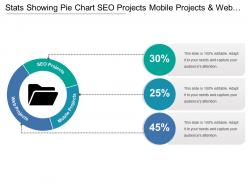 Stats showing pie chart seo projects mobile projects and web projects
Presenting this set of slides with name - Stats Showing Pie Chart Seo Projects Mobile Projects And Web Projects. This is a three stage process. The stages in this process are Stats, Statistics, Data.
-
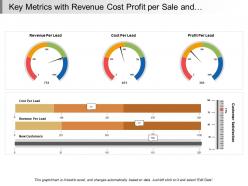 Key metrics with revenue cost profit per sale and customer satisfaction
Presenting this set of slides with name - Key Metrics With Revenue Cost Profit Per Sale And Customer Satisfaction. This is a three stage process. The stages in this process are Key Metrics, Key Performance Indicator, Kpi.
-
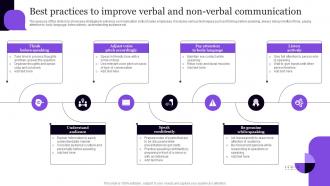 Best Practices To Improve Verbal And Non Verbal Communication
The purpose of this slide is to showcase strategies to enhance communication skills of sales employees. It includes various techniques such as thinking before speaking, always being mindful of tone, paying attention to body language, listen actively, understanding audience etc.Introducing our premium set of slides with Best Practices To Improve Verbal And Non Verbal Communication. Ellicudate the seven stages and present information using this PPT slide. This is a completely adaptable PowerPoint template design that can be used to interpret topics like Adjust Voice Pitch Accordingly, Listen Actively, Speak Confidently. So download instantly and tailor it with your information.
-
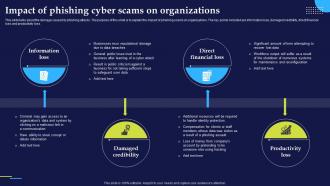 Impact Of Phishing Cyber Scams On Phishing Attacks And Strategies
This slide talks about the damage caused by phishing attacks. The purpose of this slide is to explain the impact of phishing scams on organizations. The key points included are information loss, damaged credibility, direct financial loss and productivity loss.Increase audience engagement and knowledge by dispensing information using Impact Of Phishing Cyber Scams On Phishing Attacks And Strategies. This template helps you present information on six stages. You can also present information on Businesses Incur Reputational, Phishing Assault, Maintenance Reconfiguration using this PPT design. This layout is completely editable so personaize it now to meet your audiences expectations.
-
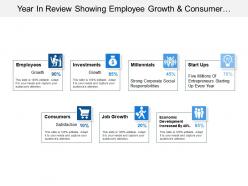 Year in review showing employee growth and consumer satisfaction
Presenting this set of slides with name - Year In Review Showing Employee Growth And Consumer Satisfaction. This is a seven stage process. The stages in this process are Year In Review, Yearly Highlights, Countdowns.
-
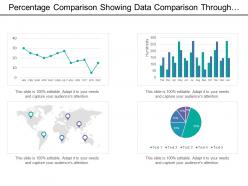 Percentage comparison showing data comparison through bar graph and line graph
Presenting this set of slides with name - Percentage Comparison Showing Data Comparison Through Bar Graph And Line Graph. This is a four stage process. The stages in this process are Percentage Comparison, Percentage Compare, Percentage Balancing.
-
 Five points umbrella chart with numberings
Presenting this set of slides with name - Five Points Umbrella Chart With Numberings. This is a five stage process. The stages in this process are Umbrella Chart, Umbrella Graph, Umbrella Statistics.
-
 Four points umbrella chart with numberings
Presenting this set of slides with name - Four Points Umbrella Chart With Numberings. This is a four stage process. The stages in this process are Umbrella Chart, Umbrella Graph, Umbrella Statistics.
-
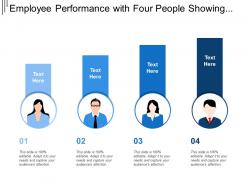 Employee performance with four people showing graphs
Presenting this set of slides with name - Employee Performance With Four People Showing Graphs. This is a four stage process. The stages in this process are Employee Performance, Employee Engagement, Employee Evaluation.
-
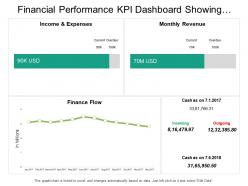 Financial performance kpi dashboard showing income expenses monthly revenue
Presenting this set of slides with name - Financial Performance Kpi Dashboard Showing Income Expenses Monthly Revenue. This is a four stage process. The stages in this process are Financial Performance, Financial Report, Financial Review.
-
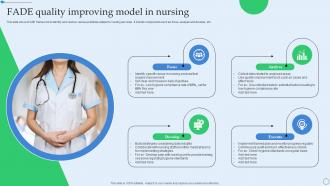 FADE Quality Improving Model In Nursing
This slide shows FADE framework to identify and resolve various problems related to nursing services . It include components such as focus, analyse and develop, etc.Presenting our set of slides with FADE Quality Improving Model In Nursing. This exhibits information on four stages of the process. This is an easy to edit and innovatively designed PowerPoint template. So download immediately and highlight information on Require Improvement, Bale Objectives, Strategies Considering.
-
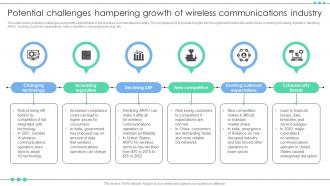 Potential Challenges Hampering Growth Of Wireless Communications Industry FIO SS
This slide covers potential challenges and growth opportunities in the wireless communications industry. This template aims to provide insights into the significant hurdles the sector faces, including increasing regulation, declining ARPU, evolving customer expectations, new competition, changing technology, etc.Introducing our premium set of slides with Potential Challenges Hampering Growth Of Wireless Communications Industry FIO SS. Ellicudate the six stages and present information using this PPT slide. This is a completely adaptable PowerPoint template design that can be used to interpret topics like Changing Technology, Increasing Regulation, Evolving Customer. So download instantly and tailor it with your information.
-
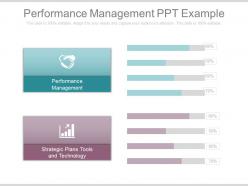 Performance management ppt example
This PowerPoint template is a modern way to represent performance management of your organization through a presentation. You can easily alter the text by editing it in PowerPoint software and include your company logo. You can change the color of the block diagram shown in the figure and choose it according to your liking. Use it in full screen mode after downloading. The stages in this process are performance management, strategic plans tools and technology.
-
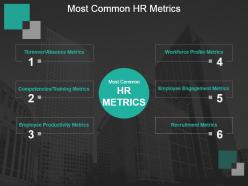 Most common hr metrics powerpoint slide introduction
Presenting most common hr metrics powerpoint slide introduction. This is a most common hr metrics powerpoint slide introduction. This is a six stage process. The stages in this process are turnover absence metrics, competencies training metrics, employee productivity metrics, workforce profile metrics, employee engagement metrics, recruitment metrics.
-
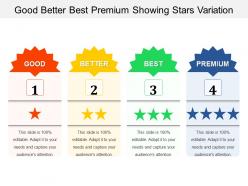 Good better best premium showing stars variation
Presenting this set of slides with name - Good Better Best Premium Showing Stars Variation. This is a four stage process. The stages in this process are Good Better Best, Good Great Superb, Good Great Excellent.
-
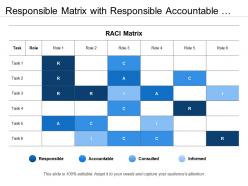 Responsible matrix with responsible accountable consulted informed
Presenting this set of slides with name - Responsible Matrix With Responsible Accountable Consulted Informed. This is a six stage process. The stages in this process are Responsibility Matrix, Authority Matrix, Leadership Matrix.
-
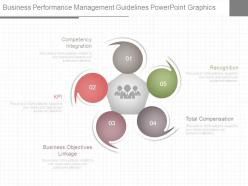 Business performance management guidelines powerpoint graphics
Presenting business performance management guidelines powerpoint graphics. This is a business performance management guidelines powerpoint graphics. This is a five stage process. The stages in this process are recognition, total compensation, business objectives linkage, kpi, competency integration.
-
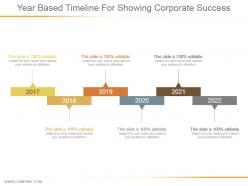 Year based timeline for showing corporate success ppt summary
Presenting year based timeline for showing corporate success ppt summary. This is a year based timeline for showing corporate success ppt summary. This is a six stage process. The stages in this process are planning, business, marketing, years, success.
-
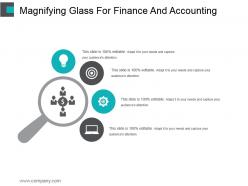 Magnifying glass for finance and accounting ppt slide
Presenting magnifying glass for finance and accounting ppt slide. This is a magnifying glass for finance and accounting ppt slide. This is a four stage process. The stages in this process are icons, magnify, search, strategy, finance.
-
 Performance review process best practices infographic ppt templates
Presenting performance review process best practices infographic PPT template PPT slides. The visuals available in the PowerPoint leave a long term impact on viewers. The users of PPT can change the color theme, text and font. Presentation is compatible with software options, formats, and Google Slides. The visuals used are of high resolution and do not deter in quality irrespective of the screen size. Link is easy to download. This PPT is of much use to management students, teachers, and business professionals.
-
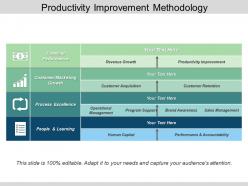 Productivity improvement methodology powerpoint show
Presenting productivity improvement methodology PowerPoint show PPT slide. This PPT is compatible with Google Slides, multiple software options, and format options too. One can easily edit this pre-designed template and save his/her time in coming up with the final result. Editing this slide is very easy for any individual using it. If assistance is needed one can always refer to the editing instructions provided along. The slide is designed with high-resolution graphics to ensure that the presenter does not compromise with visual quality while projecting the slide on widescreen.
-
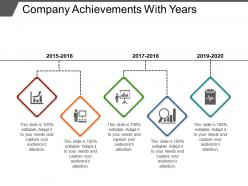 Company achievements with years powerpoint show
Presenting Company Achievements With Years PowerPoint Show. You can change the shape and size of the diagram as this slide is 100% editable. The template is adaptable with Google Slides which makes it easily accessible at once. Can be converted into various formats like PDF, JPG, and PNG. It is available in both standard and widescreen. You can alter the color, fonts, font size, and font types of the slides as per your needs.
-
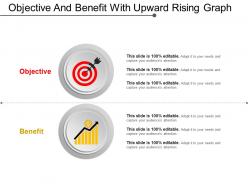 Objective and benefit with upward rising graph powerpoint ideas
Presenting Objective And Benefit With Upward Rising Graph PowerPoint Ideas which is fully editable. You can customize the color, font, font size, and font types of the template as per the requirement. Can be changed into formats like PDF, JPG, and PNG. The slide is available in both standard and widescreen. It is compatible with Google Slides which makes it accessible at once. You can insert your brand logo in the template.
-
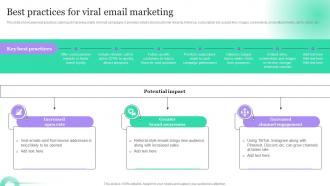 Best Practices For Viral Email Marketing Hosting Viral Social Media Campaigns
This slide showcases best practices catering at improving virality of email campaigns. It provides details about customer rewards, follow up, subscription list, subject line, images, screenshots, email attachments, calltoaction, etc.Introducing Best Practices For Viral Email Marketing Hosting Viral Social Media Campaigns to increase your presentation threshold. Encompassed with three stages, this template is a great option to educate and entice your audience. Dispence information on Greater Brand Awareness, Channel Engagement, Increased Open Rate, using this template. Grab it now to reap its full benefits.
-
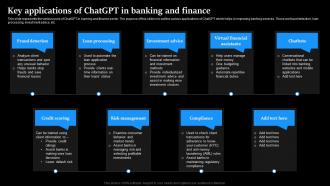 Key Applications Of ChatGPT In Banking And Finance Regenerative Ai
This slide represents the various uses of ChatGPT in banking and finance sector. The purpose of this slide is to outline various applications of ChatGPT which helps in improving banking services. These are fraud detection, loan processing, investment advice, etc.Introducing Key Applications Of ChatGPT In Banking And Finance Regenerative Ai to increase your presentation threshold. Encompassed with nine stages, this template is a great option to educate and entice your audience. Dispence information on Loan Processing, Investment Advice, Virtual Financial Assistants, using this template. Grab it now to reap its full benefits.
-
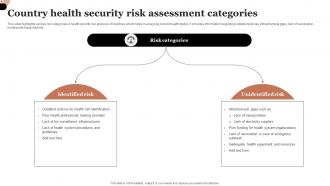 Country Health Security Risk Assessment Categories
This slide highlights various risk categories in health security risk analysis of countries which helps in analyzing current health status. It provides information regarding outdated policies, infrastructural gaps, lack of vaccination , inadequate equipment etc.Introducing our premium set of slides with Country Health Security Risk Assessment Categories. Ellicudate the two stages and present information using this PPT slide. This is a completely adaptable PowerPoint template design that can be used to interpret topics like Surveillance Infrastructures, Outdated Policies, Inadequate Health. So download instantly and tailor it with your information.
-
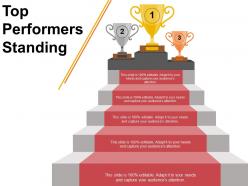 Top performers standing ppt inspiration
Presenting top performers standing PPT inspiration business presentation which is thoroughly editable and is equipped with all that is needed by you to make an overall effective presentation. It has been designed professionally and can be edited according to the presenter’s needs and preferences. This PowerPoint shape is flexible with Google Slides and compatible with multiple softwares and format options. Often used by sales team head, human resource team, business managers and students.
-
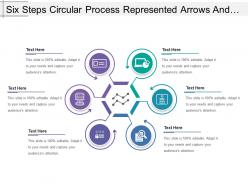 Six steps circular process represented arrows and text boxes
Presenting this set of slides with name - Six Steps Circular Process Represented Arrows And Text Boxes. This is a six stage process. The stages in this process are Analytics Architecture, Analytics Framework, Data Analysis.
-
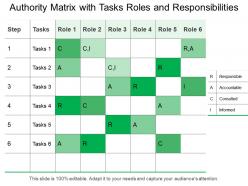 Authority matrix with tasks roles and responsibilities
Presenting this set of slides with name - Authority Matrix With Tasks Roles And Responsibilities. This is a six stage process. The stages in this process areAuthority Matrix, Command Matrix, Power Matrix.
-
 Interview icon showing interviewer with respondent sitting around table
Presenting this set of slides with name - Interview Icon Showing Interviewer With Respondent Sitting Around Table. This is a two stage process. The stages in this process are Interview Icon, Meeting Icon, Discussion Icon.


