Six sigma strategy and methodology powerpoint presentation with slides
A stunning six sigma strategy and methodology complete PowerPoint slide deck and that too entirely pre built is now a mere click away. To get most of this PowerPoint show here we are sharing few tips. You can use this PPT example to share insights about quality management process adopted to improve your business processes. A pictorial explanation of six sigma methodology or six sigma techniques helps to motivate employees for improving quality and reduce defects. Best part is that, with help of our presentation deck a symbolic message of zero defect manufacturing can be depicted so as to build faith among investors and partners. Apart from this, using our PPT example you can depict various other concepts like statistical quality control, process capability, six sigma principles, six sigma tools and many more. That's not all as our exclusive presentation designs like the DAMIC process, voice of customer, KANO analysis, project charter etc. are included turning our deck into dream pictorial symphony. In short, don't waste your time to scratch internet. Just download and get started now! Chart out their development with our Six Sigma Strategy And Methodology Complete Powerpoint Deck With Slides. Communicate the great benefits that are bound to accrue.
- Google Slides is a new FREE Presentation software from Google.
- All our content is 100% compatible with Google Slides.
- Just download our designs, and upload them to Google Slides and they will work automatically.
- Amaze your audience with SlideTeam and Google Slides.
-
Want Changes to This PPT Slide? Check out our Presentation Design Services
- WideScreen Aspect ratio is becoming a very popular format. When you download this product, the downloaded ZIP will contain this product in both standard and widescreen format.
-

- Some older products that we have may only be in standard format, but they can easily be converted to widescreen.
- To do this, please open the SlideTeam product in Powerpoint, and go to
- Design ( On the top bar) -> Page Setup -> and select "On-screen Show (16:9)” in the drop down for "Slides Sized for".
- The slide or theme will change to widescreen, and all graphics will adjust automatically. You can similarly convert our content to any other desired screen aspect ratio.
Compatible With Google Slides

Get This In WideScreen
You must be logged in to download this presentation.
PowerPoint presentation slides
Total 61 PPT templates making it a utterly complete deck. Best for quality managers, industrial engineers and productions managers. No limited space to insert text, titles and subtitles. 100 % original and high res presentation images. Manual editing option given with all templates slides. Works perfectly with all sorts of software's . Graphical and tabular formats used for easy comprehension. Quick downloading process. The stages in this process are six sigma process, strategic management, six sigma strategic planning, six sigma methodologies.
People who downloaded this PowerPoint presentation also viewed the following :
Content of this Powerpoint Presentation
Slide 1: This slide introduces Six Sigma Strategy & Methodology. State Your Company Name and get started.
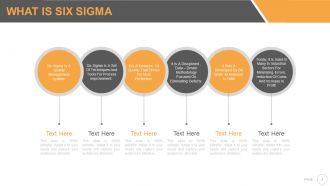
Slide 2: This slide showcases What is Six Sigma with the following content- Six sigma is a quality management system. Six sigma is a set of techniques and tools for process improvement. It is a measure of quality that strives for near perfection. It is a disciplined , data – driven methodology focused on eliminating defects. It was a developed by bill smith at Motorola in 1986 To day, it is used in many in industrial sectors for minimizing errors, reduction of costs and increase in profit.
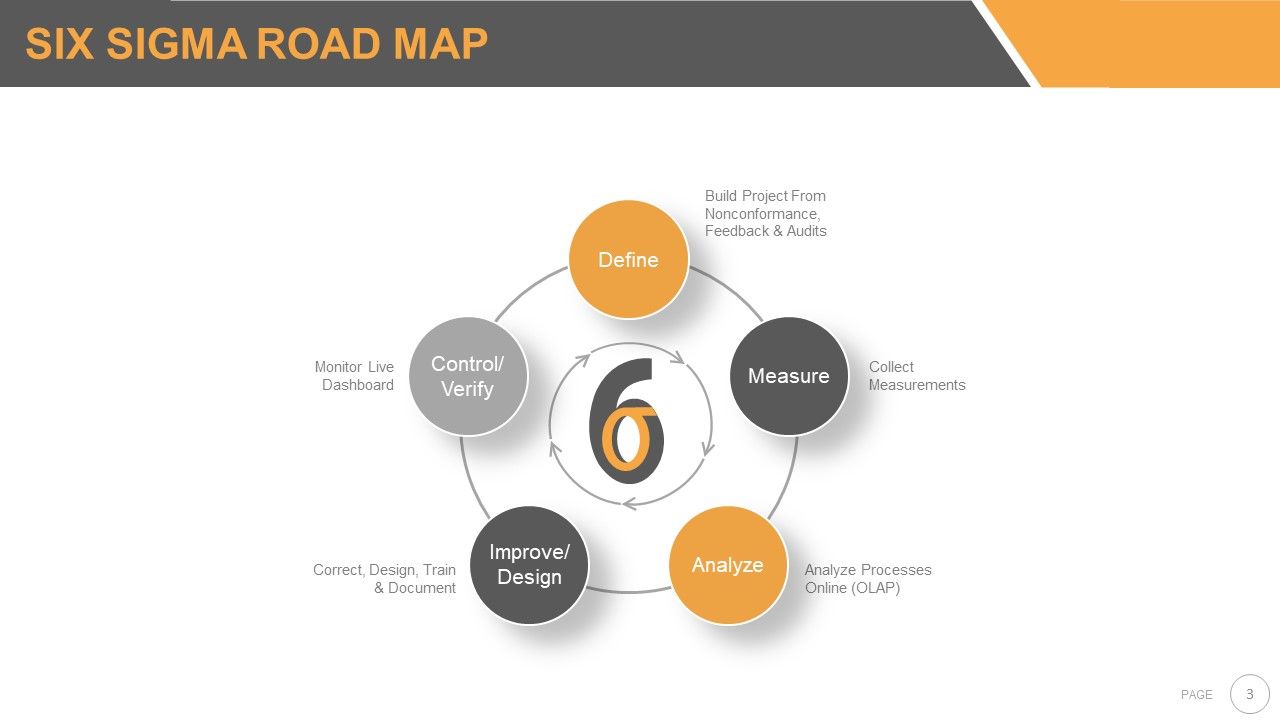
Slide 3: This slide shows a Six Sigma Road map with the following subheadings- Build Project From Non-conformance, Feedback & Audits, Monitor Live Dashboard, Collect Measurements, Correct, Design, Train & Document, Analyze Processes Online (OLAP) as Define, Measure, Analyze, Improve/Design, Control/Verify.
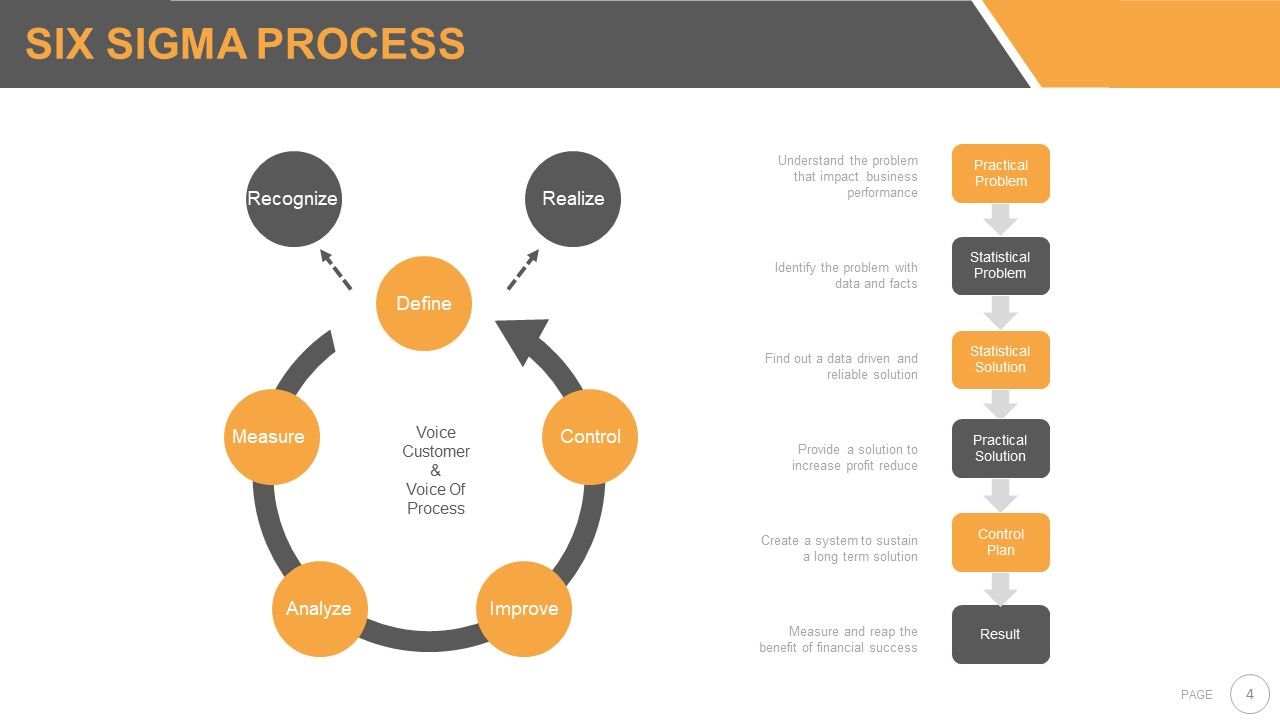
Slide 4: This slide presents the Six Sigma Process with the following content- Practical Problem: Understand the problem that impact business performance. Statistical Problem: Identify the problem with data and facts Statistical Solution: Find out a data driven and reliable solution Practical Solution: Provide a solution to increase profit reduce Control Plan: Create a system to sustain a long term solution Result: Measure and reap the benefit of financial success as Recognize, Realize, Measure, Analyze, Control, Improve, Define, Voice Customer, & Voice Of Process.
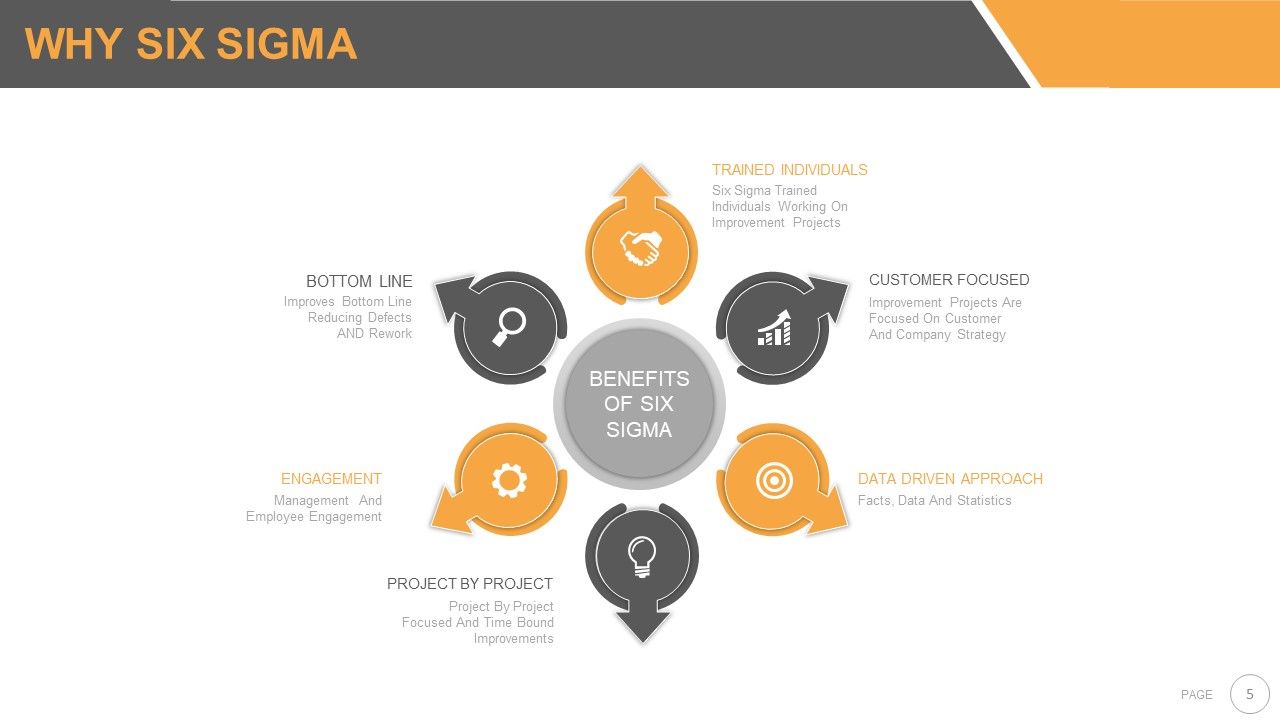
Slide 5: This slide shows WHY SIX SIGMA with the following subheading Benefits Of Six Sigma divided into- Customer Focused, Data Driven Approach, Bottom Line, Engagement, Trained Individuals, Project By Project.
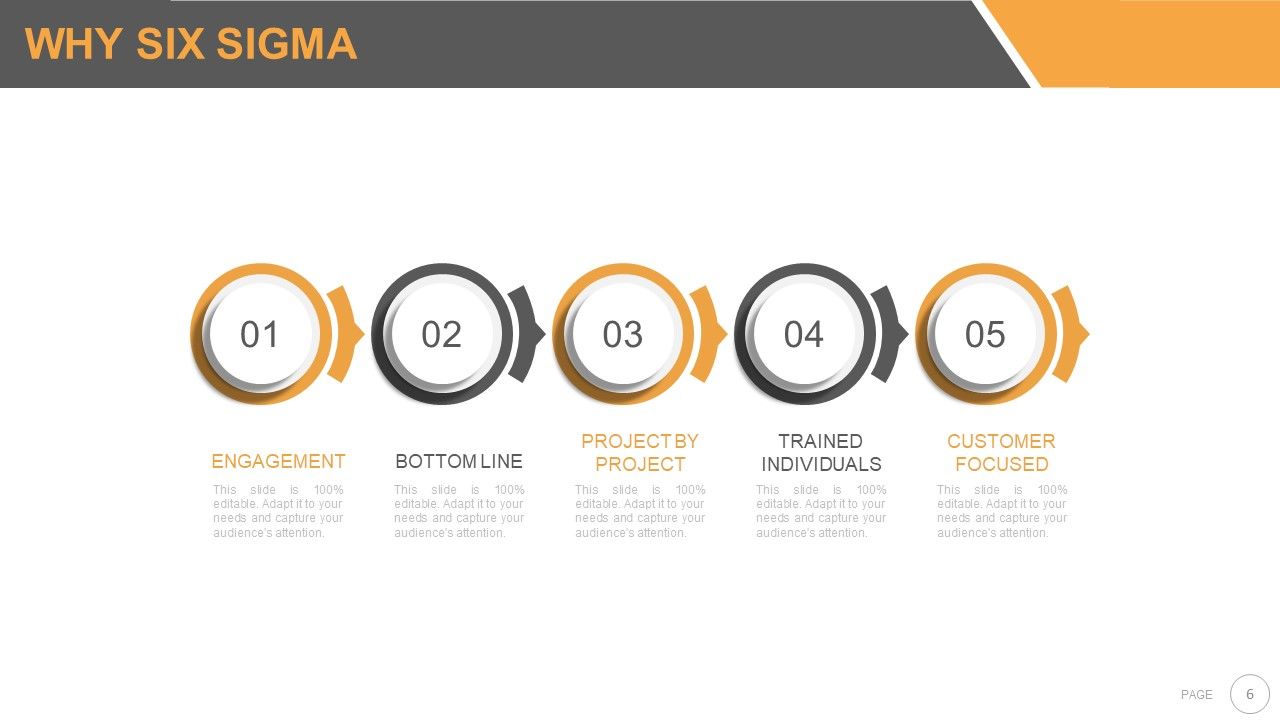
Slide 6: This slide shows WHY SIX SIGMA with the following subheadings- Customer Focused, Data Driven Approach, Bottom Line, Engagement, Trained Individuals, Project By Project.
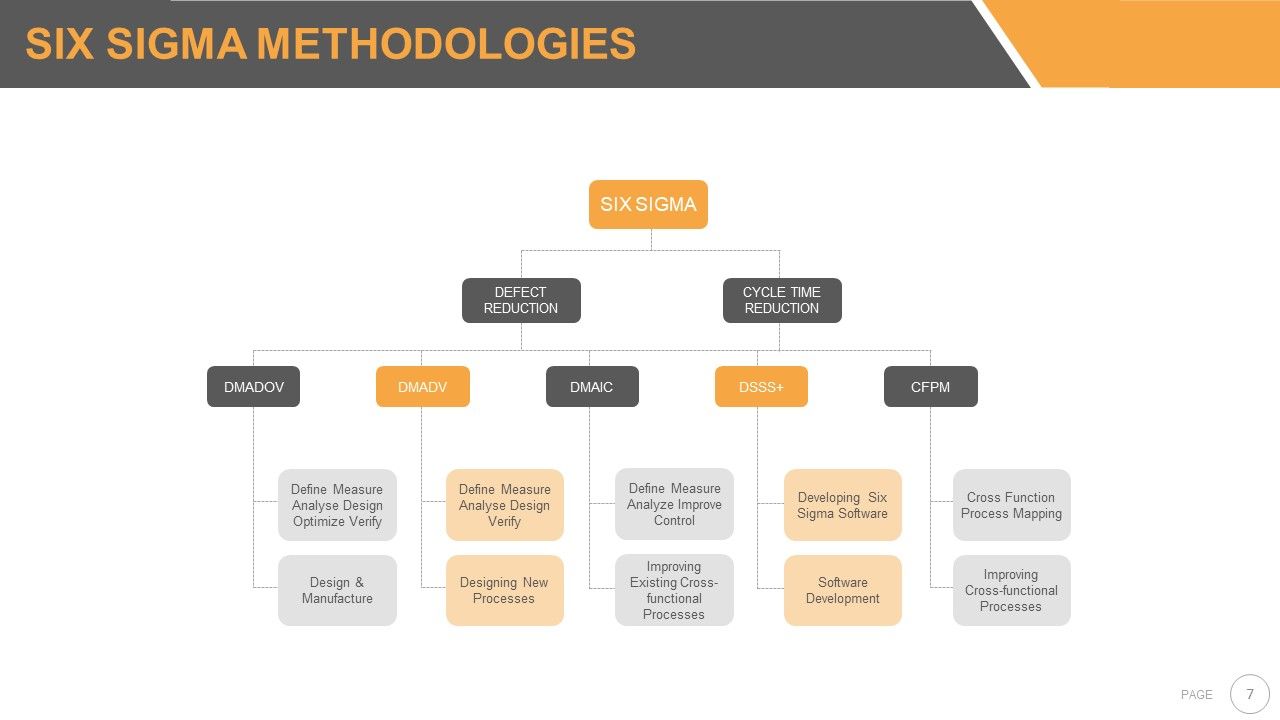
Slide 7: This slide shows Six Sigma Methodologies showing- Defect Reduction, Cycle Time Reduction, CFPM, DSSS+ DMAIC, DMADV, DMADOV, Design & Manufacture, Designing New Processes, Improving Existing Cross-functional Processes, Software Development, Improving Cross-functional Processes, Cross Function Process Mapping, Developing Six Sigma Software, Define Measure Analyze Design Verify, Define Measure Analyze Design Optimize Verify, Define Measure Analyze Improve Control.
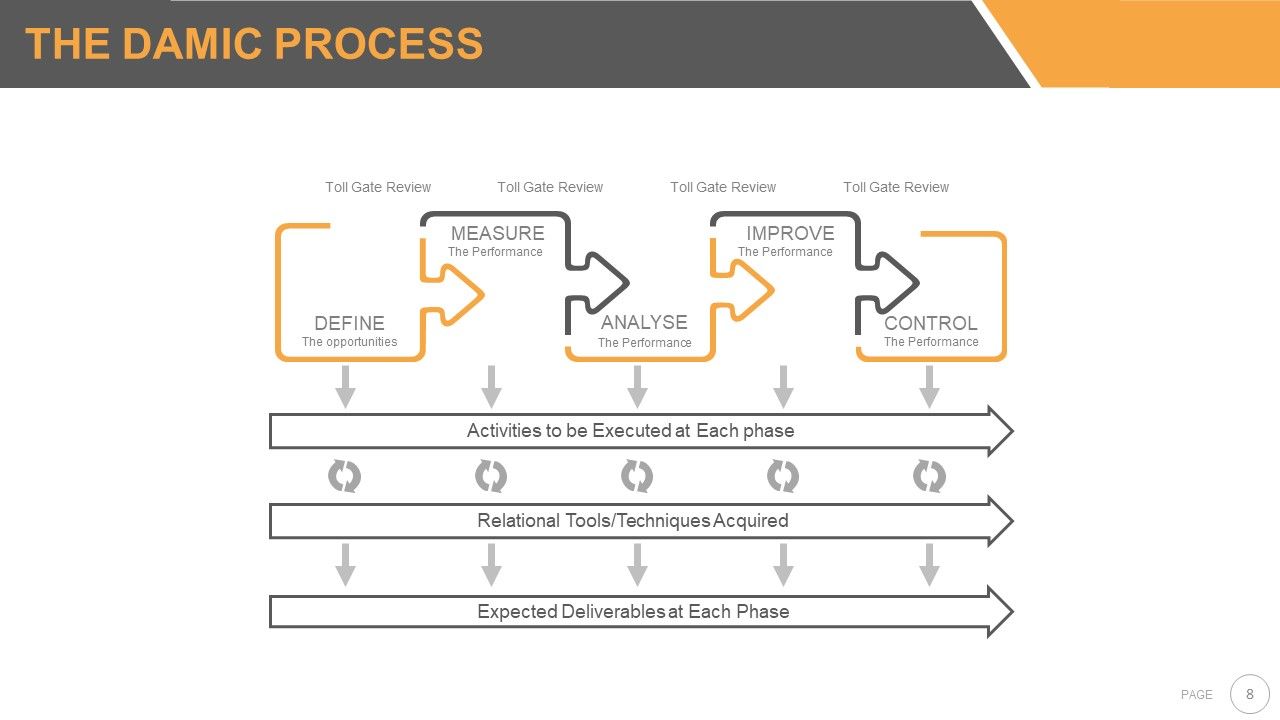
Slide 8: This slide showcases the DMAIC Process showcasing- Relational Tools/Techniques Acquired Expected Deliverables at Each Phase Activities To Be Executed At Each Phase DEFINE: The opportunities MEASURE: The Performance ANALYSE: The Performance IMPROVE: The Performance CONTROL: The Performance and Toll Gate Review.
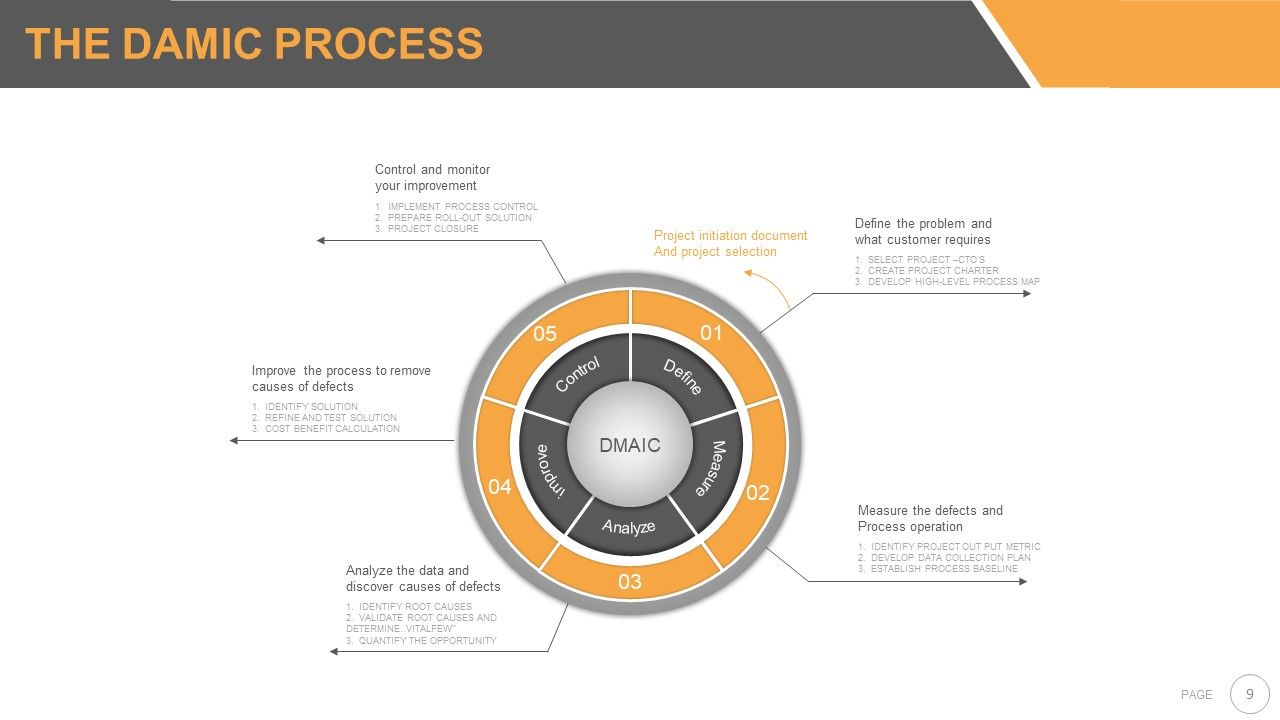
Slide 9: This slide presents The DMAIC Process showing- Project initiation document And project selection Define The Problem And What Customer Requires 1. SELECT PROJECT –CTO’S 2. CREATE PROJECT CHARTER 3. DEVELOP HIGH-LEVEL PROCESS MAP Measure The Defects And Process Operation 1. IDENTIFY PROJECT OUT PUT METRIC 2. DEVELOP DATA COLLECTION PLAN 3. ESTABLISH PROCESS BASELINE Analyze The Data And Discover Causes Of Defects 1. IDENTIFY ROOT CAUSES 2. VALIDATE ROOT CAUSES AND DETERMINE..VITALFEW’’ 3. QUANTIFY THE OPPORTUNITY Improve The Process To Remove Causes Of Defects 1. IDENTIFY SOLUTION 2. REFINE AND TEST SOLUTION 3. COST BENEFIT CALCULATION Control And Monitor Your Improvement 1. IMPLEMENT PROCESS CONTROL 2. PREPARE ROLL-OUT SOLUTION 3. PROJECT CLOSURE Define, Measure, Analyze, improve, Control.
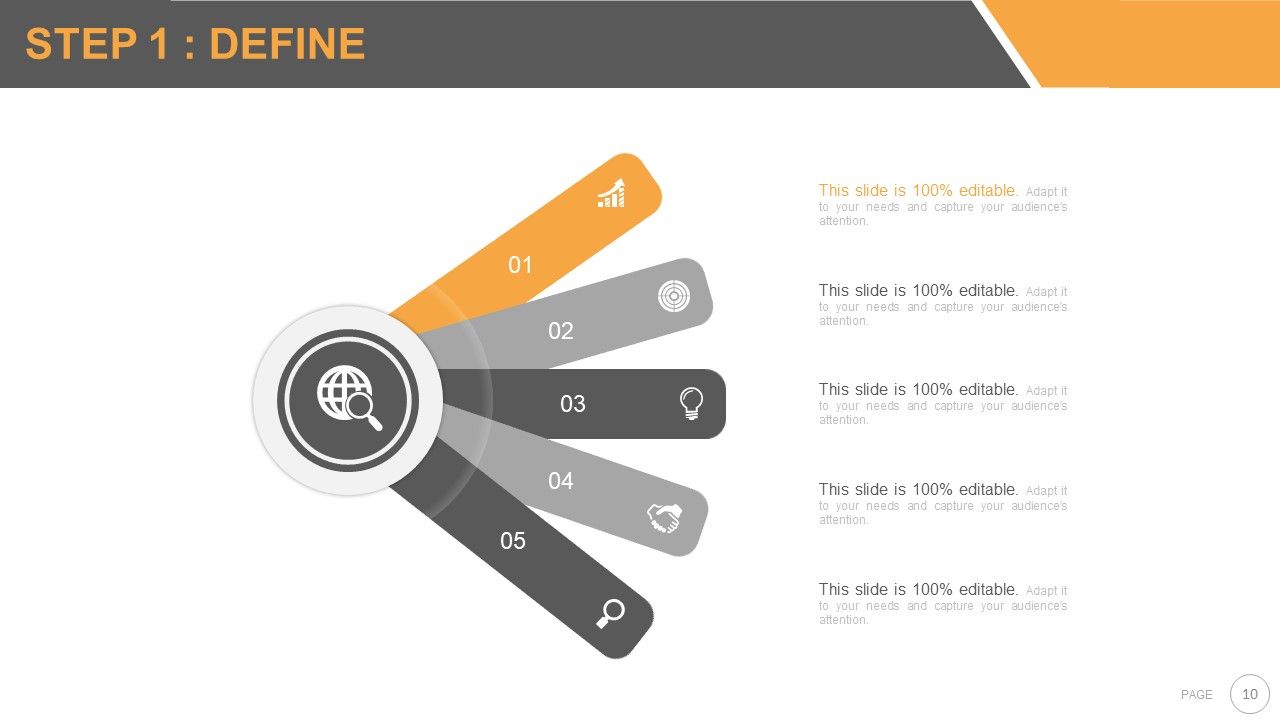
Slide 10: This slide elaborates STEP 1: DEFINE.
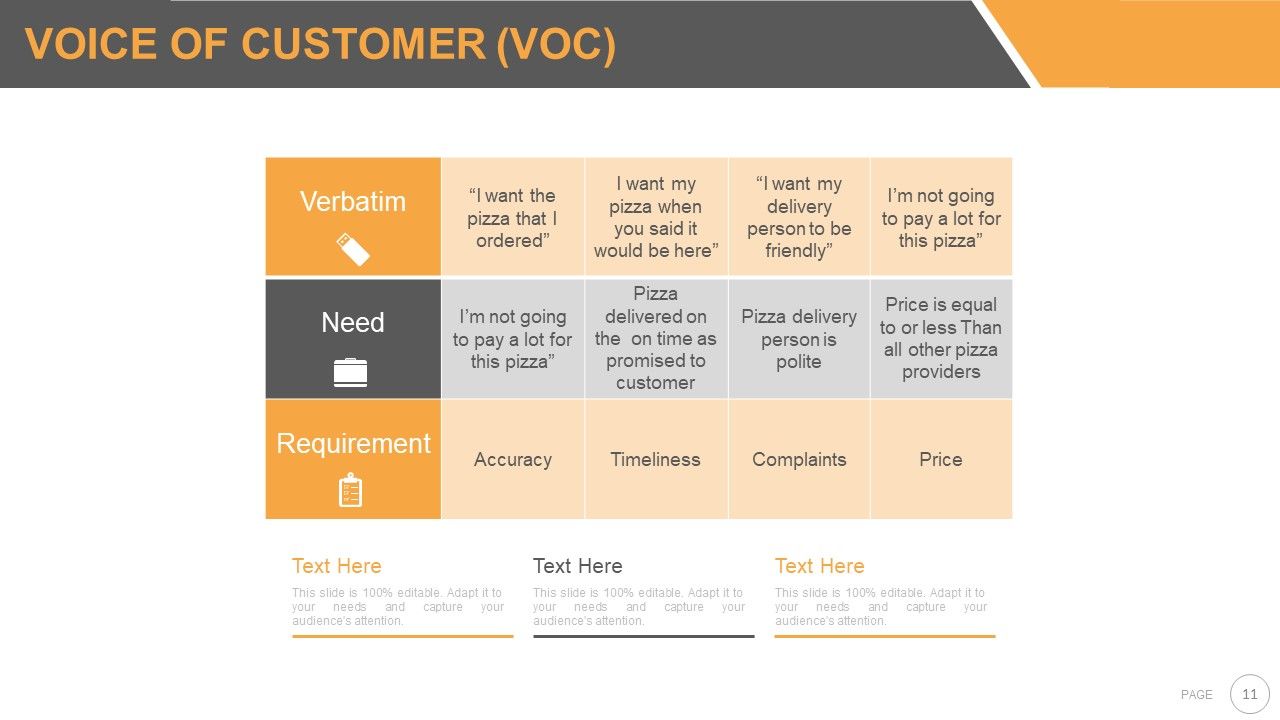
Slide 11: This slide presents the Voice Of Customer with- Need, Requirement, Verbatim.
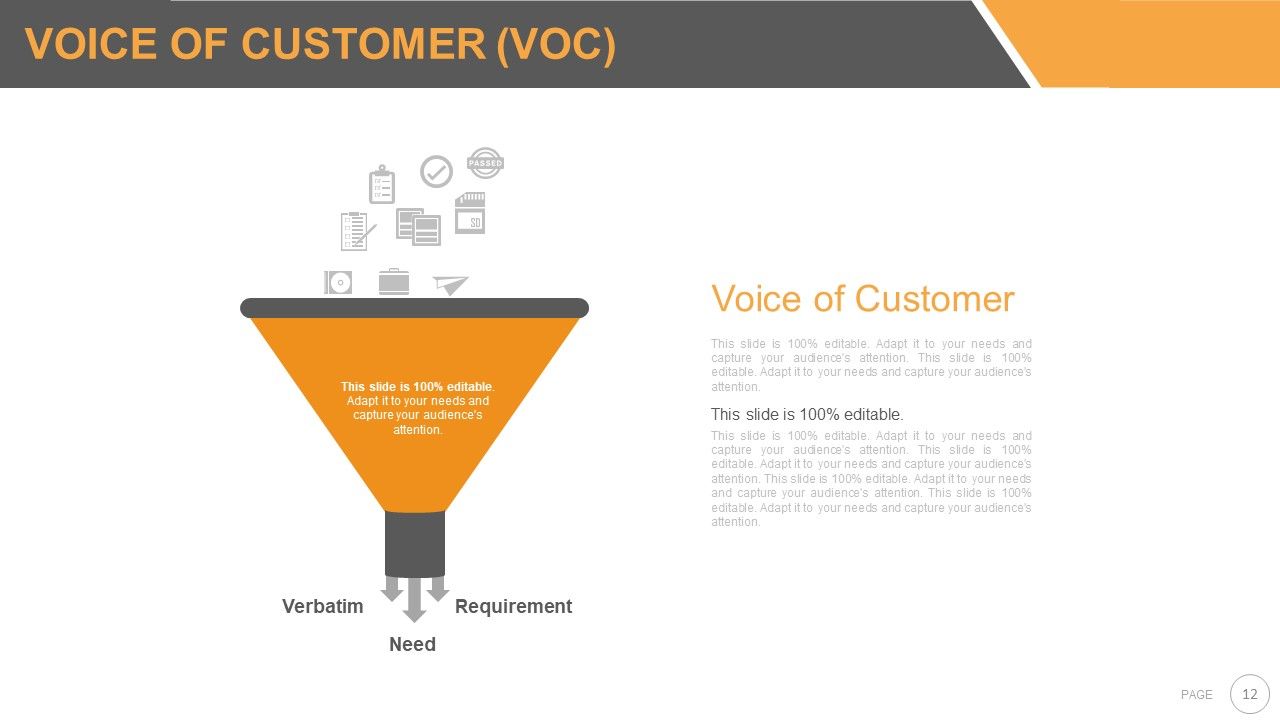
Slide 12: This slide showcases VOICE OF CUSTOMER (VOC) in funnel form.
Slide 13: This slide presents VOICE OF CUSTOMER (VOC) in arrow form.
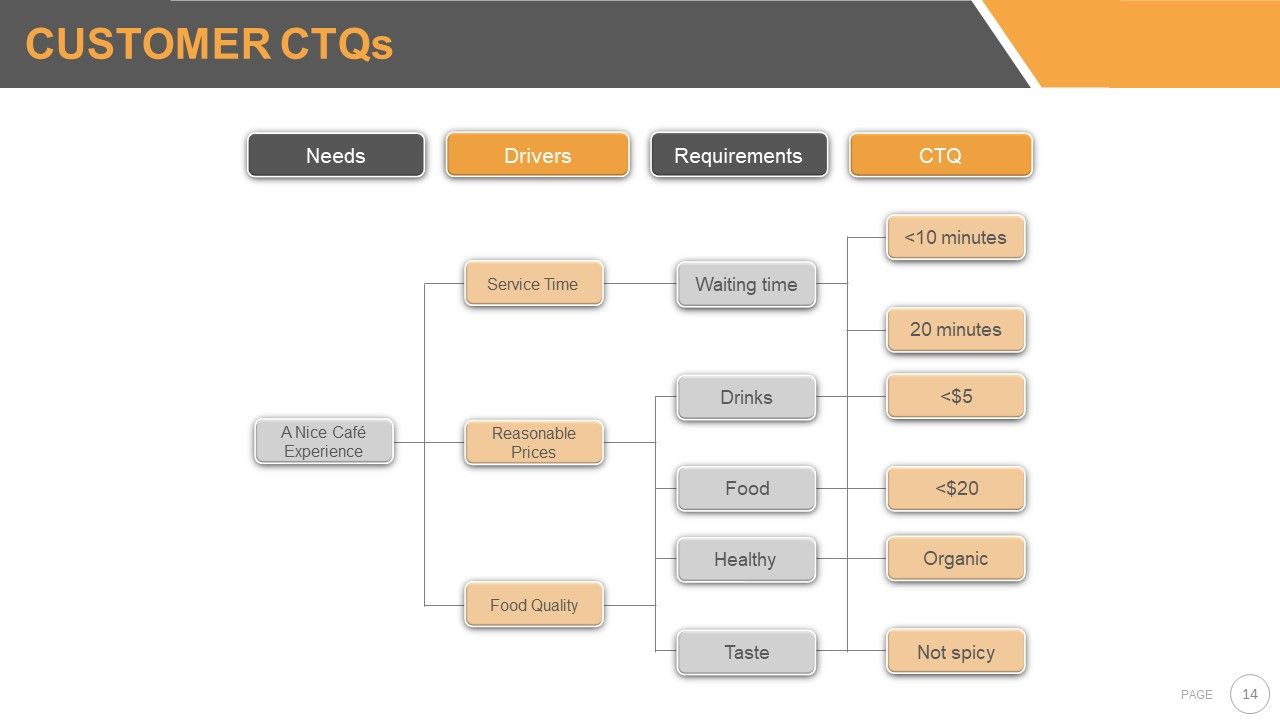
Slide 14: This slide showcases Customer CTQs in hierarchy form displaying- REQUIREMENTS, CTQ, DRIVERS, NEEDS.
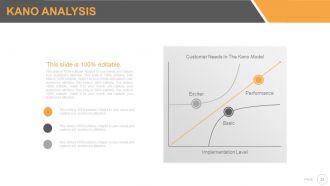
Slide 15: This slide showcases Kano Anlaysis with- Exciter, Performance, Basic, Customer Needs In The Kano Model, Implementation Level.
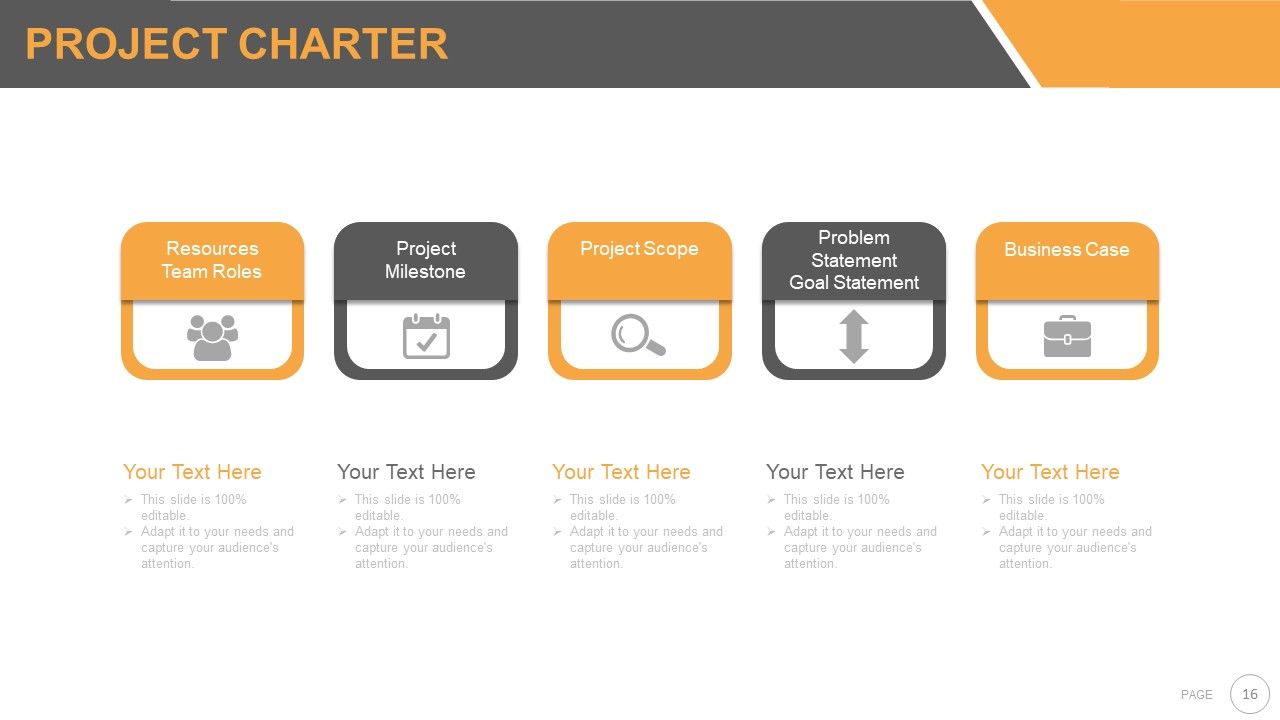
Slide 16: This slide showcases Project Charter displaying- Resources, Team Roles, Project, Milestone, Project Scope, Problem, Statement, Goal Statement, Business Case.
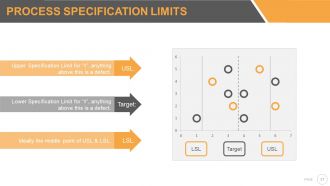
Slide 17: This slide showcases Process Specification Limits showing- LSL USL Target USL: Upper Specification Limit for ‘Y’, anything above this is a defect. Target: Lower Specification Limit for ‘Y’, anything above this is a defect.. LSL: Ideally the middle point of USL & LSL in bubble chart form.
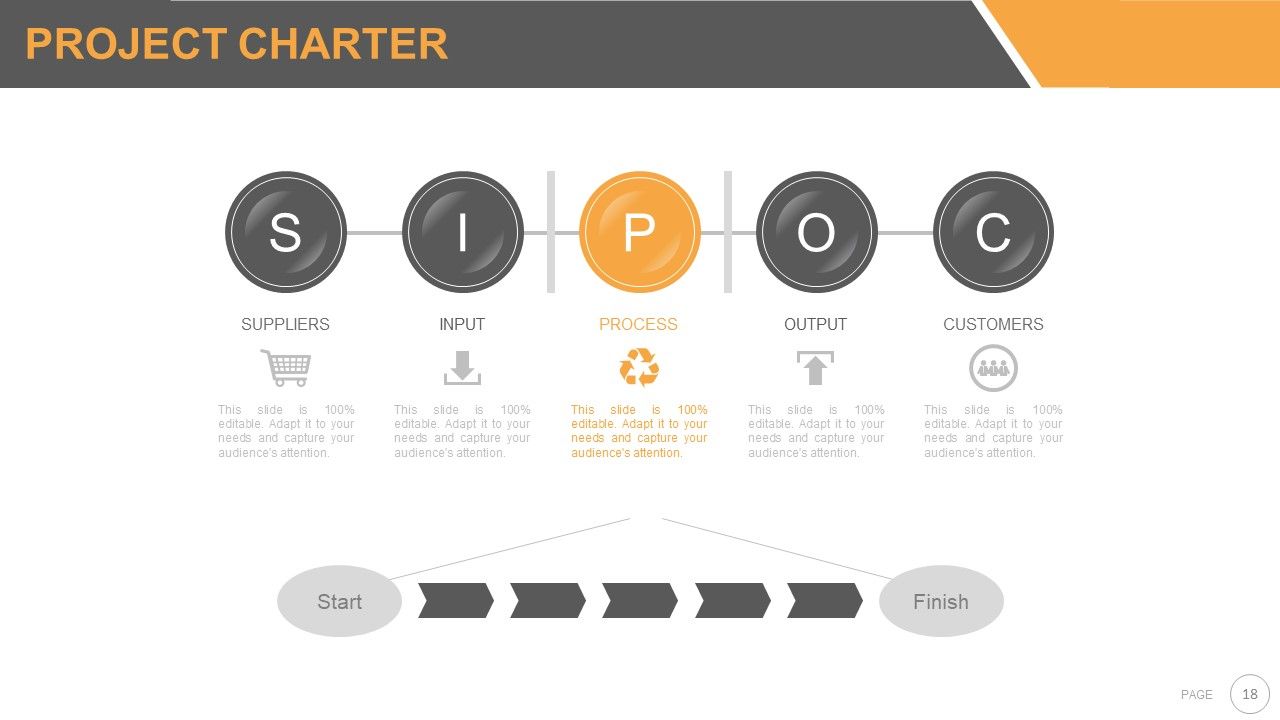
Slide 18: This slide showcases Project Charter SIPOC with- C-CUSTOMER, O-OUTPUT, P-PROCESS, I-INPUT, S-SUPPLIERS.
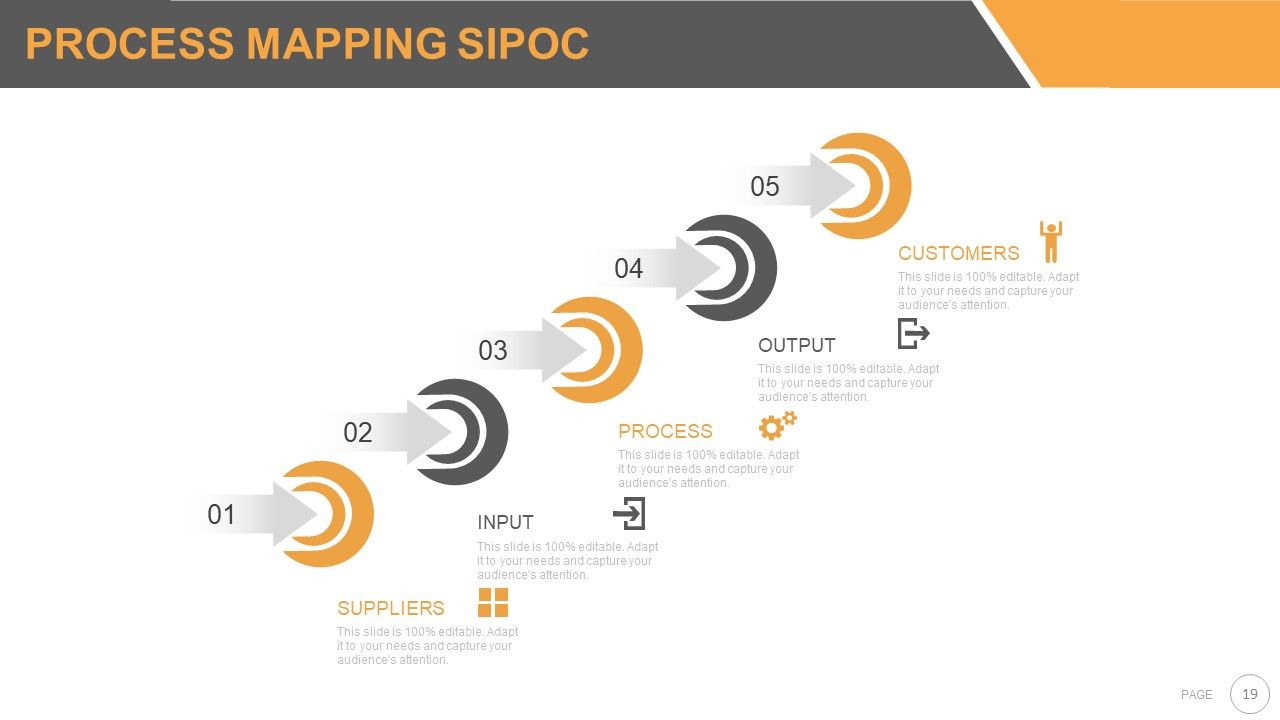
Slide 19: This slide showcases Process Mapping SIPOC with- C-CUSTOMER, O-OUTPUT, P-PROCESS, I-INPUT, S-SUPPLIERS.
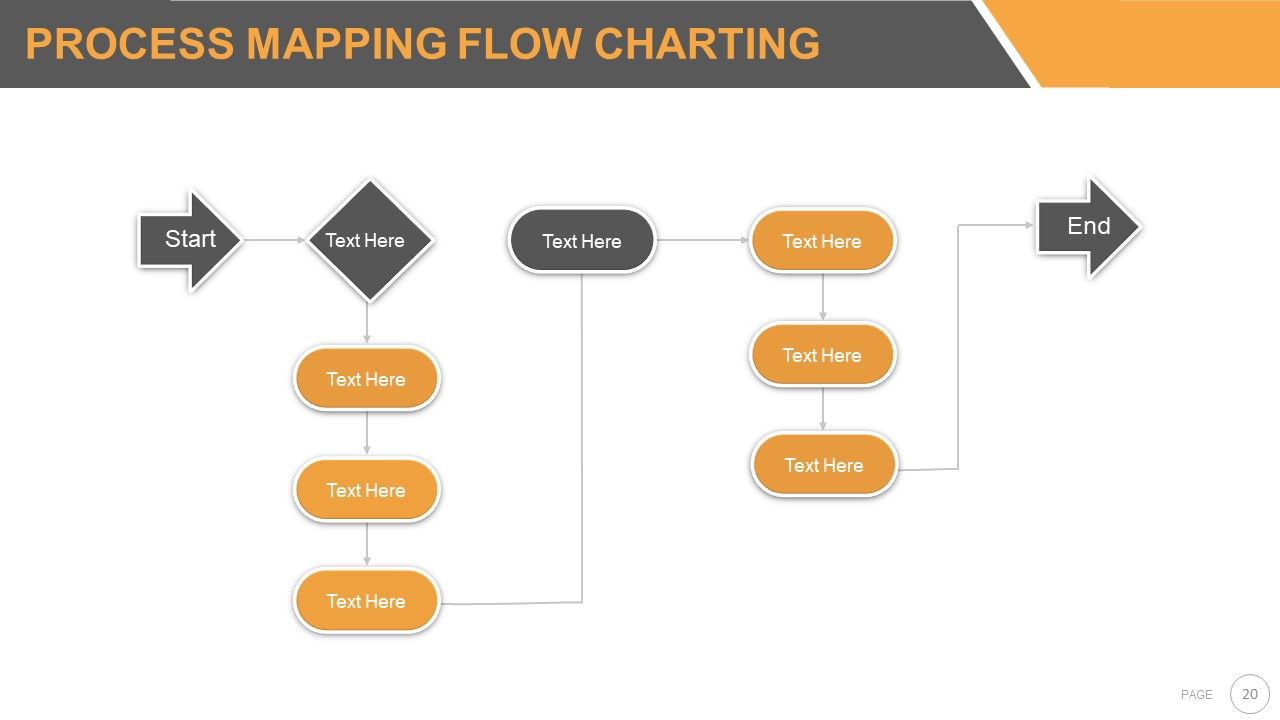
Slide 20: This slide shows Process Mapping Flow Charting.
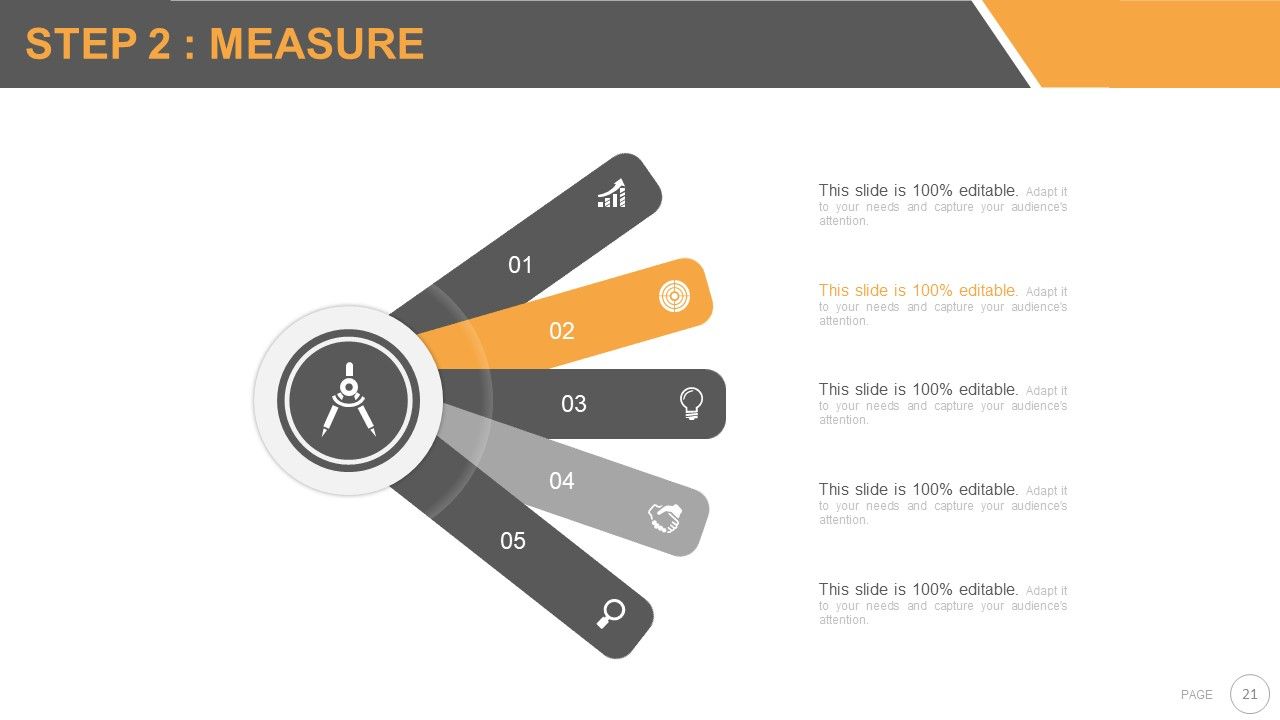
Slide 21: This slide showcases STEP 2: MEASURE.
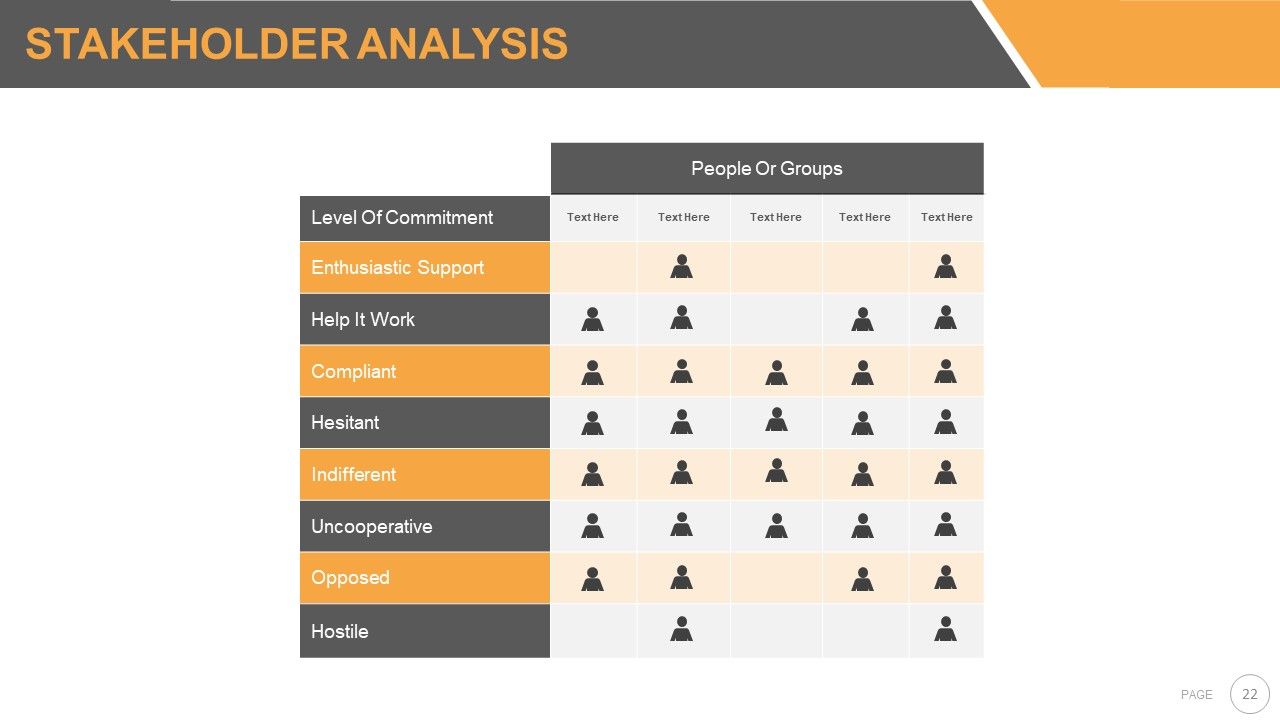
Slide 22: This slide shows Stakeholder Analysis in tabular form.
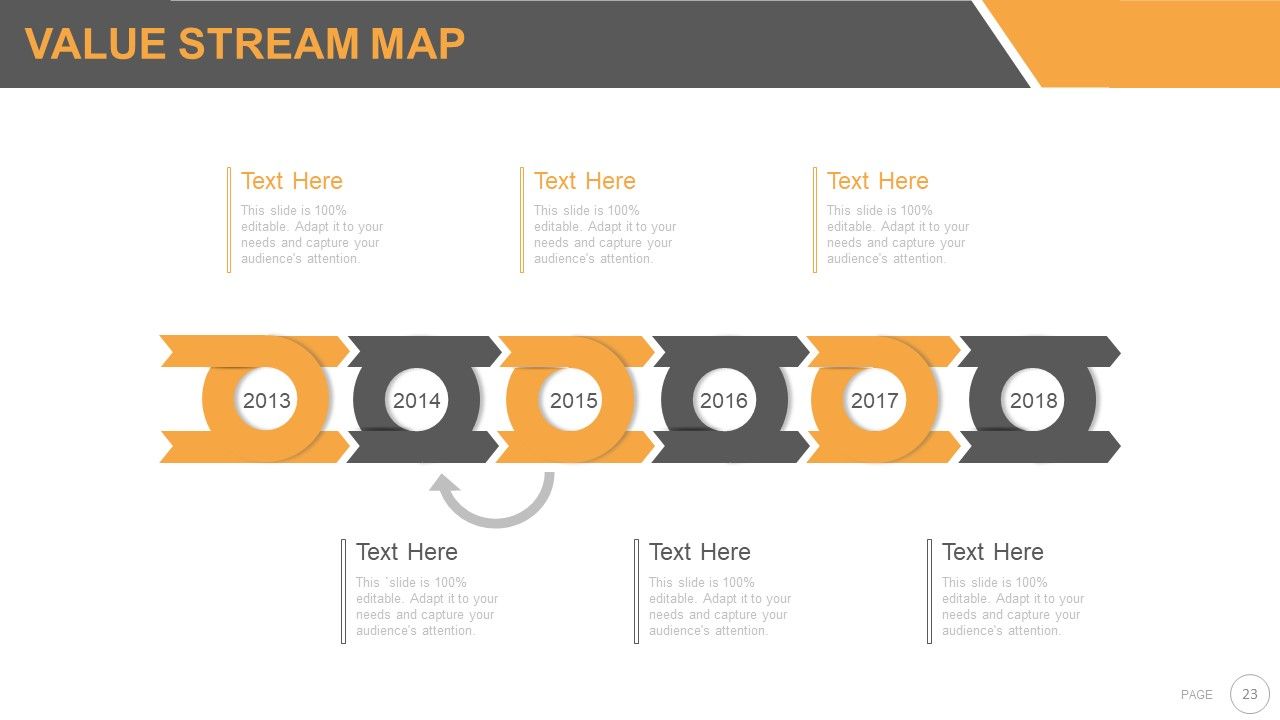
Slide 23: This slide showcases a Value Stream Map.
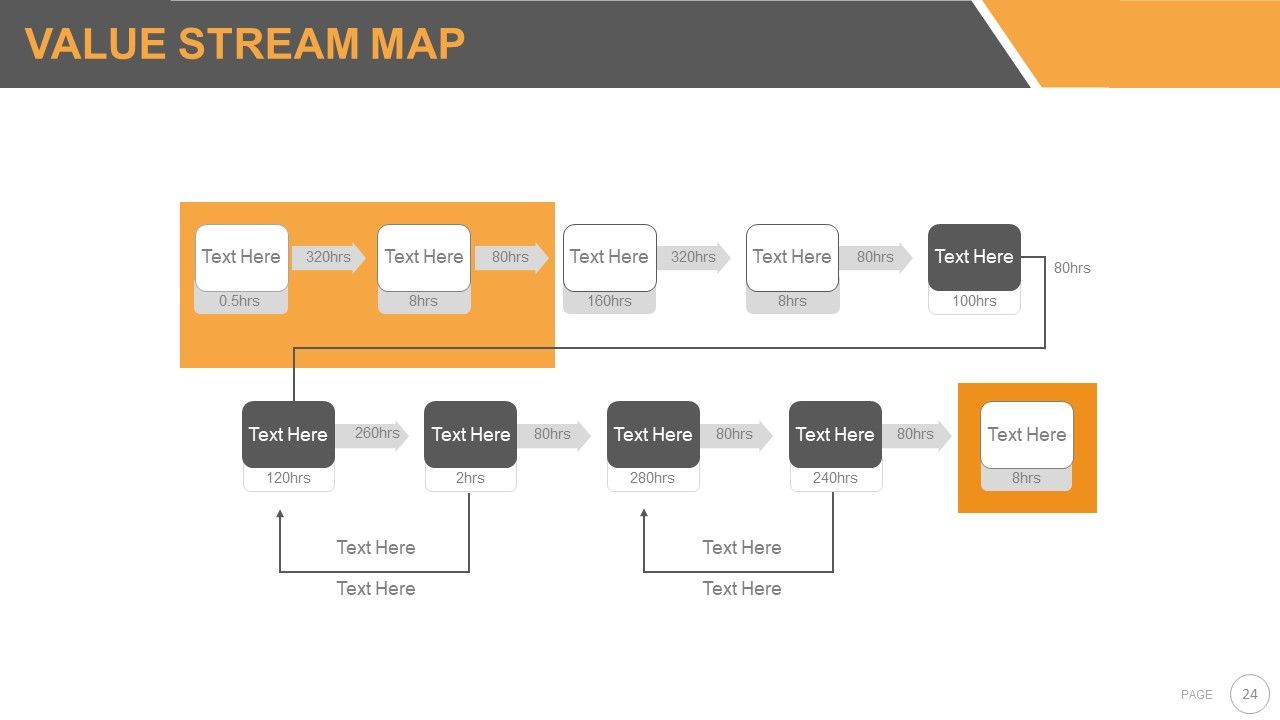
Slide 24: This slide also presents a Value Stream Map.
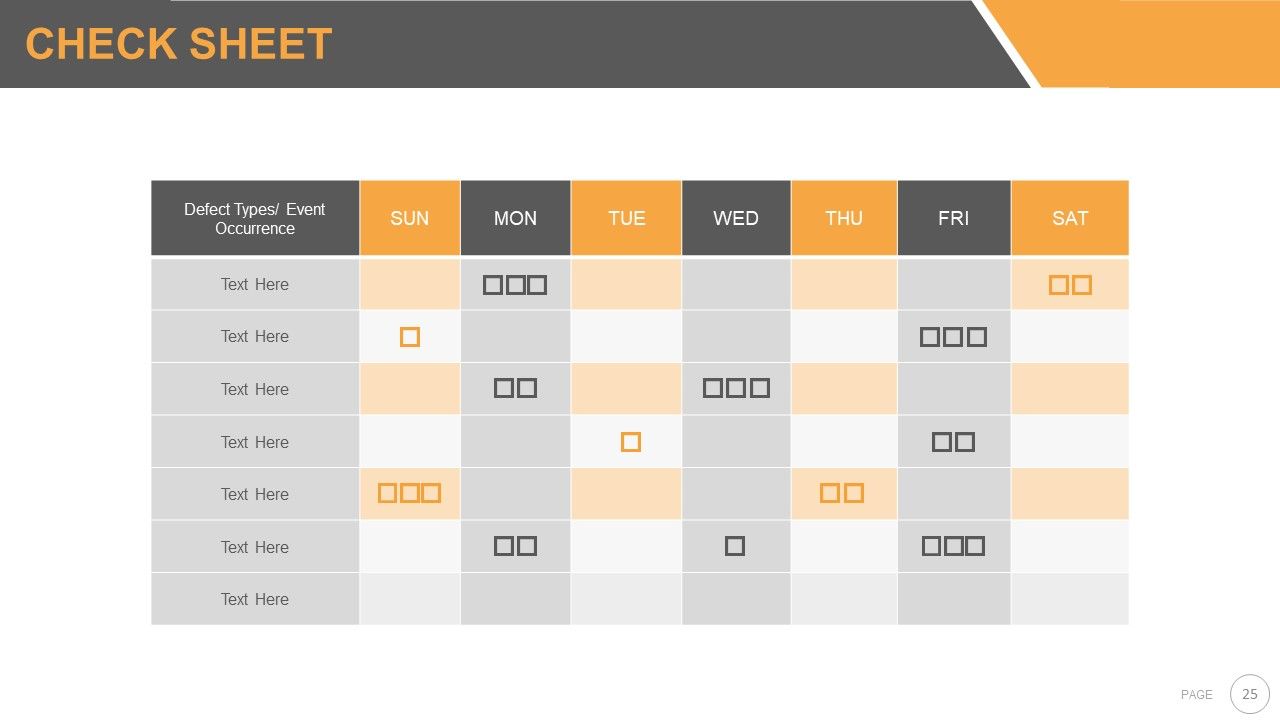
Slide 25: This is a CHECK SHEET slide in tabular form.
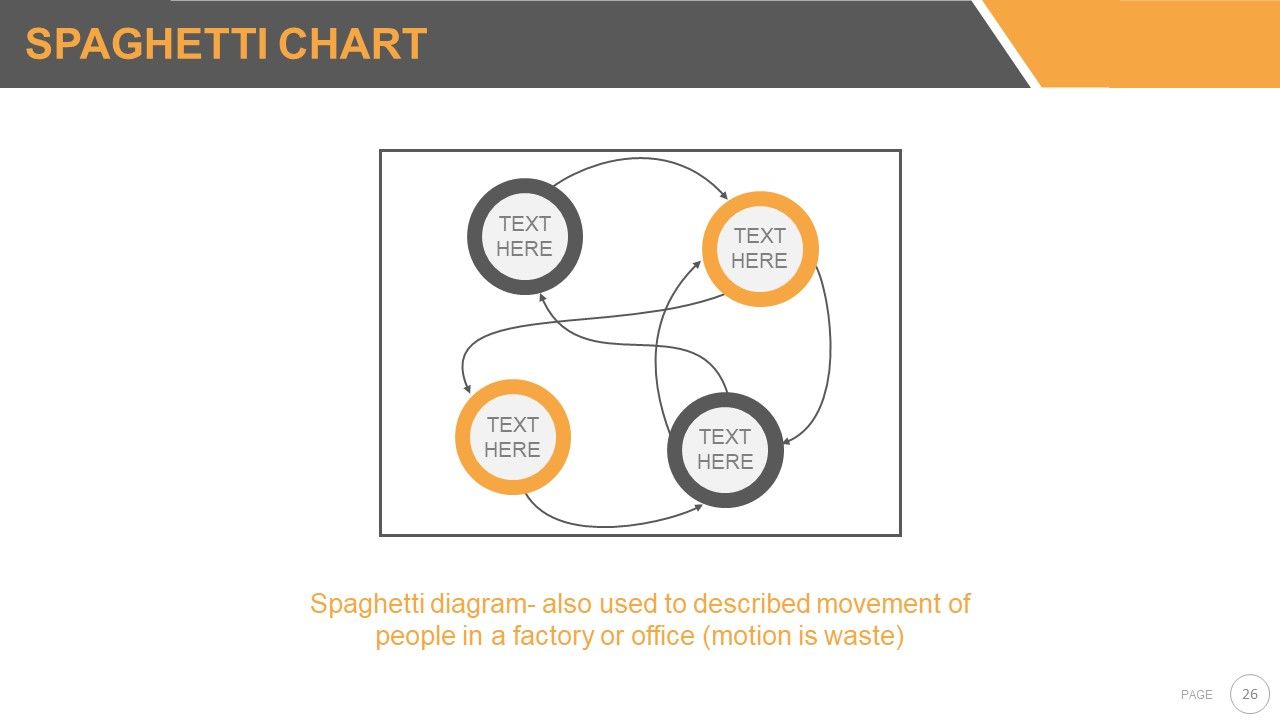
Slide 26: This slide displays a Spaghetti Chart diagram- also used to described movement of people in a factory or office (motion is waste).
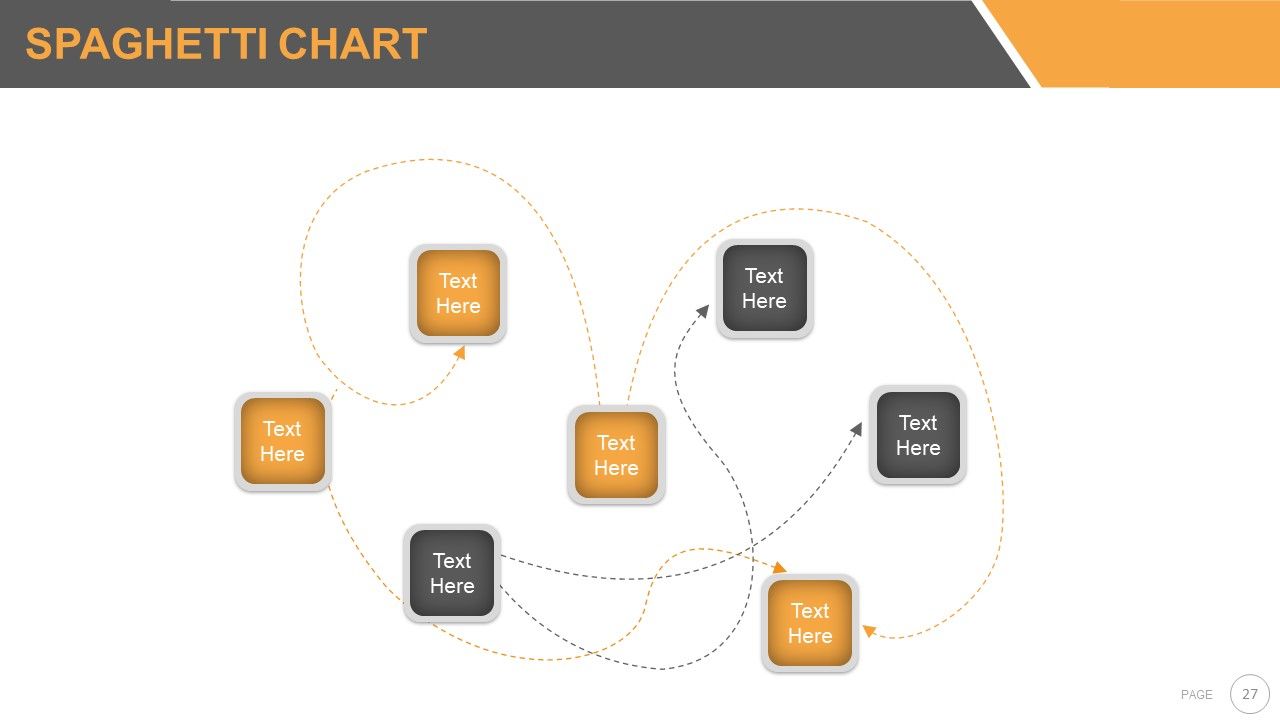
Slide 27: This slide displays a Spaghetti Chart.
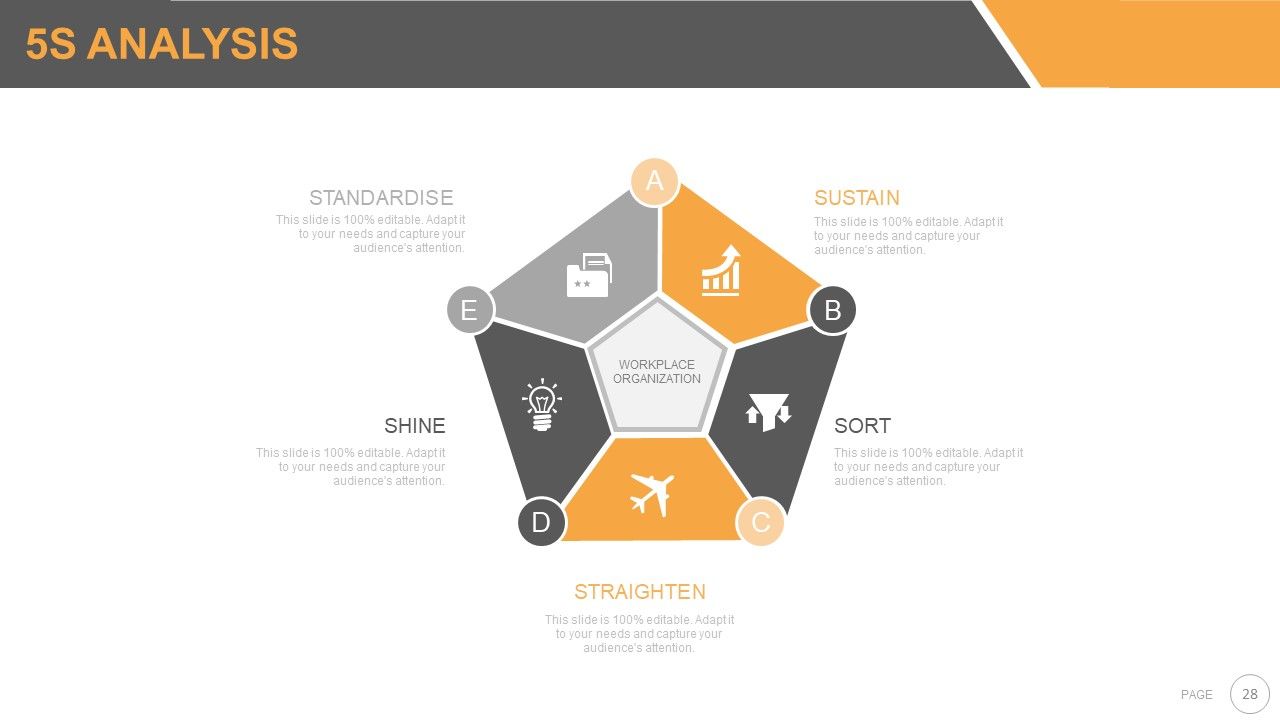
Slide 28: This slide shows 5S ANALYSIS namely- STRAIGHTEN, SORT, SHINE, SUSTAIN, STANDARDISE.
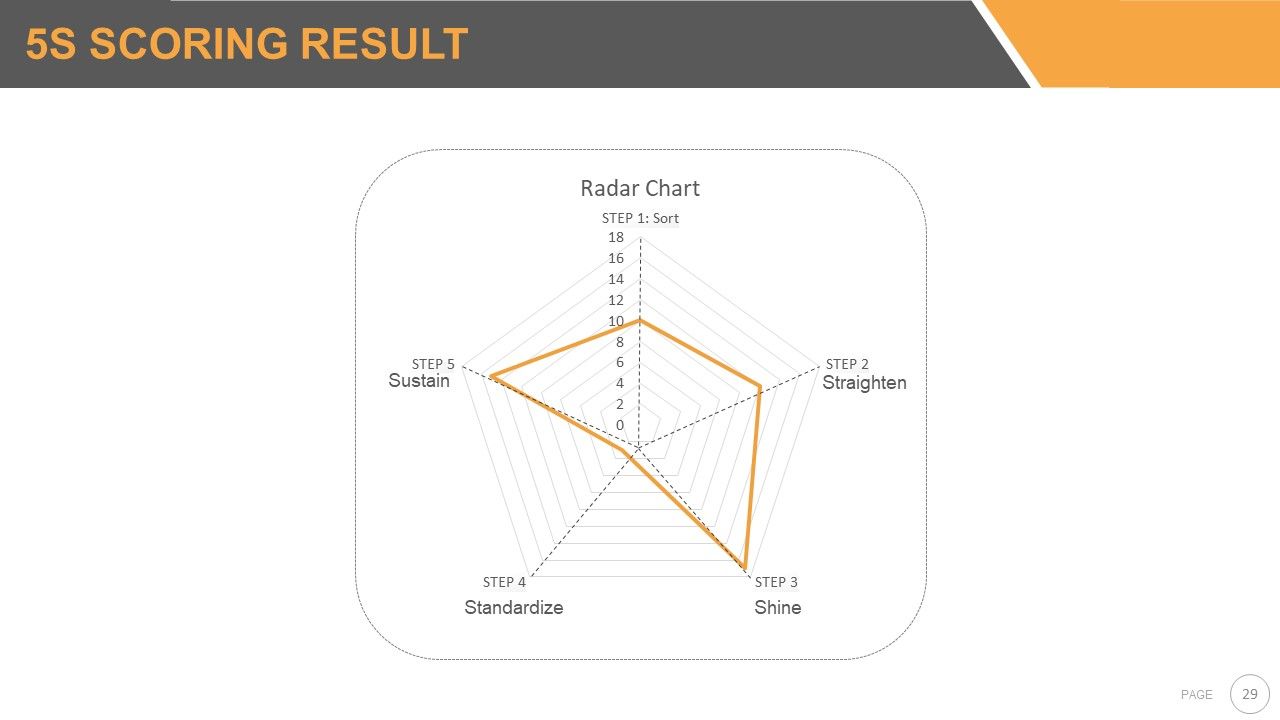
Slide 29: This slide shows 5S SCORING RESULT namely- Sustain, Straighten, Shine, Standardize.
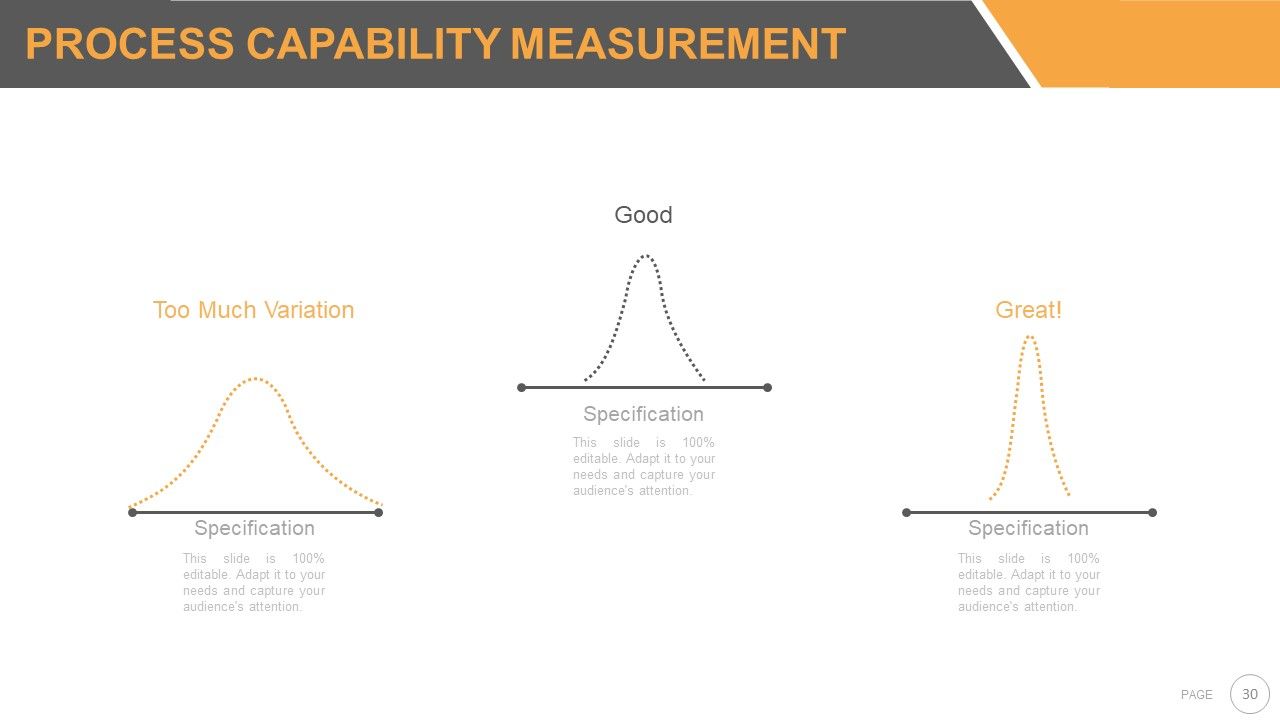
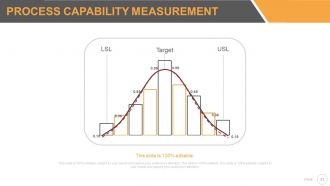
Slide 30: This slide shows Process Capability Measurement in crest graph form.
Slide 31: This slide also shows Process Capability Measurement in crest graph form displaying LSL, USL and TARGET.
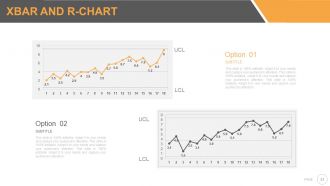
Slide 32: This slide displays a XBAR AND R-CHART for presenting monitored variable data.
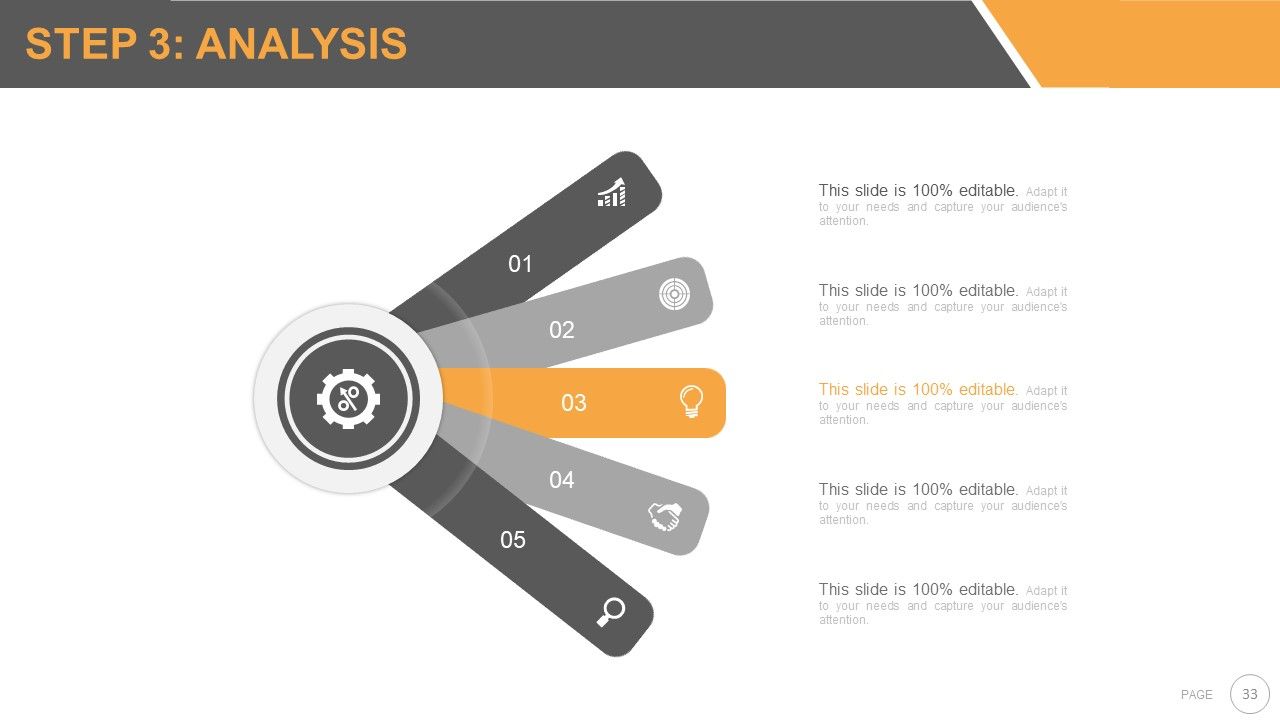
Slide 33: This slide displays STEP 3: ANALYSIS.
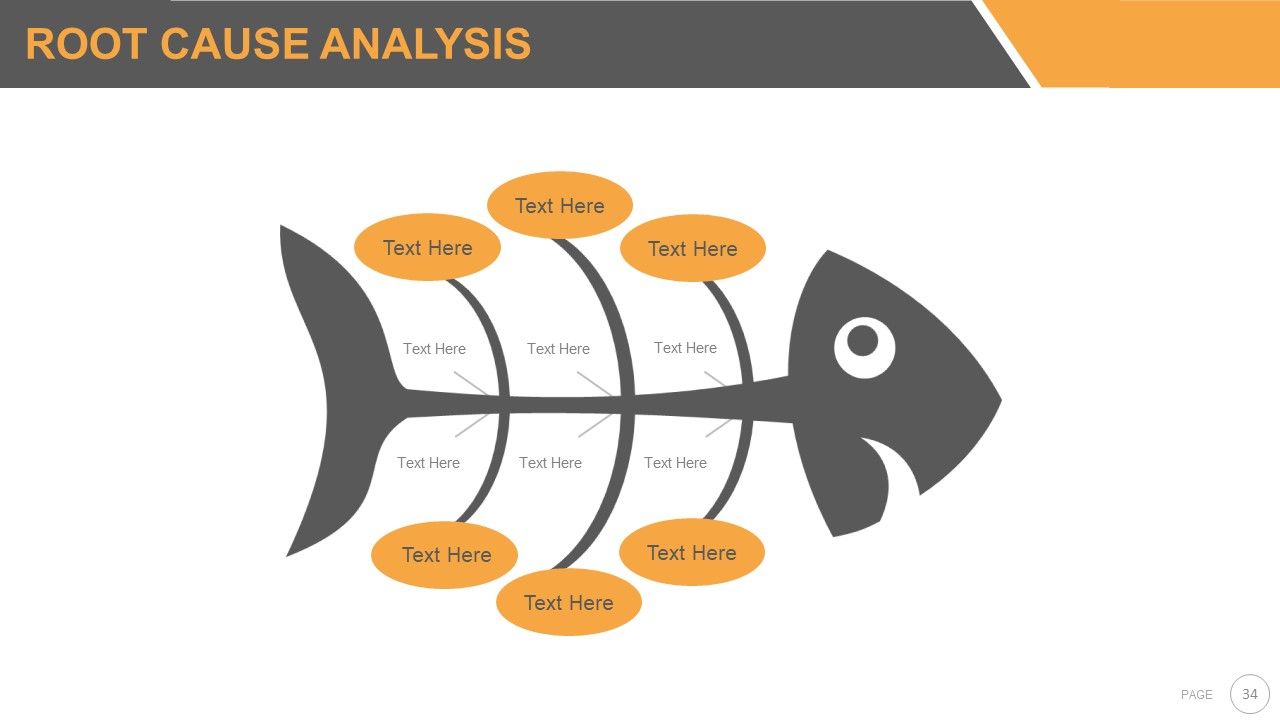
Slide 34: This slide shows Root Cause Analysis diagram.
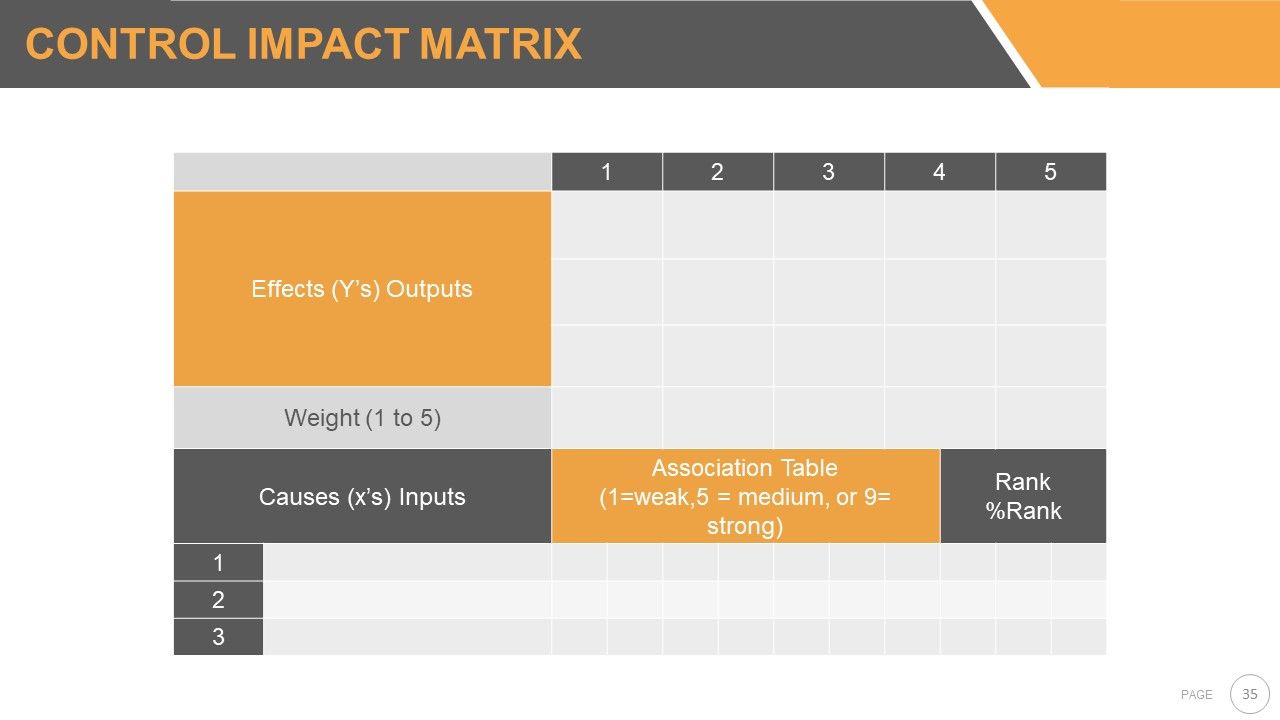
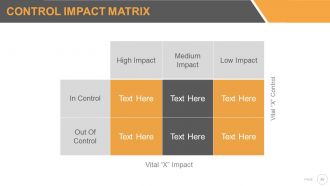
Slide 35: This slide shows a CONTROL IMPACT MATRIX.
Slide 36: This slide showcases a CONTROL IMPACT MATRIX.
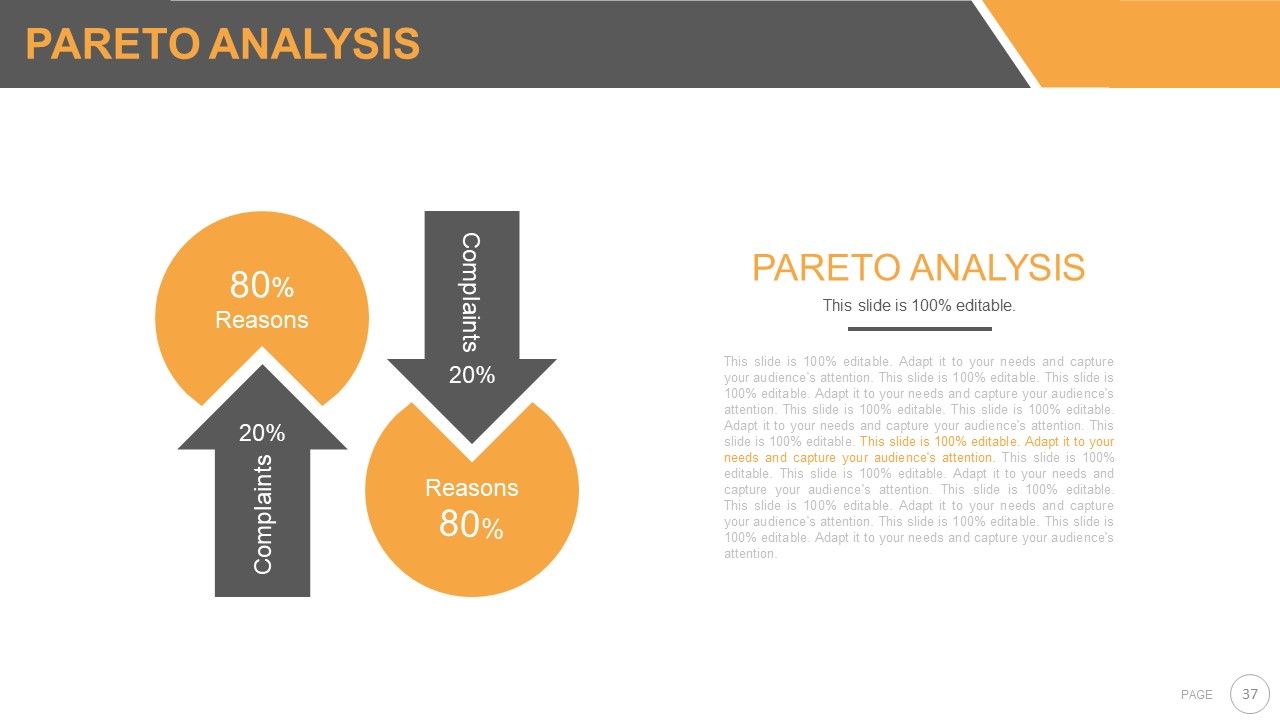
Slide 37: This slide displays Pareto Analysis in graph form.
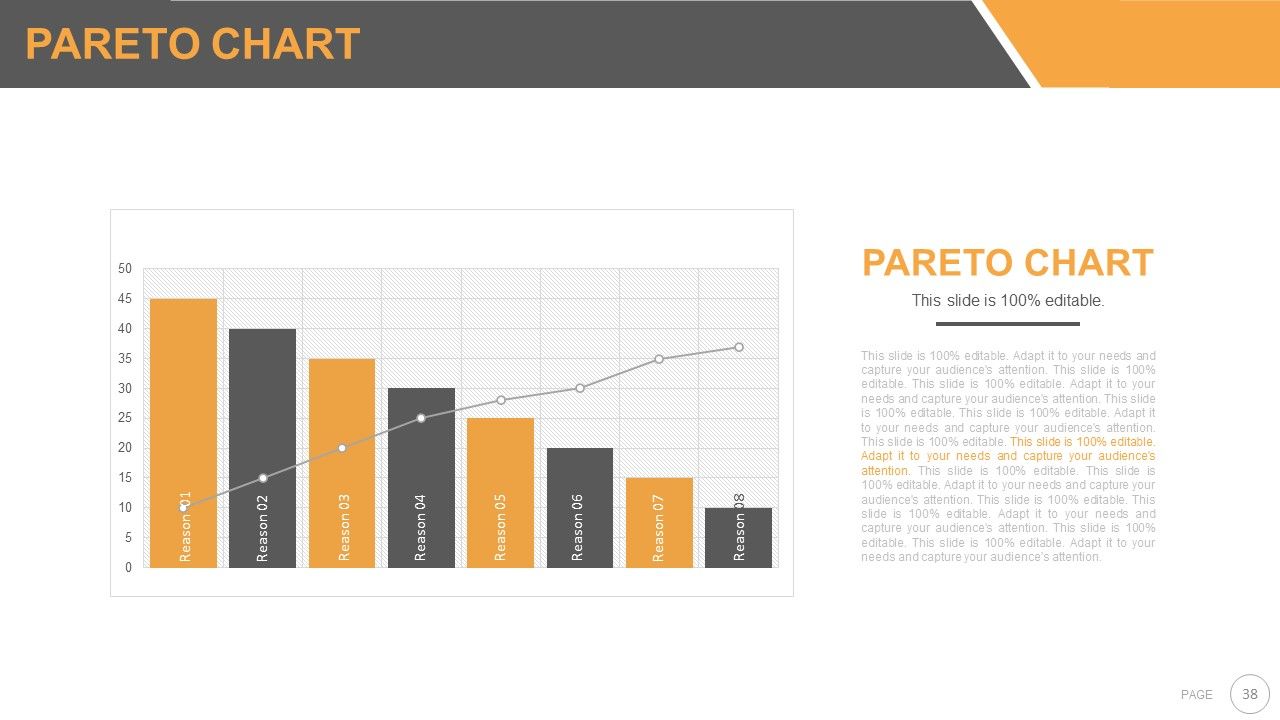
Slide 38: This slide displays Pareto Chart Analysis in graph form.
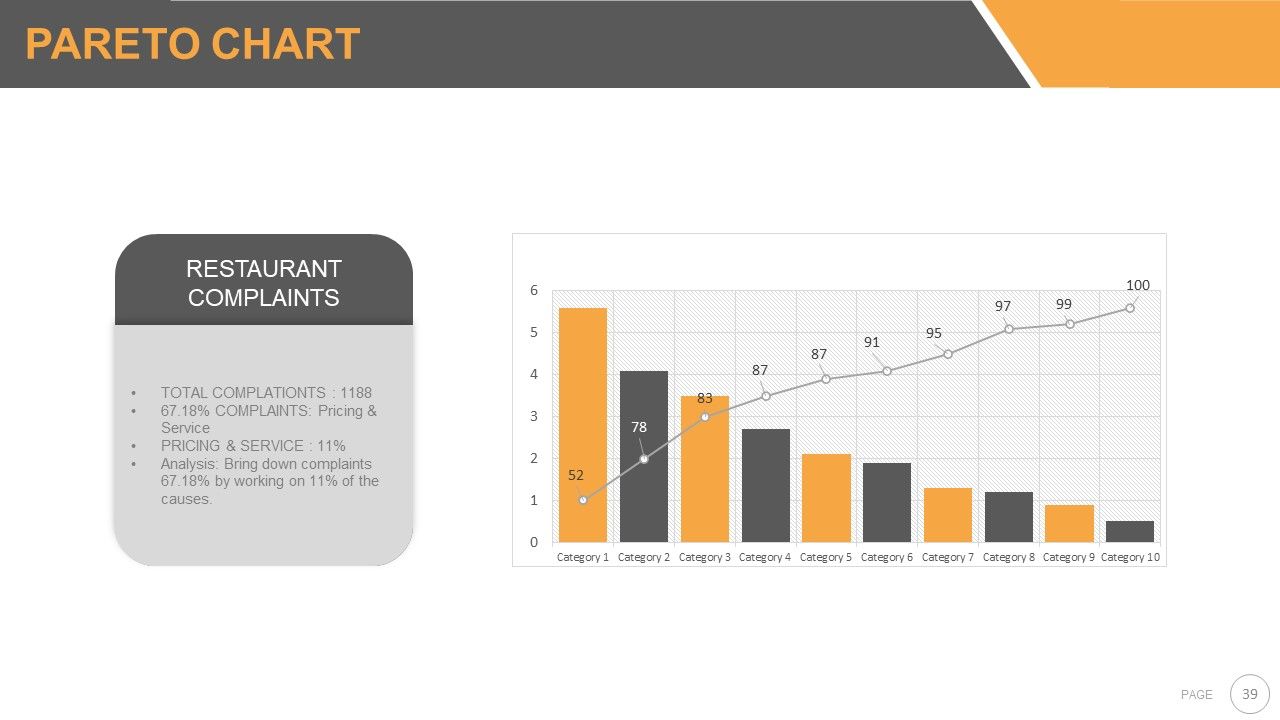
Slide 39: This slide showcases Pareto Chart Analysis in graph form.
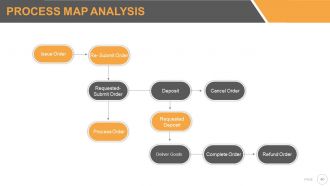
Slide 40: This slide shows PROCESS MAP ANALYSIS displaying- Issue order, Cancel order, Deliver Goods, Process order, Refund order, Requested- submit order, Requested Deposit, Complete order, Re- submit order, Deposit.
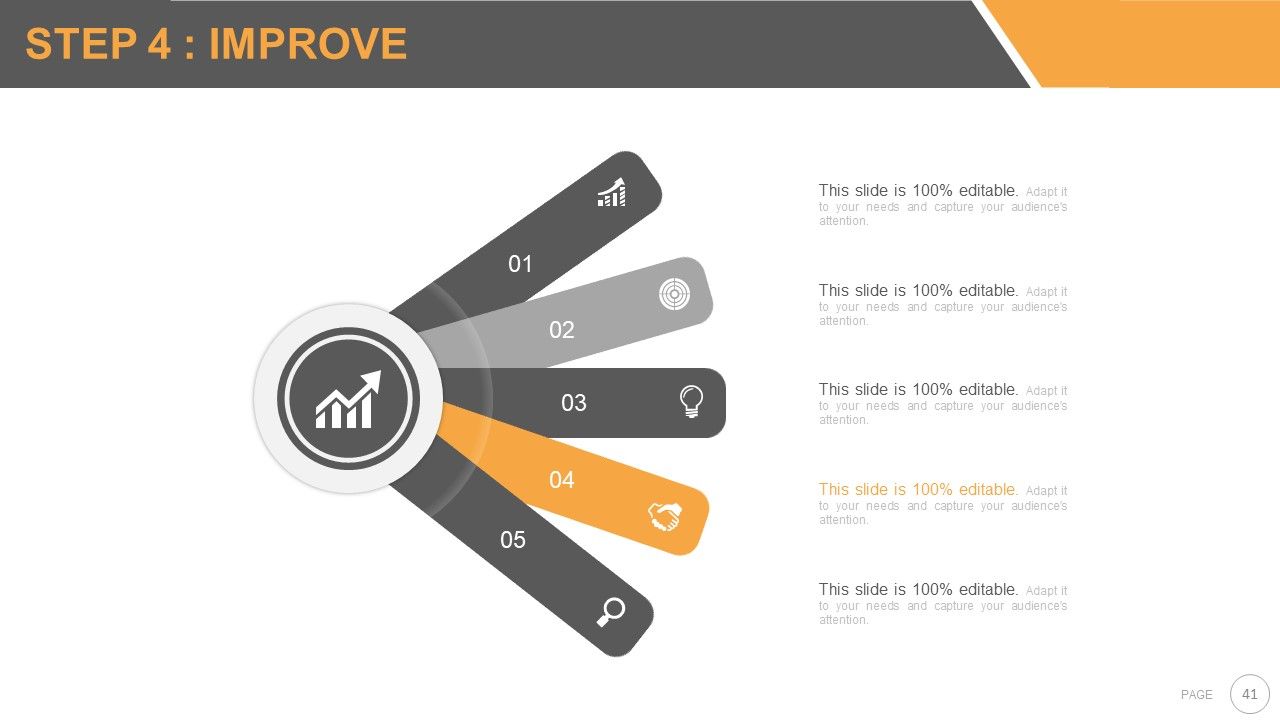
Slide 41: This slide shows STEP 4: IMPROVE.
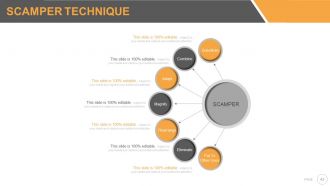
Slide 42: This slide displays the SCAMPER TECHNIQUE- Substitute Combine Adapt Magnify Rearrange Eliminate Put To Other Uses.
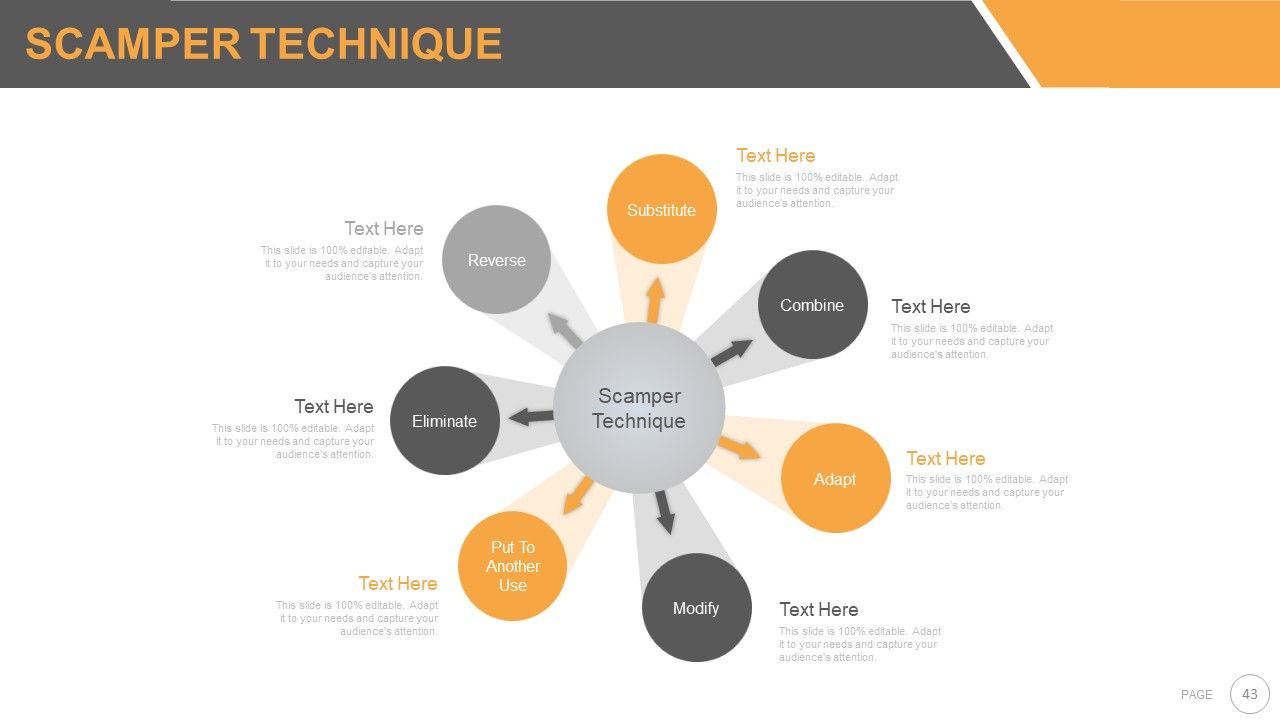
Slide 43: This slide displays the Scamper Technique showing- Reverse, Eliminate, Put To Another Use, Modify, Adapt, Combine, Substitute.
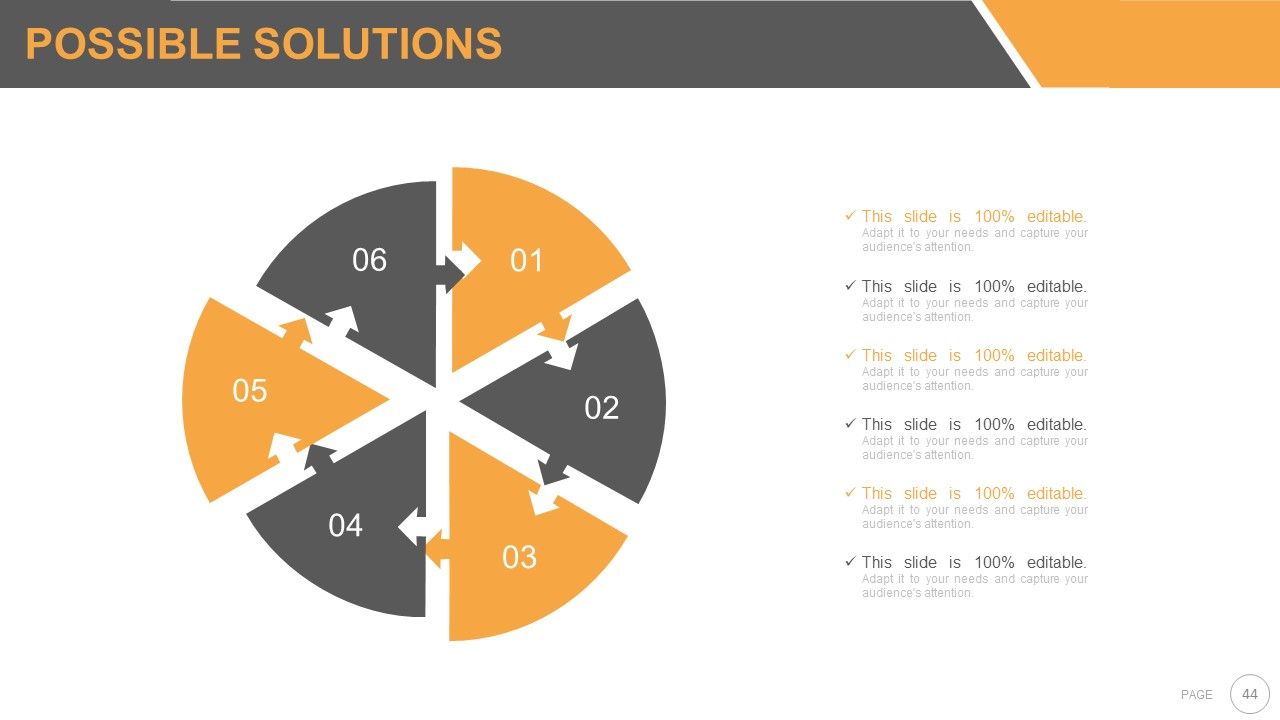
Slide 44: This slide is titled POSSIBLE SOLUTIONS in circular puzzle image form.
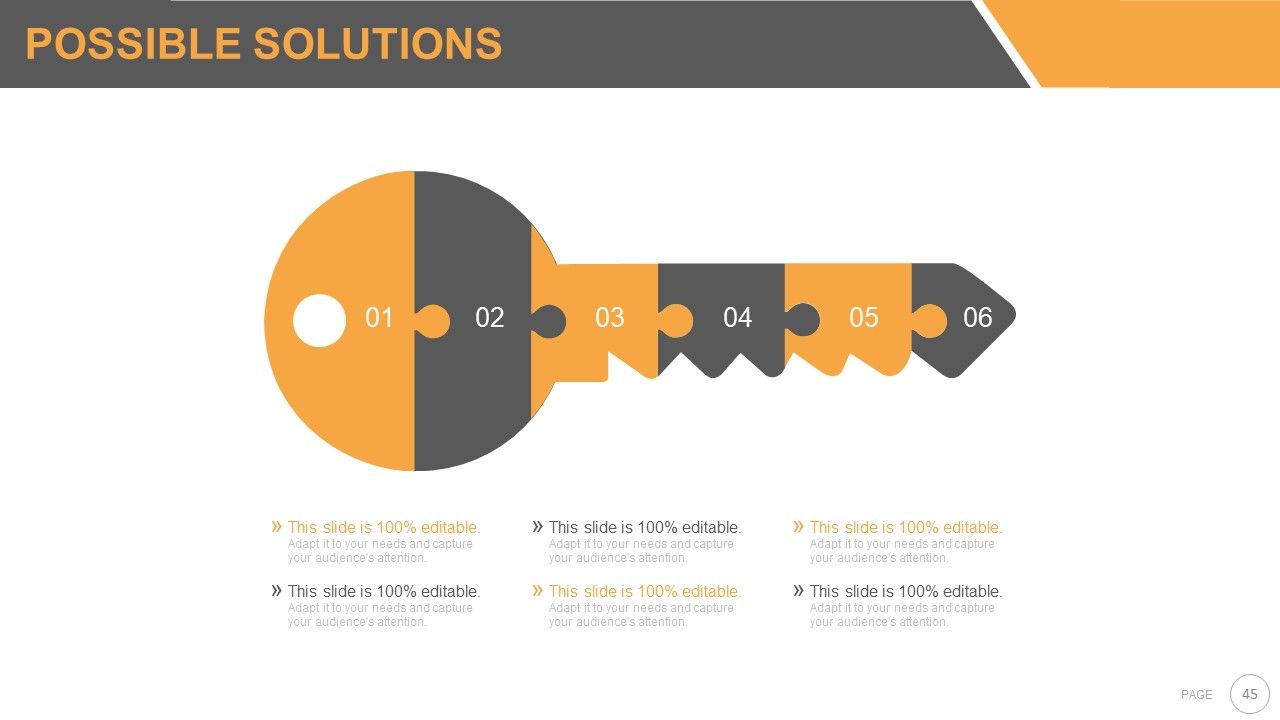
Slide 45: This slide is titled Possible Solutions in puzzle key image form.
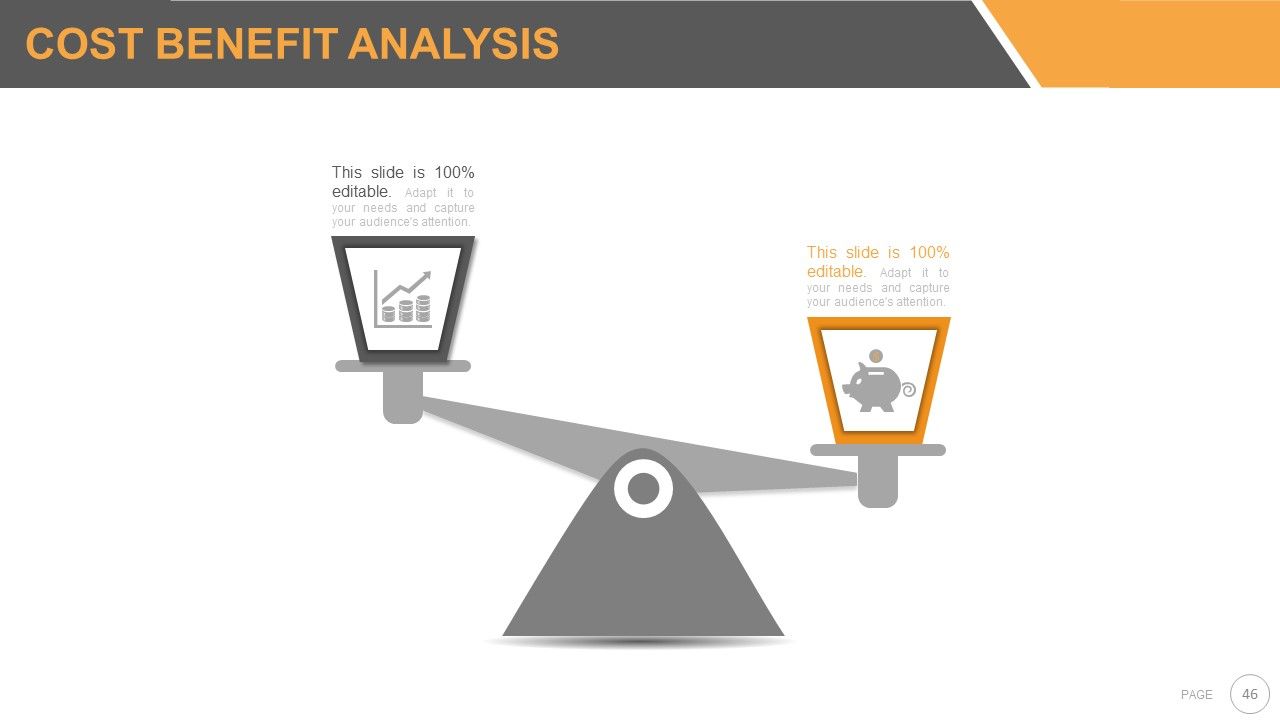
Slide 46: This slide shows Cost Benefit Analysis in balance image form.
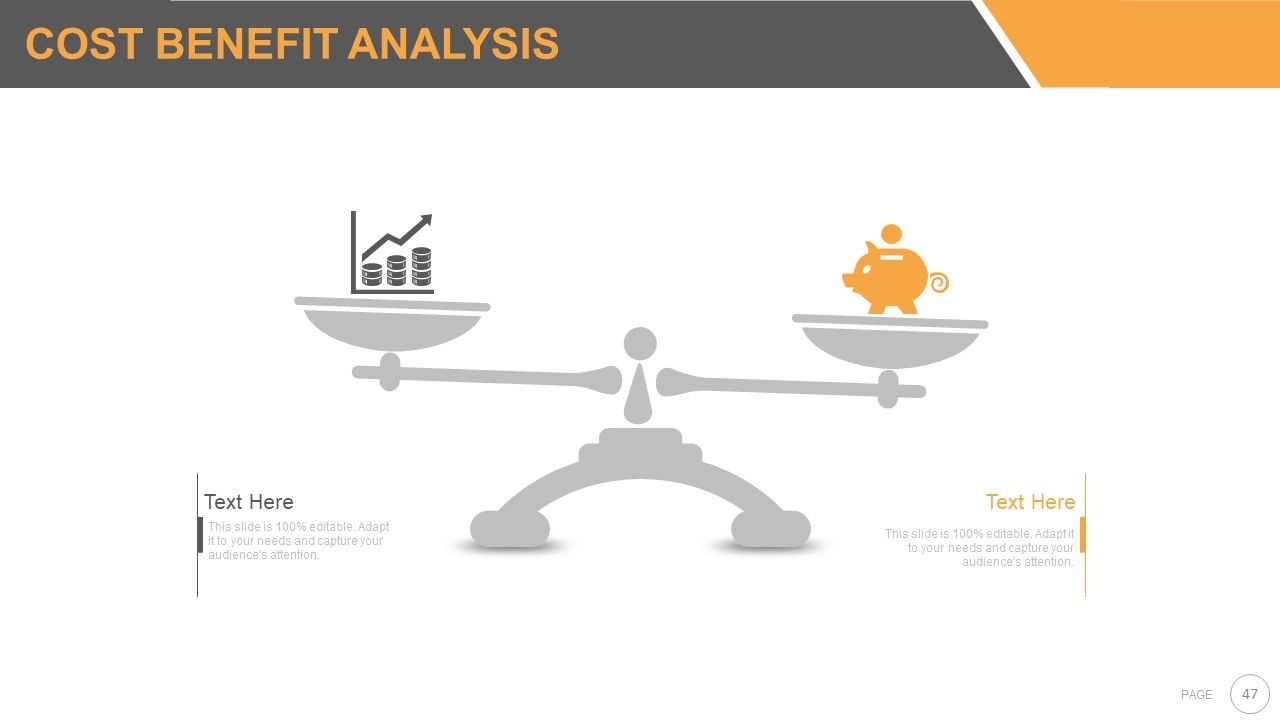
Slide 47: This slide shows Cost Benefit Analysis in balance image form.
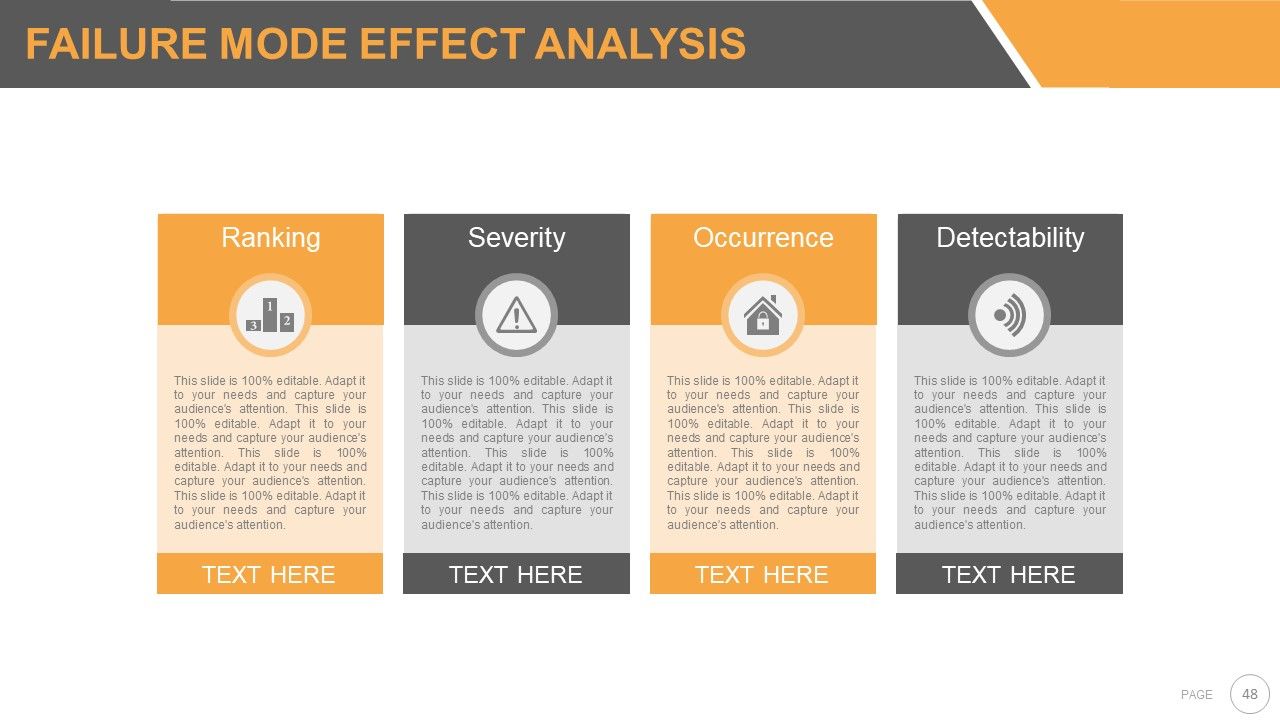
Slide 48: This slide showcases Failure Mode Effect Analysis displaying- Ranking, Severity, Occurrence, Detectability.
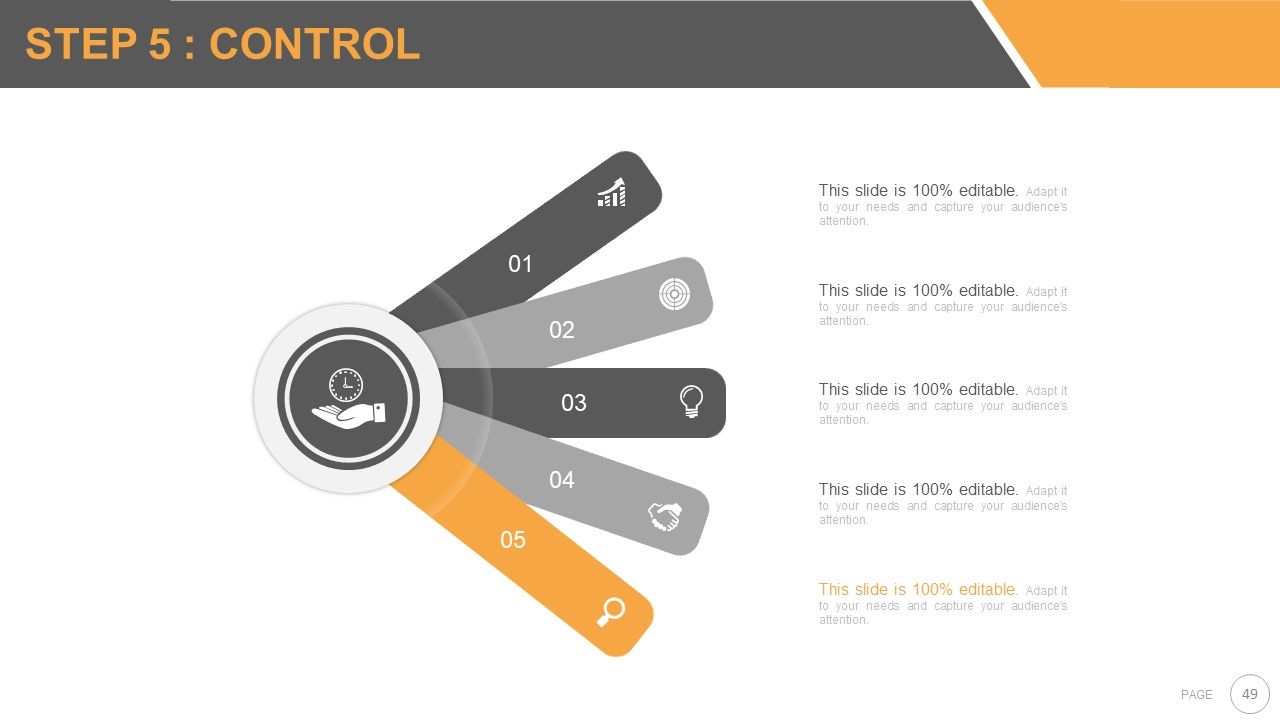
Slide 49: This slide shows STEP 5: CONTROL
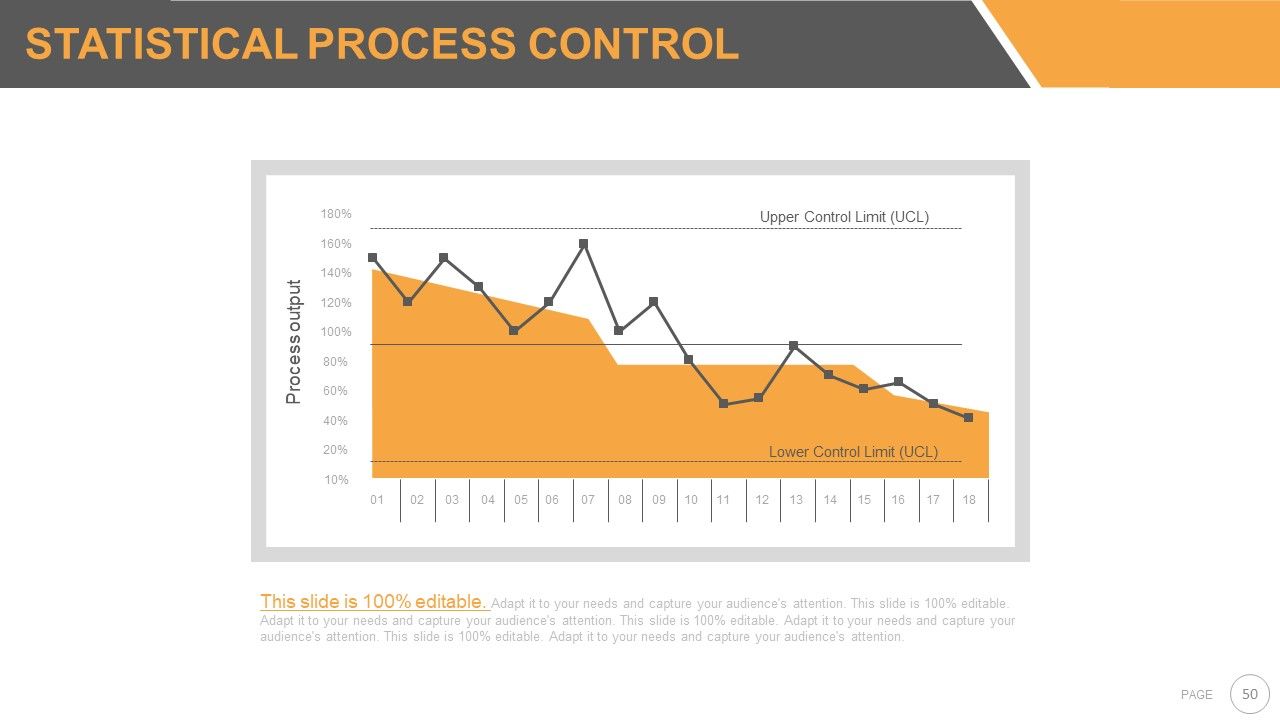
Slide 50: This slide shows Statistical Process Control displaying- Upper Control Limit (UCL), Lower Control Limit (UCL) with Process output.
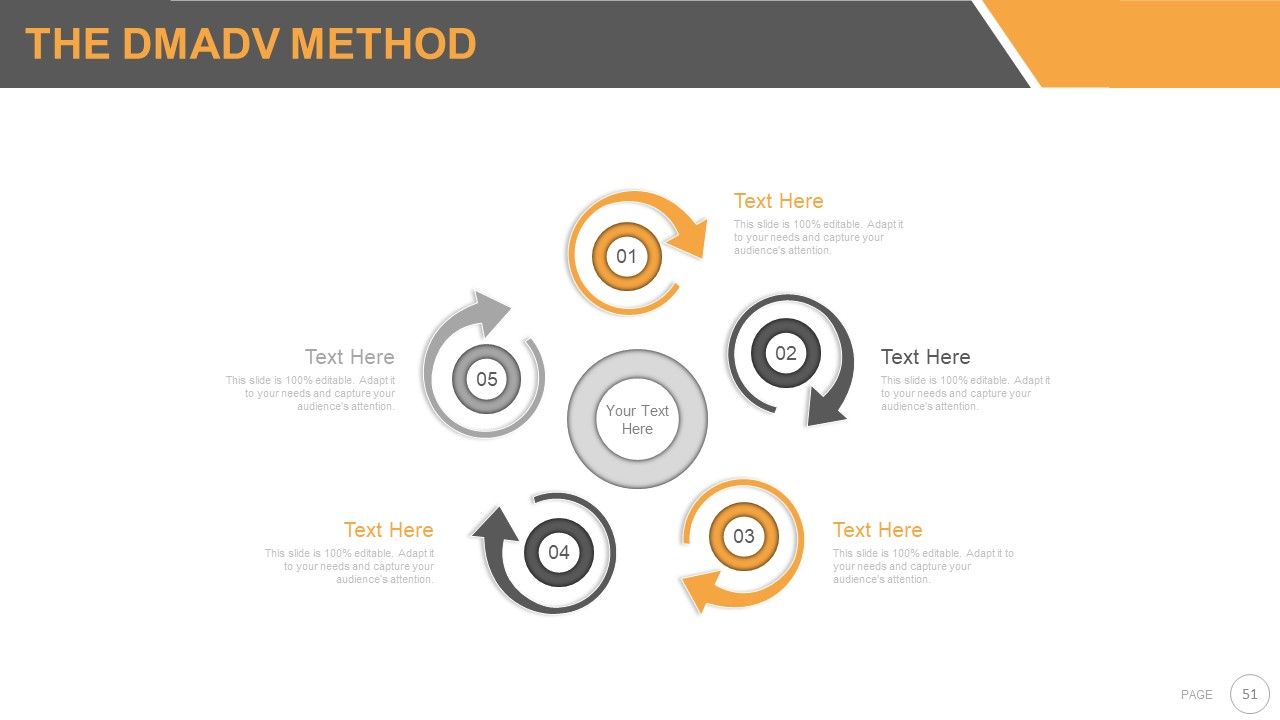
Slide 51: This slide presents The DMADV Method.
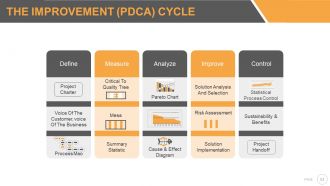
Slide 52: This slide elaborates The Improvement (PDCA) Cycle showcasing- Analyze: Pareto Chart, Cause & Effect Diagram. Improve: Solution Analysis And Selection, Solution Implementation, Risk Assessment. Control: Sustainability & Benefits, Project Handoff, Statistical Process Control. Measure: Summary Statistic, Critical To Quality Tree. Define: Project Charter, Voice Of The Customer, voice Of The Business, Process Map.
Slide 53: This slide is titled Additional Slides to proceed forward. You can change/alter the slide content as per need.
Slide 54: This is an Agenda slide. State your agendas here.
Slide 55: This is Our Mission slide. State company mission here.
Slide 56: This is Our Team slide with names, designation and image boxes.
Slide 57: This is Our Goal slide. State goals here.
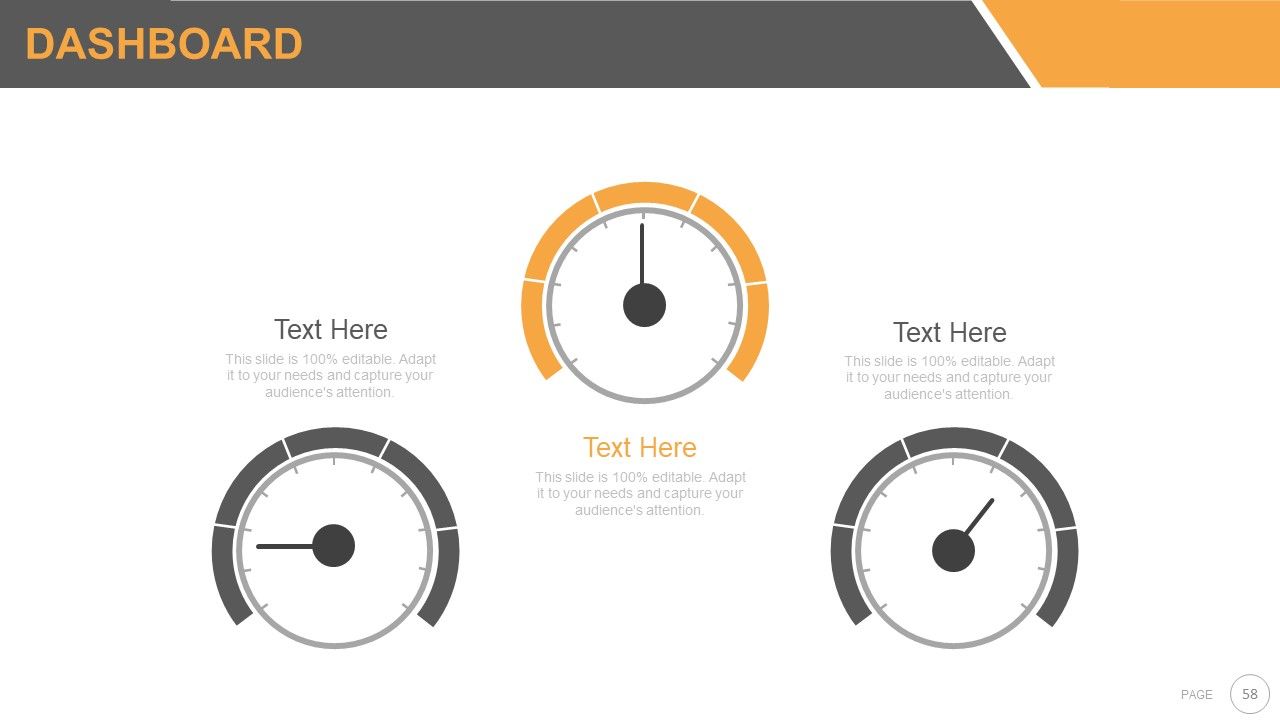
Slide 58: This is a Dashboard slide to show Low, Medium and High aspects, kpis etc.
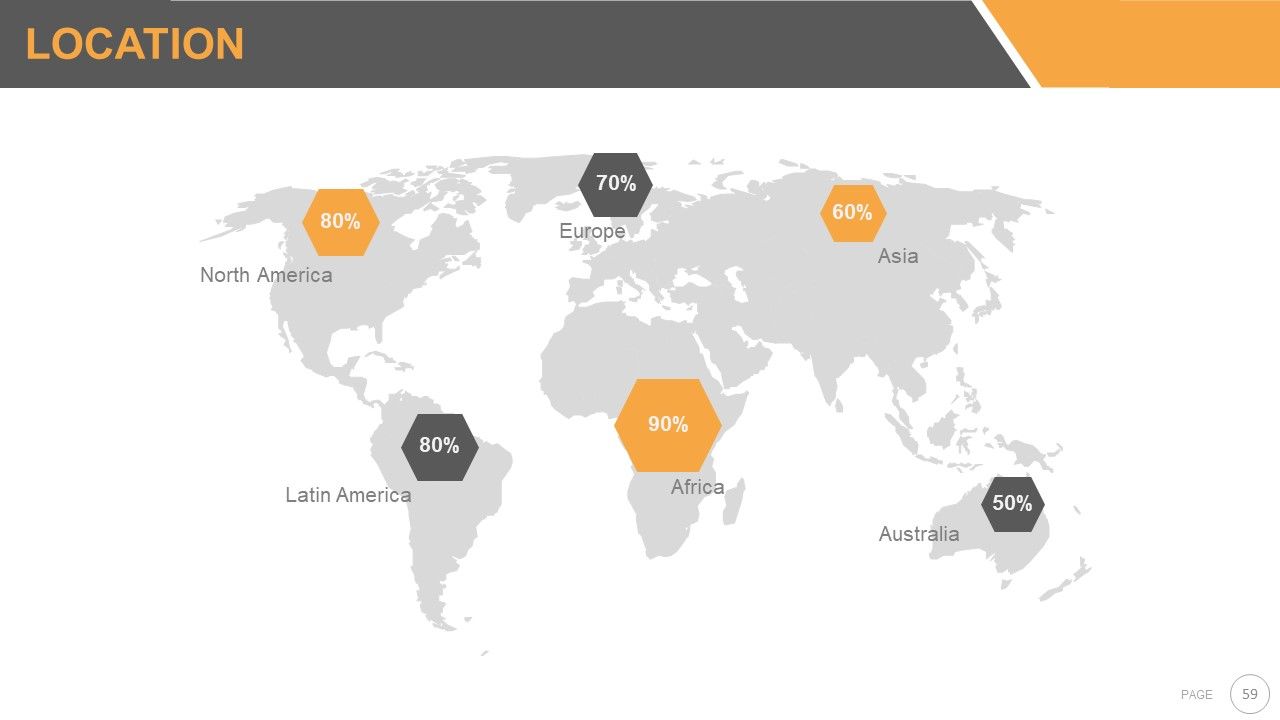
Slide 59: This is a Location slide of world map to show global growth, presence etc.
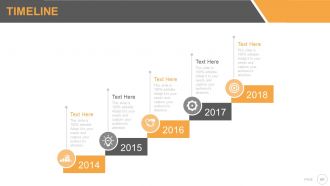
Slide 60: This is a Timeline slide to present important dates, evolution, milestones etc.
Slide 61: This is a Thank You slide for acknowledgement with address, contact numbers, and email.
Six sigma strategy and methodology powerpoint presentation with slides with all 61 slides:
Set them free of any bias. Our Six Sigma Strategy And Methodology Complete Powerpoint Deck With Slides encourage an evenhanded approach.
-
Very well designed and informative templates.
-
It saves your time and decrease your efforts in half.


