


Big Data Analytics Powerpoint Presentation Slide
If it’s that time to make analysis for the predicament of the management system or simply to present deafening data in front of your qualified team then you have reached the right match. SlideTeam presents you classy and eternally approaching PowerPoint slides for big data analytics. Data analysis agendas and big data plans are shown through captivating icons and subheadings for a precise and interesting approach. This unique PPT slide is useful for studying business and marketing related topics, approaching the correct conclusions and keeping a track on business growth. Make an outstanding presentation for your viewers with this unique PPT slide and deliver your message in an effective manner using Big data analytics Powerpoint Presentation slide and make your pathways more defining. Most of the elements of the slide are highly customizable. The text boxes help you in adding more information about the point mentioned and its associated icon. Every detail in our Big Data Analytics Powerpoint Presentation Slide is doubly cross checked. You can be certain of it's authenticity.


-

- Google Slides is a new FREE Presentation software from Google.
- All our content is 100% compatible with Google Slides.
- Just download our designs, and upload them to Google Slides and they will work automatically.
- Amaze your audience with SlideTeam and Google Slides.
-

Want Changes to This PPT Slide? Check out our Presentation Design Services
-

- WideScreen Aspect ratio is becoming a very popular format. When you download this product, the downloaded ZIP will contain this product in both standard and widescreen format.
-

- Some older products that we have may only be in standard format, but they can easily be converted to widescreen.
- To do this, please open the SlideTeam product in Powerpoint, and go to
- Design ( On the top bar) -> Page Setup -> and select "On-screen Show (16:9)” in the drop down for "Slides Sized for".
- The slide or theme will change to widescreen, and all graphics will adjust automatically. You can similarly convert our content to any other desired screen aspect ratio.
Compatible With Google Slides

Get This In WideScreen
You must be logged in to download this presentation.


Do you want to remove this product from your favourites?
PowerPoint presentation slides
Hassle free, simple and fast download. Thoroughly modifiable text as per your need. It allows you to alter the color schemes and contrast to suit the contextual requirement and personalize in respect to logo change and including your trademark. Absolutely editable orientation along with size of PPT icons. No change in the original resolution of presentation images post editing.

People who downloaded this PowerPoint presentation also viewed the following :
Content of this Powerpoint Presentation
Analyzing and interpreting complex data sets is the core of an organization’s success in today’s data-driven world!
In a world of technology, organizations often seek to derive information from the large chunk of data around the internet to make valuable decisions. Big data analytics play a crucial role in uncovering the correlations and trends to enhance the overall performance of their products or services.
Ever thought about Turning Big Data Analytics to Knowledge? Explore our PPT slides to dig deep about this and its benefits!
Every company analyzes the data in today’s landscape and needs to interpret it to make data-driven decisions. Through our customizable PPT slides, you can easily demonstrate the sources of big data, differentiate between big data and small data, big data technologies and workflow, phases of big data, forms of big data, data analytics process, and impact of big data.
Data analysis is a complex and dynamic process, and keeping tabs on different online platforms is essential to derive the desired analysis. Cleansing, aggregating, and manipulating data is an overwrought process, and SlideTeam’s PPT Templates will help you differentiate and analyze the data more effectively and efficiently.
Click to get all Big Data Analytics templates demonstrating the latest trends and challenges!!
Template 1: What is Big Data?
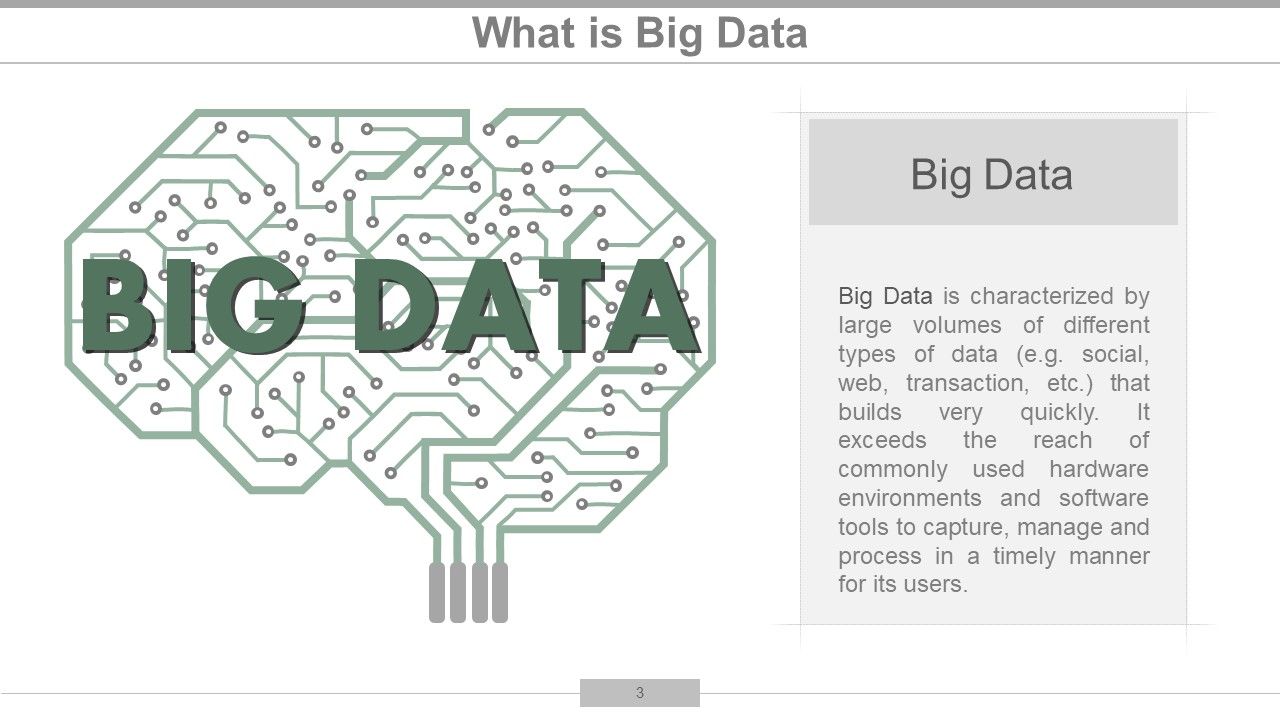
This introductory slide will help the organizations provide an overview of big data. As mentioned before, big data analytics plays a crucial role in the decision-making process of various organizations, and having customizable PowerPoint Templates to demonstrate the status of the analytics report is a significant time-saving asset. It includes captivating graphics and additional space to add information to describe big data.
Template 2: Big Data Facts-How Big is Big Data
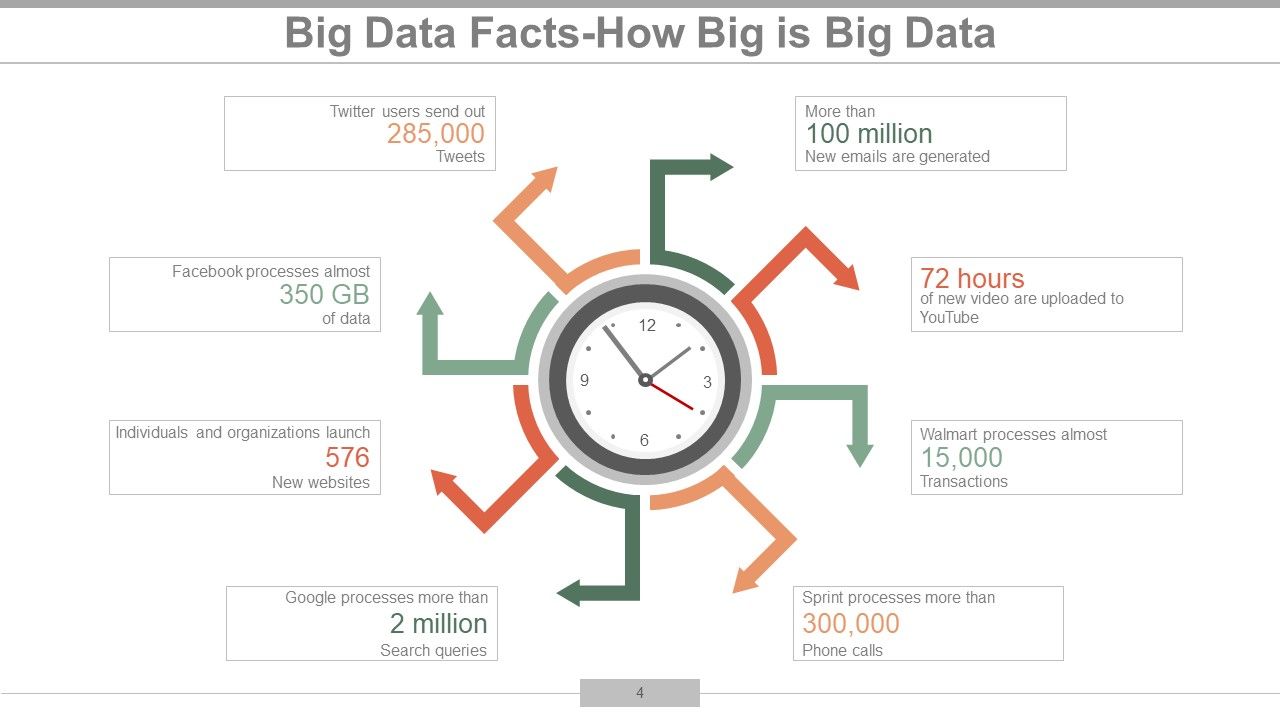
Closing monitoring of the various platforms is one of the critical steps in analyzing data. This template will help you provide an overview of multiple platforms, such as Google, Facebook, Twitter, Walmart, Youtube, Email, and others on which the business depends. You can also mention the number of queries generated and tweets sent with creative graphics. Tracking the numbers plays a significant role while analyzing big data, and these templates will help you get an accessible overview.
Template 3: How big is Big Data

Regular surveillance is deeply intricate at the core of extensive data analytics surveillance. The total number of emails sent every second, data consumed by households each day, video uploaded to YouTube every minute, data per day processed by Google, Tweets per day, total minutes spent on Facebook each month, data sent and received by mobile users, and products ordered on amazon per second can be highlighted through the creative graphics through this template.
Template 4: Sources of Big Data
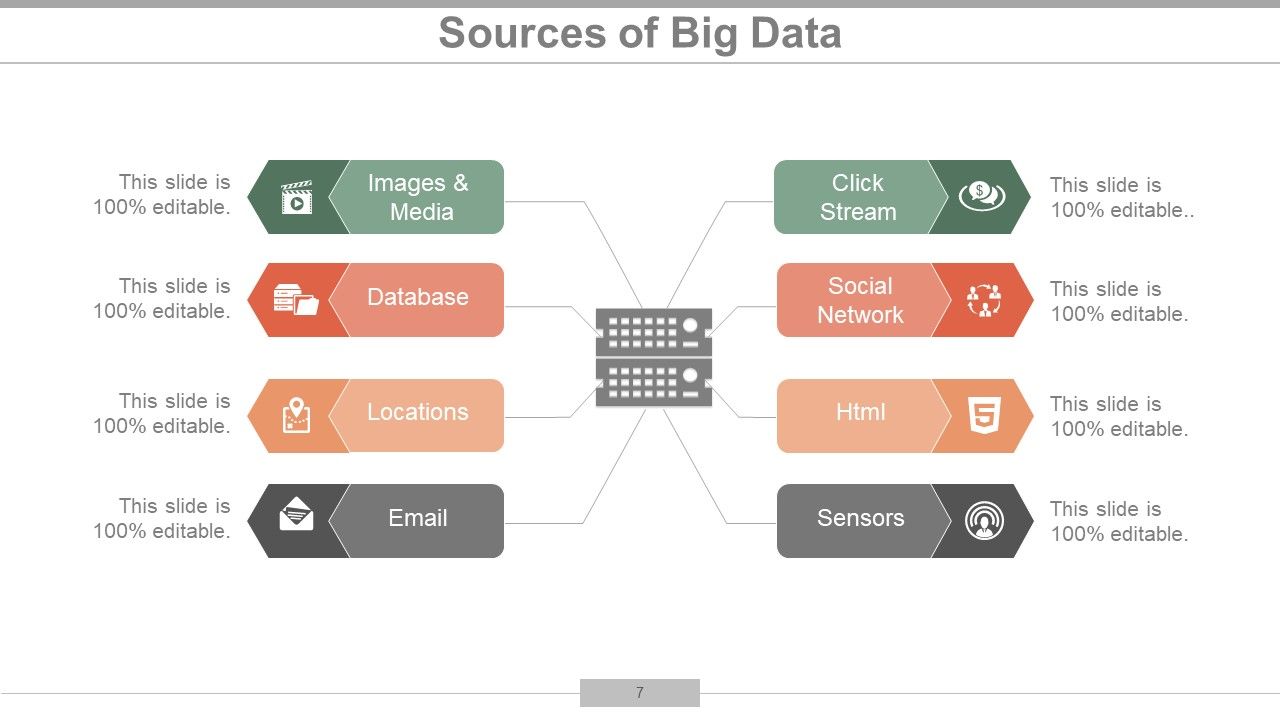
Mentioning the sources of big data also helps you create the best extensive data analytics report. This template allows you to add sources like Email, Sensors, HTML, Networks, Locations, ClickStream, Images & Media, Social Networks, Databases, and Images & Media. The color scheme and innovative icons help to make this template attractive.
Template 5: 3 Vs of Big Data
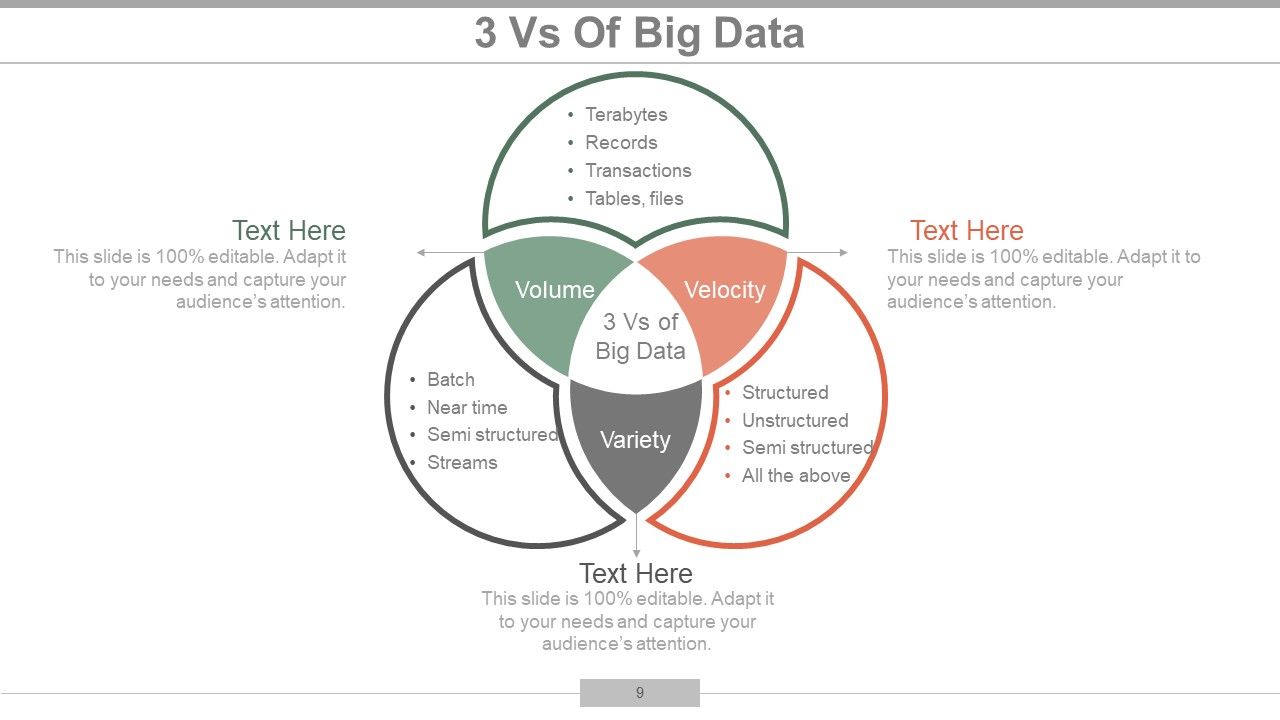
Volume, Velocity, and Variety are the three important Vs of Big Data. This slide demonstrates the sub-parts of them, such as terabytes, records, transactions, tables, files, batch, near time, streams, structured, unstructured, and semi-structured. Careful thought has been given to making the template visually attractive and attention-grabbing.
Template 6: 5 Vs of Big Data
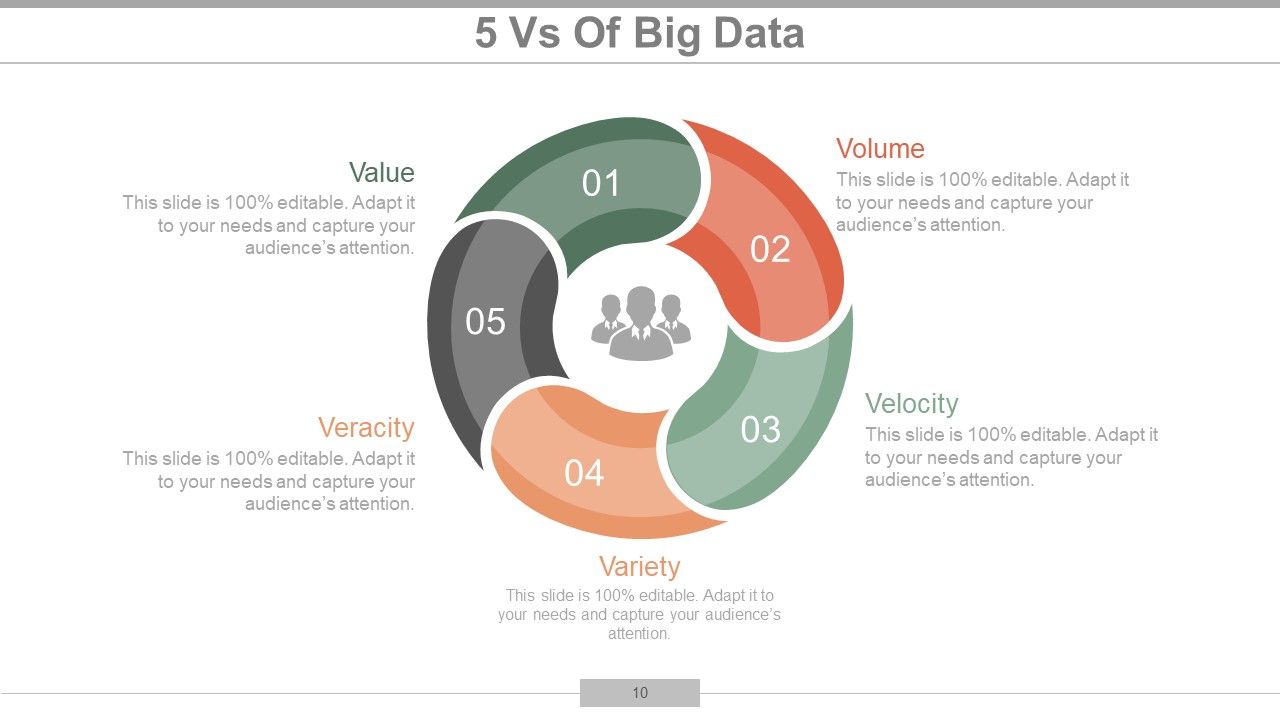
This template helps you demonstrate the 5Vs of Big Data to easily understand its big challenges. It helps you represent Value, Volume, Veracity, Velocity, and Variety. Understanding the 5Vs is important for further discussing strategies and technologies so that organizations can implement steps to get information from online data to grow their business.
Template 7: Small Data Vs Big Data
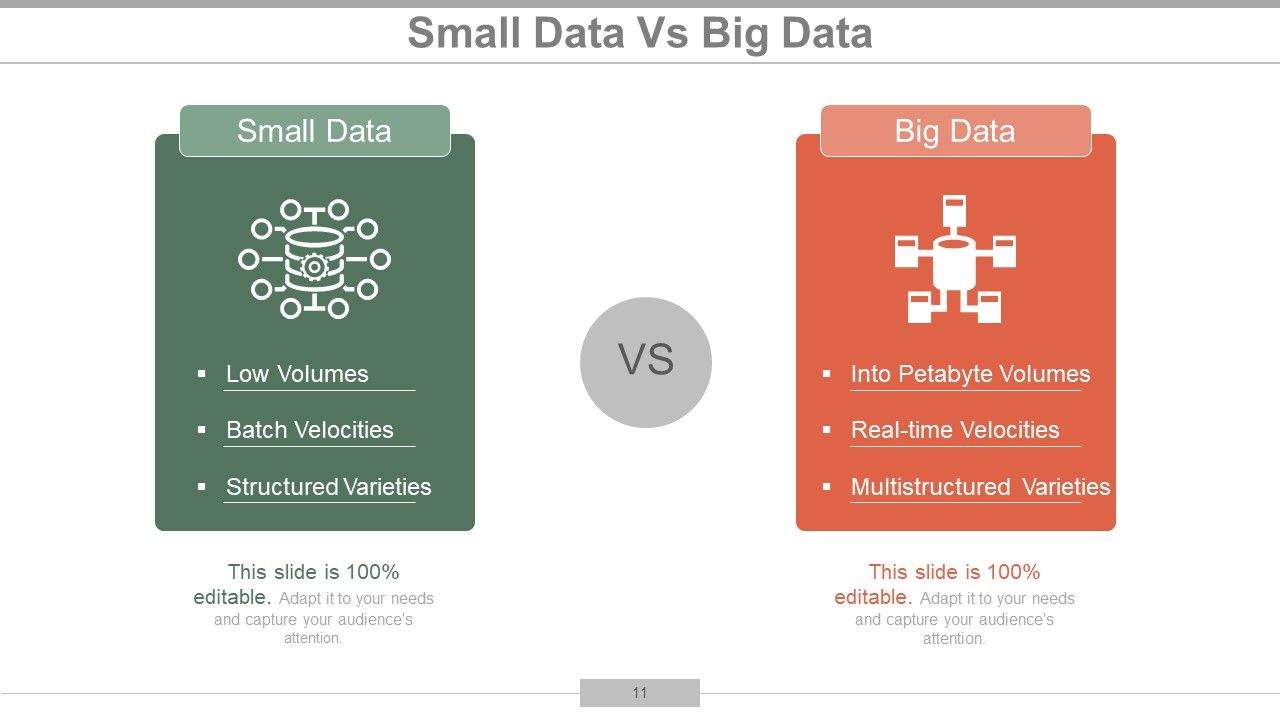
Understanding the difference between small and big data is crucial to extracting valuable insights online and making informed decisions. This template will certainly help. You can perfectly explain the difference between big and small data. This PPT slide easily explains the key differences, challenges, and opportunities.
Template 8: Objectives of Big Data
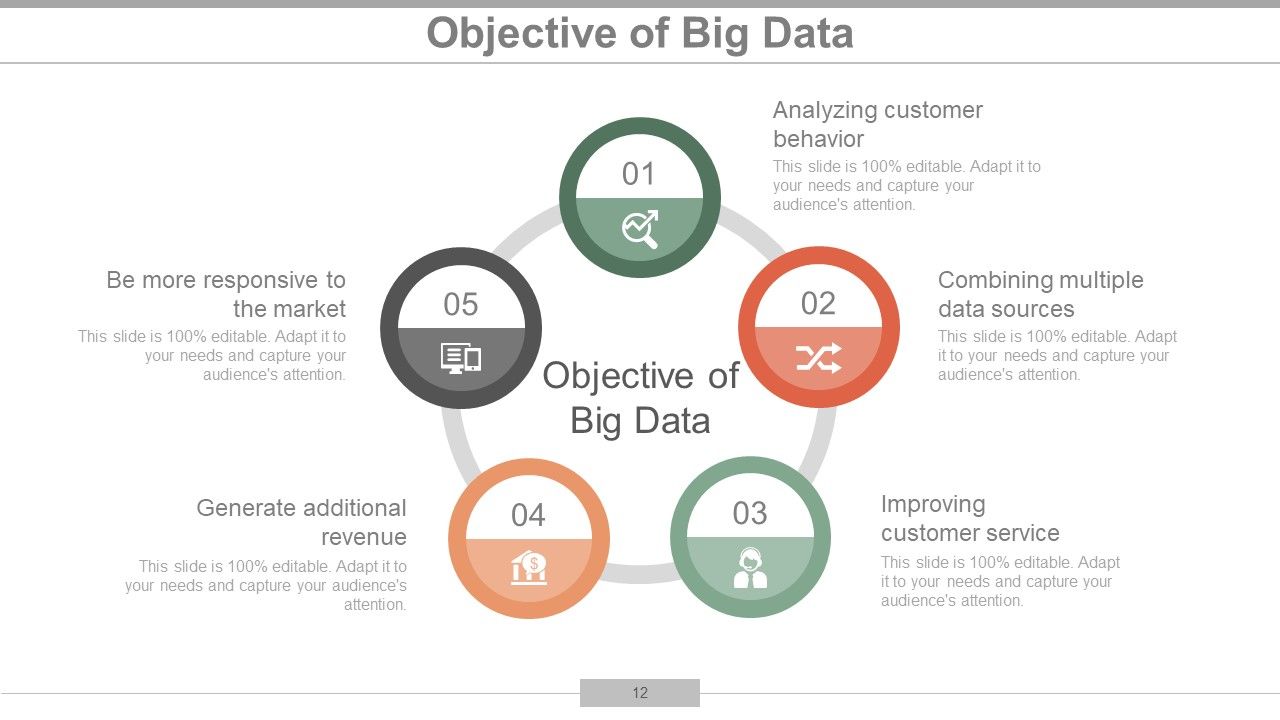
The objectives of big data are multifaceted, and this template will help you understand from analyzing customer behavior, combining multiple data sources, improving customer service, generating additional revenue, and being more responsive to the market with impressive icons for each objective. Use it to understand data analytics objectives better, ultimately leading to improved decision-making, enhancing operational efficiency, identifying trends and patterns, and driving innovation.
Template 9: Big Data Technologies
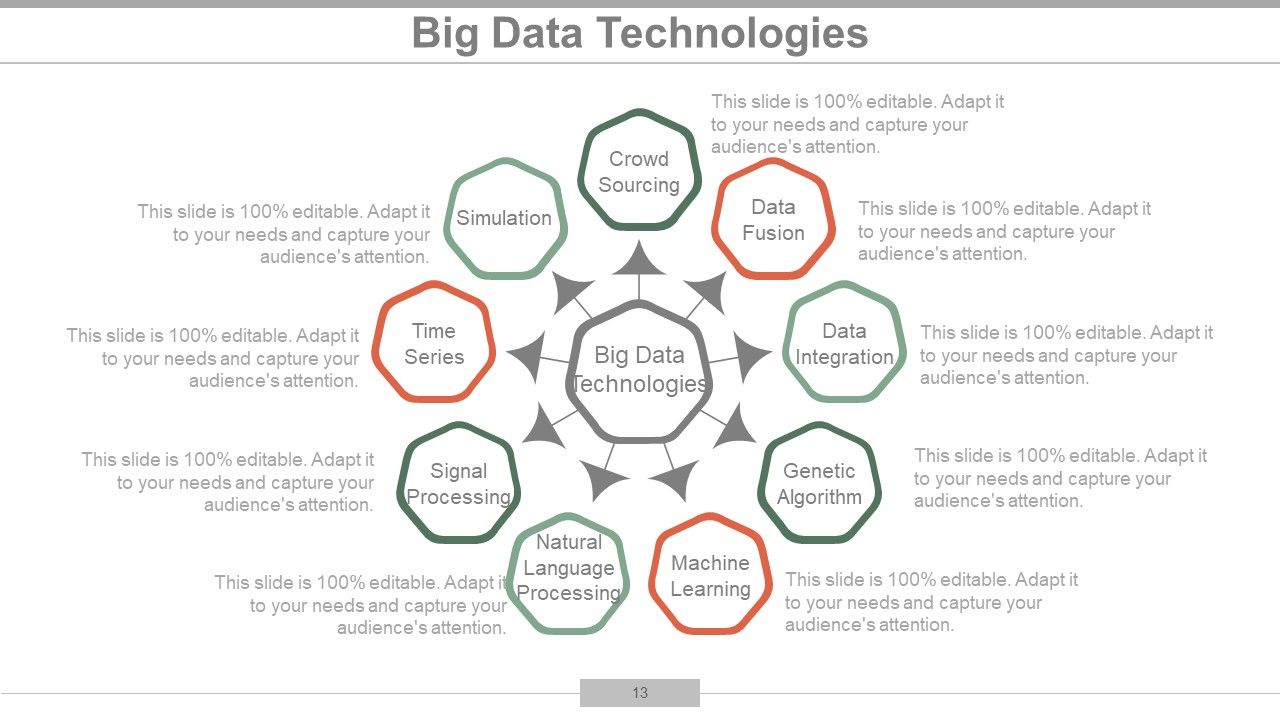
In our era, organizations are turning to big data technologies to derive information to widen their business's audience. Through this template, you can easily demonstrate big data technologies, including data integration, genetic algorithms, machine learning, natural language processing, signal processing, time series, simulation, and crowd-sourcing.
Template 10: Forms/ Type of Big Data
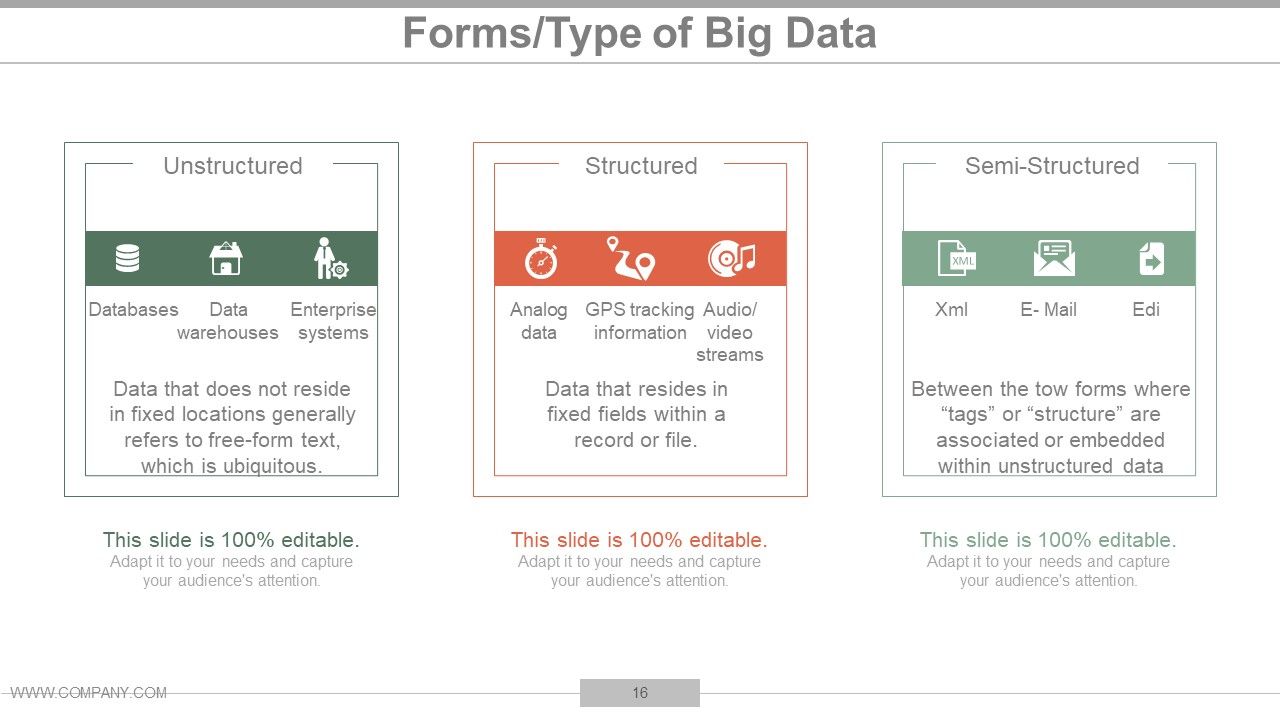
Closely explain the forms of significant data types with this template. Three columns are designed for each kind: unstructured, structured, and semi-structured. The creative icons will help to easily define the work and functions of each type. For instance, unstructured types include databases, data warehouses, and enterprise systems. Similarly, the structured type comprises analog data, audio/video streams, and GPS tracking information. As these are editable templates, you can easily add information according to your requirements.
Big Data Analysis is a powerful tool that drives an organization or business toward success. As industries enjoy the benefits of this analysis, demand is growing. It will be better for companies to derive useful information from Big Data Analytics and keep track of them. That’s when our customizable PPT templates come into the picture. These ready-to-use PPT slides will undoubtedly give you an understanding of Big Data Analytics and valuable insights to enhance decision-making and improve operational efficiency.
P.S. Click to explore the whole bundle of templates for Project Proposals for Big Data Analytics!!
Big Data Analytics Powerpoint Presentation Slide with all 50 slides:
Equip folks for the journey with our Big Data Analytics Powerpoint Presentation Slide. Jot down all the items to carry.
-
Out of the box and creative design.
-
Unique design & color.
