Finance PowerPoint Templates, Presentation Slide Diagrams & PPT Graphics
- Sub Categories
-
- 30 60 90 Day Plan
- Advertising
- Agile Development
- Aims and Objectives
- Arrows
- Before and After
- Blockchain Bitcoin
- Boxes
- Business
- Calender
- Case Study
- Celebrations
- Certificates
- Challenges Opportunities
- Channel Distribution
- Children
- Communication
- Competitive Landscape
- Computer
- Concepts
- Construction Management
- Corporate
- Crowdfunding
- Current State Future State
- Custom PowerPoint Diagrams
- Digital Transformation
- Dos and Donts
- Economics
- Education
- Environment
- Events
- Festival
- Finance
- Financials
- Food
- Game
- Gap Analysis
- Generic
- Geographical
- Health
- Heatmaps
- Holidays
- Icons
- Input Process Output
- Internet
- Key Messages
- Key Wins
- Ladder
- Leadership
- Lists
- Lucky Draw
- Management
- Marketing
- Measuring
- Medical
- Music
- News
- Next Steps
- People Process Technology
- Pillars
- Planning
- Post-it-Notes
- Problem Statement
- Process
- Proposal Management
- Pros and Cons
- Puzzle
- Puzzles
- Recruitment Strategy
- Religion
- Research and Development
- Risk Mitigation Strategies
- Roadmap
- Selling
- Shapes
- Short Term Long Term
- Social
- Stairs
- Start Stop Continue
- Strategy
- Symbol
- Technology
- Thesis Defense Dissertation
- Timelines
- Traffic
- Transition Plan
- Transportation
- Vehicles
- Venture Capital Funding
- Warning
- Winners
- Word Cloud
-
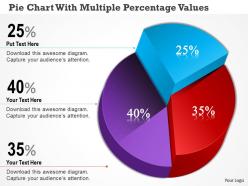 Bm pie chart with multiple percentage values powerpoint template
Straightforward download in quick and easy steps. Fully editable text as per your need and no limits on title or subtitle length. PPT infographics with absolutely modifiable size and orientation. Converts seamlessly into PDF or JPG format and runs with any software. Insert your company name, trademark, logo, tagline etc.
-
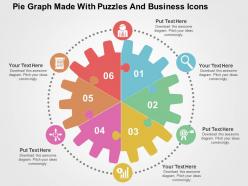 Pie graph made with puzzles and business icons flat powerpoint design
Superior resolution pictures and the slide symbols. Access to alter and redo according to your business prerequisite. Permit its clients to open on a wide screen show without trading off with the nature of the symbols. Procedure agreeable slide designs. Perfect to be utilized with the Google Slides. Simple to download and spare in the organization you like. It is valuable for the advertising experts, business directors and the business system fashioners.
-
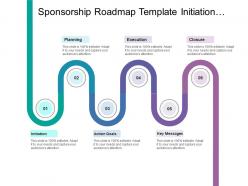 Sponsorship roadmap template initiation action goals key messages
Presenting this set of slides with name - Sponsorship Roadmap Template Initiation Action Goals Key Messages. This is a six stage process. The stages in this process are Sponsorship Roadmap Template, Sponsorship Timeline Template, Sponsorship Linear Process Template.
-
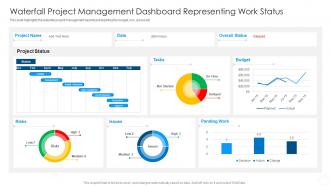 Waterfall Project Management Dashboard Representing Work Status
This slide highlights the waterfall project management dashboard depicting the budget, risk, issues etc. Introducing our Waterfall Project Management Dashboard Representing Work Status set of slides. The topics discussed in these slides are Waterfall Project Management Dashboard Representing Work Status. This is an immediately available PowerPoint presentation that can be conveniently customized. Download it and convince your audience.
-
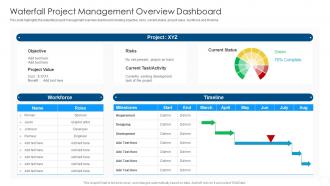 Waterfall Project Management Overview Dashboard
This slide highlights the waterfall project management overview dashboard showing objective, risks, current status, project value, workforce and timeline. Introducing our Waterfall Project Management Overview Dashboard set of slides. The topics discussed in these slides are Waterfall Project Management Overview Dashboard. This is an immediately available PowerPoint presentation that can be conveniently customized. Download it and convince your audience.
-
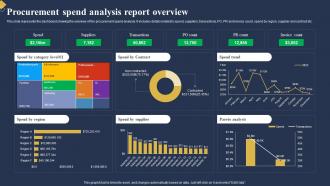 Procurement Spend Analysis Report Overview
This slide represents the dashboard showing the overview of the procurement spend analysis. It includes details related to spend, suppliers, transactions, PO, PR and invoice count, spend by region, supplier and contract etc. Introducing our Procurement Spend Analysis Report Overview set of slides. The topics discussed in these slides are Spend By Region, Spend By Supplier, Pareto Analysis. This is an immediately available PowerPoint presentation that can be conveniently customized. Download it and convince your audience.
-
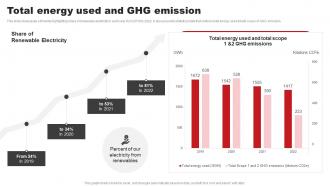 Total Energy Used And Ghg Emission ABB Company Profile CP SS
This slide showcases a timeline highlighting share of renewable electricity in each year from 2019 to 2022. It also presents statistical data that outlines total energy used and total scope of GHG emission. Present the topic in a bit more detail with this Total Energy Used And Ghg Emission ABB Company Profile CP SS. Use it as a tool for discussion and navigation on Share Renewable Electricity, Percent Our, Electricity Renewables. This template is free to edit as deemed fit for your organization. Therefore download it now.
-
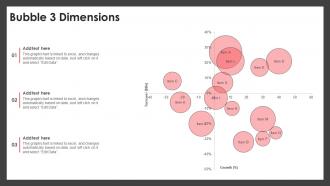 Bubble 3 Dimensions PU CHART SS
Introducing our Bubble 3 Dimensions PU CHART SS set of slides. The topics discussed in these slides are Bubbles 4 Dimensions. This is an immediately available PowerPoint presentation that can be conveniently customized. Download it and convince your audience.
-
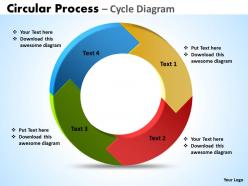 Circular process cycle diagram 4 stages powerpoint slides templates
Use this Recycle based PowerPoint Diagram to elaborate four interconnected issues which performs their actions in cycle. This diagram provides an overview of the interactions of different factors in a company. This can be used for presentations on arrow, art, bright, calendar, chart, circle, circular, clip, clipart, collection, daily, graph, graphic, illustration, isolated, menu, process etc.
-
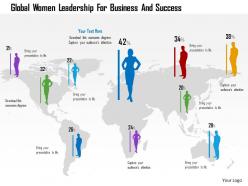 Global women leadership for business and success powerpoint template
We are proud to present our global women leadership for business and success powerpoint template. Concept of global women leadership with success can be explained in any presentation with this professional PPT diagram. This PPT diagram contains the graphic of world map and women icons. Use this PPT diagram for women empowerment and social communication related presentations.
-
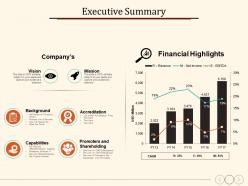 Executive summary background accreditation capabilities vision mission
Presenting this set of slides with name - Executive Summary Background Accreditation Capabilities Vision Mission. This is a four stage process. The stages in this process are Background, Accreditation, Capabilities, Vision, Mission.
-
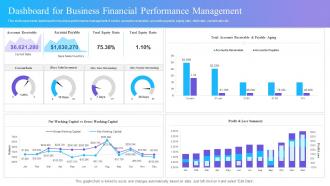 Dashboard For Business Financial Performance Management
This slide represents dashboard for business performance management. It covers accounts receivable, accounts payable, equity ratio, debt ratio, current ratio etc. Introducing our Dashboard For Business Financial Performance Management set of slides. The topics discussed in these slides are Dashboard, Business Financial, Performance Management. This is an immediately available PowerPoint presentation that can be conveniently customized. Download it and convince your audience.
-
 0514 to do list powerpoint presentation
Straightforward download and effortlessly adaptable into JPEG and PDF. PowerPoint slide crafted with high quality images and designs. Presentation design can be easily modified i.e. colour and font. Alternate to share the PPT template in standard and widescreen view. Design can be obtain with different nodes and stages. Adjustable presentation visual as companionable with Google slides. Helpful for business managers, industry professionals, project supervisors, scholars etc.
-
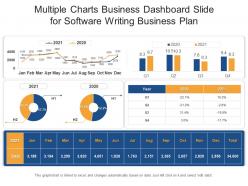 Multiple charts business dashboard slide for software writing business plan powerpoint template
If you are looking for a perfect template to display metrics and insights, then this template titled Multiple Charts Business Dashboard Slide For Software Writing Business Plan Powerpoint Template is the best choice. Deploy this PowerPoint presentation slide to evaluate the status of a campaign or identify different trends that affect the working culture of your organization. It offers a well-structured layout with many graphical representations to display real-time information. Our PPT slide can also be used as a measurement and comparison tool to weigh in different prospects in achieving your end goal. Additionally, this is a very useful set to share with higher authorities to help them make informed decisions based on analytical data and insights. The biggest advantage of this PowerPoint layout is that it has built-in features and graphics that make it easy to modify. Therefore, grab it now
-
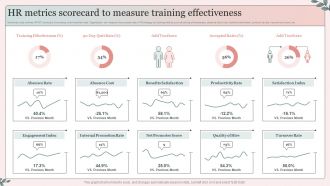 HR Metrics Scorecard To Measure Training Effectiveness
Mentioned slide outlines HR KPI scorecard showcasing most important kpis. Organization can measure the success rate of HR strategy by tracking metrics such as training effectiveness, absence rate and cost, benefits satisfaction, productivity rate, net promotor score, etc. Presenting our well-structured HR Metrics Scorecard To Measure Training Effectiveness. The topics discussed in this slide are HR Metrics, Scorecard, Measure, Training Effectiveness. This is an instantly available PowerPoint presentation that can be edited conveniently. Download it right away and captivate your audience.
-
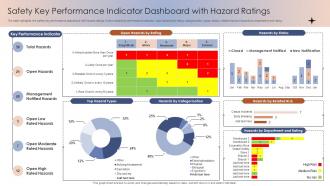 Safety Key Performance Indicator Dashboard Snapshot With Hazard Ratings
The slide highlights the safety key performance dashboard snapshot with hazard ratings. It showcases key performance indicator, open hazards by rating, categorization, types, status, related risk and hazards by department and rating Introducing our Safety Key Performance Indicator Dashboard With Hazard Ratings set of slides. The topics discussed in these slides are Safety, Key Performance Indicator, Dashboard, Hazard Ratings. This is an immediately available PowerPoint presentation that can be conveniently customized. Download it and convince your audience.
-
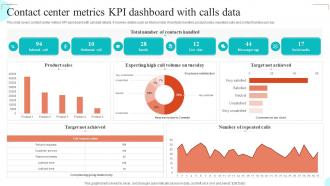 Contact Center Metrics KPI Dashboard With Calls Data
This slide covers contact center metrics KPI dashboard with call data details. It involves details such as total number of contacts handled, product sales, repeated calls and contact handles per day. Presenting our well structured Contact Center Metrics KPI Dashboard With Calls Data The topics discussed in this slide are Product Sales, Target Not Achieved, Contacts Handled This is an instantly available PowerPoint presentation that can be edited conveniently. Download it right away and captivate your audience.
-
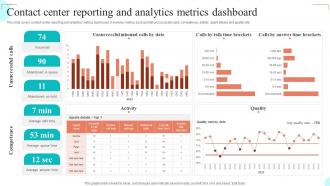 Contact Center Reporting And Analytics Metrics Dashboard
This slide covers contact center reporting and analytics metrics dashboard. It involves metrics such as total unsuccessful calls, competence, activity, agent details and quality rate. Introducing our Contact Center Reporting And Analytics Metrics Dashboard set of slides. The topics discussed in these slides are Unsuccessful Inbound, Talk Time Brackets, Answer Time Brackets This is an immediately available PowerPoint presentation that can be conveniently customized. Download it and convince your audience.
-
 Four staged colored banner for business data flat powerpoint design
Wonderfully crafted PPT design templates suitable for different business professionals and management scholars, Detailed and appropriate PPT Images with supple data alternate, Feasible Downloading flexibility hence time savings, Fully harmonious with all the graphic software available and all Google slides, revamp able background images, styles, texts, colors, fonts etc.
-
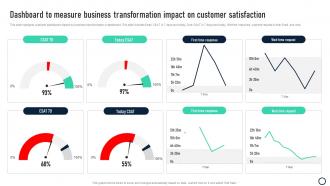 Dashboard To Measure Business Transformation Impact On Customer Satisfaction
This slide highlights customer satisfaction impact by business transformation in dashboard. This slide includes Email CSAT in 7 days and today, Chat CSAT in 7 days and today, first time response, wait time request in both Email and chat. Introducing our Dashboard To Measure Business Transformation Impact On Customer Satisfaction set of slides. The topics discussed in these slides are Dashboard Measure Business Transformation Impact, Customer Satisfaction This is an immediately available PowerPoint presentation that can be conveniently customized. Download it and convince your audience.
-
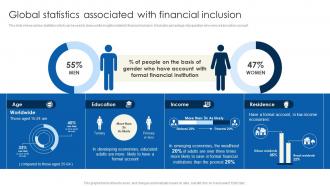 Global Statistics Associated Financial Inclusion To Promote Economic Fin SS
This slide shows various statistics which can be used to draw useful insights related to financial inclusion. It includes percentage of population who owns a transaction account. Present the topic in a bit more detail with this Global Statistics Associated Financial Inclusion To Promote Economic Fin SS. Use it as a tool for discussion and navigation on Education, Income, Residence. This template is free to edit as deemed fit for your organization. Therefore download it now.
-
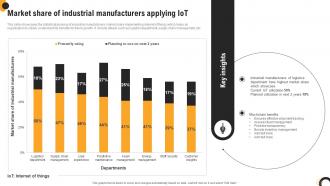 Market Share Of Industrial Manufacturers Applying Iot
This slide showcases the statistical analysis of industrial manufacturers market share implementing internet of things which helps an organization to clearly understand its benefits for future growth. It include details such as logistics department, supply chain management, etc. Presenting our well structured Market Share Of Industrial Manufacturers Applying IoT. The topics discussed in this slide are Industrial Manufacturers, Blockchain Benefits, Internet Of Things. This is an instantly available PowerPoint presentation that can be edited conveniently. Download it right away and captivate your audience.
-
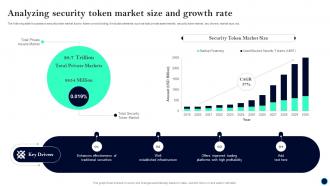 Analyzing Security Token Beginners Guide To Successfully Launch Security Token BCT SS V
The following slide focusses on security token market size to foster crowd funding. It includes elements such as total private asset market, security token market, key drivers, market size, etc. Deliver an outstanding presentation on the topic using this Analyzing Security Token Beginners Guide To Successfully Launch Security Token BCT SS V. Dispense information and present a thorough explanation of Security Token, Market Size, Key Drivers using the slides given. This template can be altered and personalized to fit your needs. It is also available for immediate download. So grab it now.
-
 Competitive analysis chart with bubbles
Presenting this set of slides with name Competitive Analysis Chart With Bubbles. The topics discussed in these slides are Sales, Month, Competitor, Price Millions. This is a completely editable PowerPoint presentation and is available for immediate download. Download now and impress your audience.
-
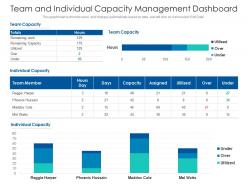 Team and individual capacity management dashboard
This graph or chart is linked to excel, and changes automatically based on data. Just left click on it and select Edit Data. Introducing our Team And Individual Capacity Management Dashboard set of slides. The topics discussed in these slides are Team Capacity, Team Member, Individual Capacity. This is an immediately available PowerPoint presentation that can be conveniently customized. Download it and convince your audience.
-
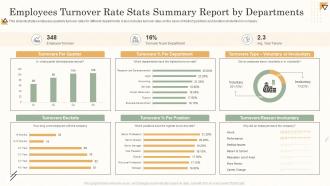 Employees Turnover Rate Stats Summary Report By Departments
This slide illustrates employees quarterly turnover rates for different departments. It also includes turnover rates on the basis of distinct positions and duration of retention in company. Presenting our well structured Employees Turnover Rate Stats Summary Report By Departments. The topics discussed in this slide are Employees Turnover, Rate Stats Summary, Report By Departments. This is an instantly available PowerPoint presentation that can be edited conveniently. Download it right away and captivate your audience.
-
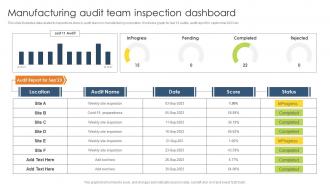 Manufacturing Audit Team Inspection Dashboard
This slide illustrates data related to inspections done by audit teams in manufacturing corporation. It includes graph for last 10 audits, audit report for september 2023 etc. Introducing our Manufacturing Audit Team Inspection Dashboard set of slides. The topics discussed in these slides are Manufacturing, Audit Team Inspection, Dashboard. This is an immediately available PowerPoint presentation that can be conveniently customized. Download it and convince your audience.
-
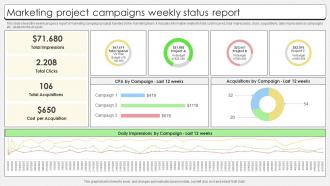 Marketing Project Campaigns Weekly Status Report
This slide shows the weekly progress report of marketing campaign projects handled by the marketing team. It includes information related to total cost incurred, total impressions, clicks, acquisitions, daily impressions by campaigns etc. related to the projects. Introducing our Marketing Project Campaigns Weekly Status Report set of slides. The topics discussed in these slides are Marketing Project, Campaigns Weekly, Status Report. This is an immediately available PowerPoint presentation that can be conveniently customized. Download it and convince your audience.
-
 3d currency symbols powerpoint presentation slides
Communicate emphatically with your audience to convey your Business Finance message with maximum effect with our 3D Currency symbols Powerpoint visuals and graphics. Our 3D Currency Power Powerpoint slides, templates and diagrams are ideal for you to visually support your ideas in your Global Business, Finance, Security, Purchasing, Earnings, Budget and Stock Prices PPT presentations, Global Business Ideas, Solutions, Marketing Targets, Productivity and Growth Sales and profit PPT slideshows, Global Business Franchise, Strategy, Mergers, Takeover and Integration Powerpoint presentations, Business Operational process, Performance Improvement, Automations and Cost Reduction PPT slideshows, and all financial transactions in your Architecture, Computer, Medical, Manufacturing, Industrial, Technology, Music, Digital Multimedia, Construction, Real Estate, Internet, Transportation and Tourism Industry Powerpoint presentations.
-
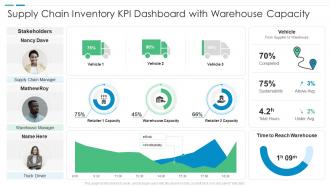 Supply chain inventory kpi dashboard with warehouse capacity
Introducing our Supply Chain Inventory KPI Dashboard With Warehouse Capacity set of slides. The topics discussed in these slides are Supply Chain Inventory KPI Dashboard With Warehouse Capacity. This is an immediately available PowerPoint presentation that can be conveniently customized. Download it and convince your audience.
-
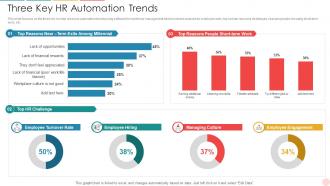 Three Key HR Automation Trends
This slide focuses on the three key human resource automation trends using software for workforce management which includes reasons for employee exits, top human resource challenges, reasons people choosing short-term work, etc. Introducing our Three Key HR Automation Trends set of slides. The topics discussed in these slides are Employee Turnover Rate, Employee Hiring, Managing Culture, Employee Engagement. This is an immediately available PowerPoint presentation that can be conveniently customized. Download it and convince your audience.
-
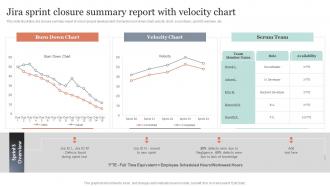 Jira Sprint Closure Summary Report With Velocity Chart
This slide illustrates Jira closure summary report of scrum project development. It includes burn down chart, velocity chart, scrum team, sprint S overview, etc. Presenting our well structured Jira Sprint Closure Summary Report With Velocity Chart. The topics discussed in this slide are Burn Down Chart, Velocity Chart, Scrum Team. This is an instantly available PowerPoint presentation that can be edited conveniently. Download it right away and captivate your audience.
-
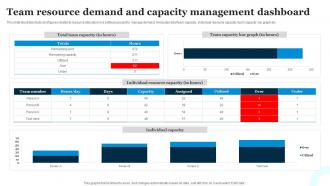 Team Resource Demand And Capacity Management Dashboard
This slide illustrates facts and figures related to resource allocation in a software project to manage demand. It includes total team capacity, individual resource capacity, team capacity bar graph etc. Presenting our well structured Team Resource Demand And Capacity Management Dashboard. The topics discussed in this slide are Team Resource, Capacity Management Dashboard, Individual Capacity. This is an instantly available PowerPoint presentation that can be edited conveniently. Download it right away and captivate your audience.
-
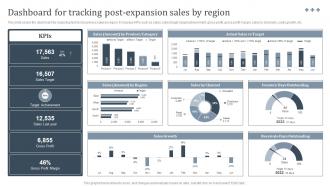 Dashboard For Tracking International Strategy To Expand Global Strategy SS V
This slide covers the dashboard for analyzing fast food business sales by region. It includes KPIs such as sales, sales target, target achievement, gross profit, gross profit margin, sales by channels, sales growth, etc. Deliver an outstanding presentation on the topic using this Dashboard For Tracking International Strategy To Expand Global Strategy SS V. Dispense information and present a thorough explanation of Tracking, Sales, Actual using the slides given. This template can be altered and personalized to fit your needs. It is also available for immediate download. So grab it now.
-
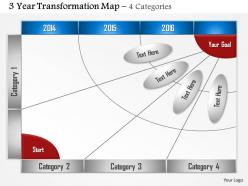 0514 4 category 3 year transformation map
Easily editable presentation layout as color, text and font are editable. Proficiently shaped PowerPoint diagram. PowerPoint designs are totally compatible with Google slides. Effortlessly download and changeable into JPEG and PDF document. Choice of insertion of corporate symbol and image for personalization. Presentable and easy to comprehend info graphic format. PPT slide can be presented in both standard and widescreen view. Suitable for financiers, investors, entrepreneurs, finance managers, economist, executives etc.
-
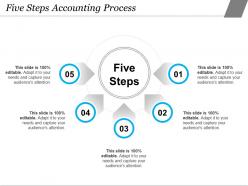 Five steps accounting process
Presenting this set of slides with name - Five Steps Accounting Process. This is a five stage process. The stages in this process are Accounting Process, Accounting Cycle, Accounting Management.
-
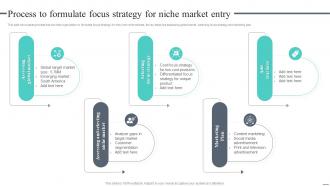 Process To Formulate Focus Cost Leadership Strategy Offer Low Priced Products Niche Market
This slide showcases process that can help organization to formulate focus strategy for entry into niche markets. Its key steps are assessing global market, selecting focus strategy and marketing plan.Introducing Process To Formulate Focus Cost Leadership Strategy Offer Low Priced Products Niche Market to increase your presentation threshold. Encompassed with five stages, this template is a great option to educate and entice your audience. Dispence information on Target Market, Emerging Market, Differentiated Focus, using this template. Grab it now to reap its full benefits.
-
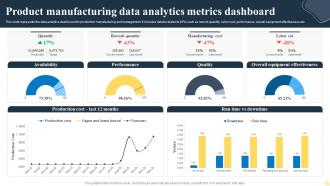 Product Manufacturing Data Analytics Metrics Dashboard
This slide represents the data analytics dashboard for production manufacturing and management. It includes details related to KPIs such as rework quantity, labor cost, performance, overall equipment effectiveness etc. Introducing our Product Manufacturing Data Analytics Metrics Dashboard set of slides. The topics discussed in these slides are Availability, Performance, Overall Equipment Effectiveness. This is an immediately available PowerPoint presentation that can be conveniently customized. Download it and convince your audience.
-
 6 Months Digital Promotion Plan For Real Estate Agency
This slide shows activities for promoting real estate agencies among potential buyers in systematic way over half year. It include activities such as conduct market research, implement email marketing campaigns, etc. Presenting our set of slides with 6 Months Digital Promotion Plan For Real Estate Agency. This exhibits information on three stages of the process. This is an easy to edit and innovatively designed PowerPoint template. So download immediately and highlight information on Market Research Stage, Implementation Stage, Expansion Stage.
-
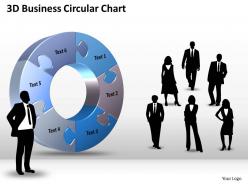 3d business circular chart powerpoint templates ppt presentation slides 0812
It is all there in bits and pieces. Individual components well researched and understood in their place. Now you need to get it all together to form the complete picture and reach the goal. You have the ideas and plans on how to go about it. Use this template to illustrate your method, piece by piece, and interlock the whole process in the minds of your audience.
-
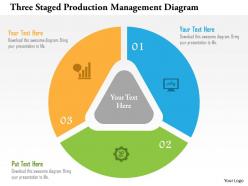 Three staged production management diagram flat powerpoint design
Runs extremely smooth and jitter-free on related software. PowerPoint images are of high resolution. Projection on widescreen doesn’t let PPT graphics to be pixelated. Fluent download of PPT slides. Further customize slide by inserting your company’s logo, trademark. Add titles and sub titles at will with no space constraints. Compatible with Google slides. Useful for startups, businesses and project management.
-
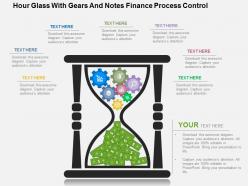 Hour glass with gears and notes finance process control flat powerpoint design
Spectacular presentation of designs and colors. Excellent quality pictures which do not pixelate when projected on wide screen. Compatibility with multiple format options like JPEG and JPG. Harmonious with numerous online and offline software options. 100 percent editable. Ease of swipe out and/or inclusion of content as per individual choice. Freedom to personalize the presentation with company name, logo and or trademark. Used by marketing professionals, financiers, strategists, students and educators.
-
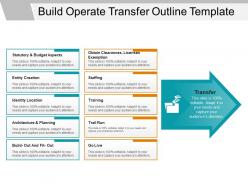 Build operate transfer outline template
Presenting Build Operate Transfer Outline Template which is completely editable. Open and save your presentation in various formats like PDF, JPG, and PNG. Freely access this slide in both 4:3 and 16:9 aspect ratio. You can modify the font, color, font size, and font types of the slides as per your needs. This template is adaptable with Google Slides which makes it easily accessible at once.
-
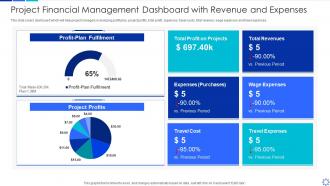 Project financial management dashboard with revenue and expenses
Introducing our Project Financial Management Dashboard With Revenue And Expenses set of slides. The topics discussed in these slides are Project Financial Management Dashboard With Revenue And Expenses. This is an immediately available PowerPoint presentation that can be conveniently customized. Download it and convince your audience.
-
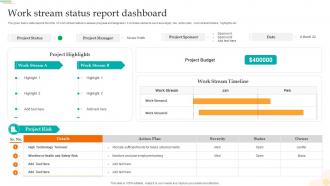 Work Stream Status Report Dashboard
The given below slide depicts the KPIs of work stream status to assess progress and stagnation. It includes elements such as budget, risk, action plan, work stream timeline, highlights etc. Introducing our Work Stream Status Report Dashboard set of slides. The topics discussed in these slides are Project Status, Project Manager, Project Sponsor. This is an immediately available PowerPoint presentation that can be conveniently customized. Download it and convince your audience.
-
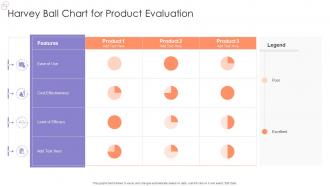 Harvey Ball Chart For Product Evaluation
Introducing our Harvey Ball Chart For Product Evaluation set of slides. The topics discussed in these slides are Level Of Efficacy, Cost Effectiveness, Features. This is an immediately available PowerPoint presentation that can be conveniently customized. Download it and convince your audience.
-
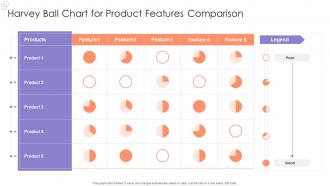 Harvey Ball Chart For Product Features Comparison
Presenting our well-structured Harvey Ball Chart For Product Features Comparison. The topics discussed in this slide are Harvey Ball Chart, Product Features Comparison. This is an instantly available PowerPoint presentation that can be edited conveniently. Download it right away and captivate your audience.
-
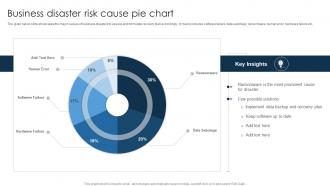 Business Disaster Risk Cause Pie Chart
The given below slide showcases the major causes of business disasters to assess and formulate recovery plan accordingly. It mainly includes software failure, data sabotage, ransomware, human error, hardware failure etc. Introducing our Business Disaster Risk Cause Pie Chart set of slides. The topics discussed in these slides are Ransomware, Few Possible Solutions, Keep Software. This is an immediately available PowerPoint presentation that can be conveniently customized. Download it and convince your audience.
-
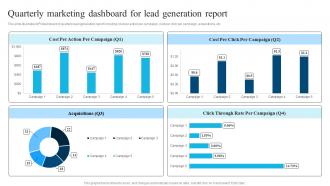 Quarterly Marketing Dashboard For Lead Generation Report
This slide illustrates KPI or dashboard of quarterly lead generation report including cost per action per campaign, cost per click per campaign, acquisitions, etc. Introducing our Quarterly Marketing Dashboard For Lead Generation Report set of slides. The topics discussed in these slides are Quarterly Marketing, Dashboard, Lead Generation Report. This is an immediately available PowerPoint presentation that can be conveniently customized. Download it and convince your audience.
-
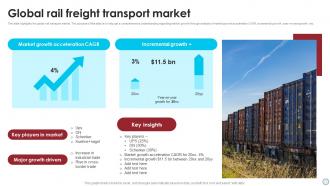 Global Rail Freight Transport Market
This slide highlights the global rail transport market. The purpose of this slide is to help get a comprehensive understanding regarding market growth through analysis of market growth acceleration CAGR, incremental growth, year-on-year growth , etc. Introducing our Global Rail Freight Transport Market set of slides. The topics discussed in these slides are Market Growth Acceleration, Incremental Growth.This is an immediately available PowerPoint presentation that can be conveniently customized. Download it and convince your audience.
-
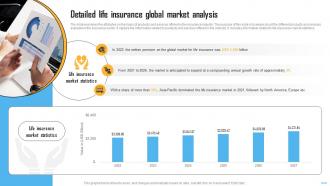 Detailed Life Insurance Global Market Analysis IR SS
The slide examines the attributes on the basis of products and services offered in the insurance industry. The purpose of this slide is to aware about the different products and services available in the insurance sector. It capture the information related to products and services offered in the industry. It includes information related to life insurance market statistics. Deliver an outstanding presentation on the topic using this Detailed Life Insurance Global Market Analysis IR SS. Dispense information and present a thorough explanation of Life Insurance, Global Market, Growth Rate using the slides given. This template can be altered and personalized to fit your needs. It is also available for immediate download. So grab it now.
-
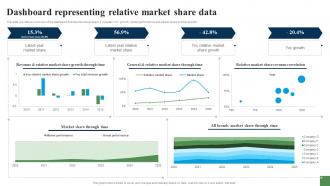 Dashboard Representing Relative Market Share Data Expanding Customer Base Through Market Strategy SS V
This slide provides an overview of the dashboard that depicts market share. It includes YOY growth, market performance and market share of other brands. Deliver an outstanding presentation on the topic using this Dashboard Representing Relative Market Share Data Expanding Customer Base Through Market Strategy SS V. Dispense information and present a thorough explanation of Market Share Through Time, Brands Market Share, Market Share Revenue Correlation using the slides given. This template can be altered and personalized to fit your needs. It is also available for immediate download. So grab it now.
-
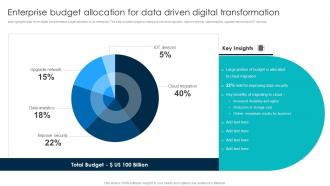 Enterprise Budget Allocation For Data Driven Digital Transformation
This slide highlights data driven digital transformation budget allocation in an enterprise. This slide includes budget on tasks such as cloud migration, improve security, data analytics, upgrade network and IOT devices. Introducing our Enterprise Budget Allocation For Data Driven Digital Transformation set of slides. The topics discussed in these slides are Deeper Customer Intelligence, Reimagined Processes, New Business Opportunities. This is an immediately available PowerPoint presentation that can be conveniently customized. Download it and convince your audience.
-
 Business idea powerpoint presentation slides
These high quality, editable pre-designed powerpoint slides have been carefully created by our professional team to help you impress your audience. Each graphic in every slide is vector based and is 100% editable in powerpoint. Each and every property of any slide - color, size, shading etc can be modified to build an effective powerpoint presentation. Use these slides to convey complex business concepts in a simplified manner. Any text can be entered at any point in the powerpoint slide. Simply DOWNLOAD, TYPE and PRESENT!
-
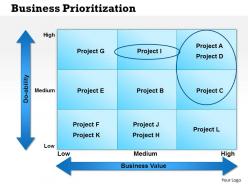 0514 business prioritization powerpoint presentation
Simple and fast download in easy steps. Change orientation and size of PPT images as per need. Insert your trademark, brand name, tagline, logo etc. for personalization. Fully editable text- add titles and subtitles of any word length. Easily convertible to JPG or PDF and runs easily with any other software too.
-
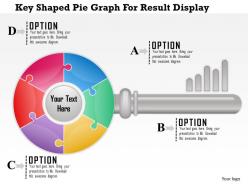 1114 key shaped pie graph for result display powerpoint template
We are proud to present our 1114 key shaped pie graph for result display powerpoint template. Key shaped pie graph has been used to decorate this power point template slide. This PPT slide contains the concept of result analysis. This result analysis can be used for business and finance processes. Use this PPT slide and build exclusive presentation for your viewers.
-
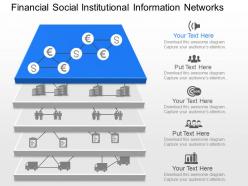 Ik financial social institutional information network powerpoint template
Presenting ik financial social institutional information network powerpoint template. This Power Point template diagram has been crafted with graphic of network diagram. This PPT diagram contains the concept of financial and social information representation. Use this PPT diagram for business and finance related presentations.
-
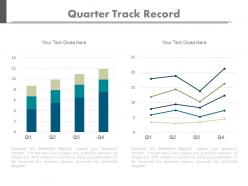 View quarter track record line chart powerpoint slides
Editable PPT Slide for viewing quarterly track record line chart. Compatible with numerous format options like JPEG, JPG or PDF. Access to inclusion and exclusion of contents as per specific needs of any business. Provides a professional outlook to your PowerPoint presentation. Beneficial for business professionals, students, teachers, business analysts and strategists. Customization of each PowerPoint graphic and text according to your desire and want. Available in Widescreen slide size also. Freedom to customize it with company name and logo.
-
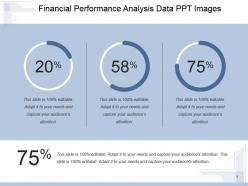 Financial performance analysis data ppt images
Presenting financial performance analysis data ppt images. This is a financial performance analysis data ppt images. This is a three stage process. The stages in this process are business, success, strategy, finance, management, analysis.
-
 Bank icons powerpoint slide background designs
Presenting this set of slides with name - Bank Icons Powerpoint Slide Background Designs. This is a four stage process. The stages in this process are Bank Icon, Finance Icons, Money Icon.


