Finance PowerPoint Templates, Presentation Slide Diagrams & PPT Graphics
- Sub Categories
-
- 30 60 90 Day Plan
- Advertising
- Agile Development
- Aims and Objectives
- Arrows
- Before and After
- Blockchain Bitcoin
- Boxes
- Business
- Calender
- Case Study
- Celebrations
- Certificates
- Challenges Opportunities
- Channel Distribution
- Children
- Communication
- Competitive Landscape
- Computer
- Concepts
- Construction Management
- Corporate
- Crowdfunding
- Current State Future State
- Custom PowerPoint Diagrams
- Digital Transformation
- Dos and Donts
- Economics
- Education
- Environment
- Events
- Festival
- Finance
- Financials
- Food
- Game
- Gap Analysis
- Generic
- Geographical
- Health
- Heatmaps
- Holidays
- Icons
- Input Process Output
- Internet
- Key Messages
- Key Wins
- Ladder
- Leadership
- Lists
- Lucky Draw
- Management
- Marketing
- Measuring
- Medical
- Music
- News
- Next Steps
- People Process Technology
- Pillars
- Planning
- Post-it-Notes
- Problem Statement
- Process
- Proposal Management
- Pros and Cons
- Puzzle
- Puzzles
- Recruitment Strategy
- Religion
- Research and Development
- Risk Mitigation Strategies
- Roadmap
- Selling
- Shapes
- Short Term Long Term
- Social
- Stairs
- Start Stop Continue
- Strategy
- Symbol
- Technology
- Thesis Defense Dissertation
- Timelines
- Traffic
- Transition Plan
- Transportation
- Vehicles
- Venture Capital Funding
- Warning
- Winners
- Word Cloud
-
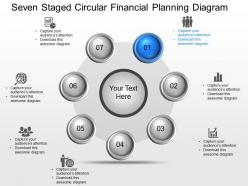 Seven staged circular financial planning diagram powerpoint template slide
Promptly conformable and downloadable PPT slides, quite suitable for finance professionals from diverse fields or areas, Editable text, font, background and PowerPoint Image, Easily convertible into PDF or JPG formats, Can be used with Google slides and on other software platforms, space option with the Presentation slide diagrams to insert the titles or subtitles as required.
-
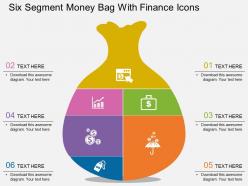 Bh six segment money bag with finance icons flat powerpoint design
Presenting bh six segment money bag with finance icons flat powerpoint design. Six segment money bag and finance icons have been used to craft this power point template diagram. This PPT diagram contains the concept of financial investment analysis. Use this PPT diagram can be used for business and finance related presentations.
-
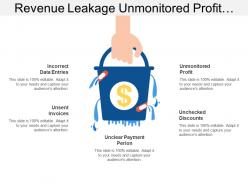 Revenue leakage unmonitored profit incorrect data entries
Presenting this set of slides with name - Revenue Leakage Unmonitored Profit Incorrect Data Entries. This is a one stage process. The stages in this process are Revenue Leakage, Capital Leakage, Income Leakage.
-
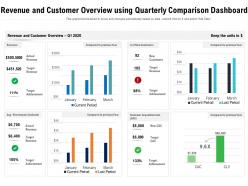 Revenue and customer overview using quarterly comparison dashboard
Presenting this set of slides with name Revenue And Customer Overview Using Quarterly Comparison Dashboard. The topics discussed in these slides are Revenue, Customer Overview, Target Achievement, Customer Acquisition Cost, Compared To Previous Year. This is a completely editable PowerPoint presentation and is available for immediate download. Download now and impress your audience.
-
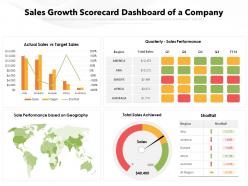 Sales growth scorecard dashboard snapshot of a company
Presenting the PowerPoint template titled Sales Growth Scorecard Dashboard Snapshot Of A Company. Use this PPT slide to deliver an informative presentation. Download it here and start editing it to match your needs. Input data and create HD visualization of graphs. You can then convert it to PNG, JPEG, and PDF formats and share and edit it with Google Slides. Avail its standard screen and widescreen sizes at the single tap.
-
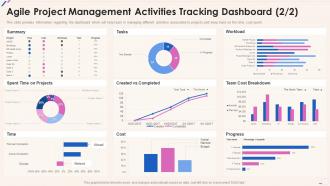 Agile Playbook Agile Project Management Activities Tracking Dashboard
This slide provides information regarding the dashboard which will help team in managing different activities associated to projects and keep track on the time, cost spent. Present the topic in a bit more detail with this Agile Playbook Agile Project Management Activities Tracking Dashboard. Use it as a tool for discussion and navigation on Workload, Spent Time On Projects, Progress, Cost, Time, Created Vs Completed. This template is free to edit as deemed fit for your organization. Therefore download it now.
-
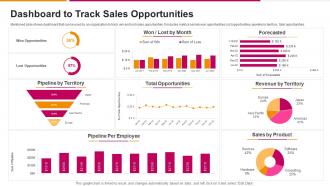 Dashboard To Track Sales Opportunities Successful Sales Strategy To Launch
Mentioned slide shows dashboard that can be used by an organization to track win and lost sales opportunities. It includes metrics namely won opportunities, lost opportunities, pipeline by territory, total opportunities. Deliver an outstanding presentation on the topic using this Dashboard To Track Sales Opportunities Successful Sales Strategy To Launch. Dispense information and present a thorough explanation of Dashboard To Track Sales Opportunities using the slides given. This template can be altered and personalized to fit your needs. It is also available for immediate download. So grab it now.
-
 ISO 9001 And QMS Dashboards ISO 9001 Quality Management Ppt Topics
This template covers Quality management system dashboard including KPIs such as risk rating, risk matrix, suppliers rating, enquires, trainings and many more. Deliver an outstanding presentation on the topic using this ISO 9001 And QMS Dashboards ISO 9001 Quality Management Ppt Topics. Dispense information and present a thorough explanation of ISO 9001 And QMS Dashboards using the slides given. This template can be altered and personalized to fit your needs. It is also available for immediate download. So grab it now.
-
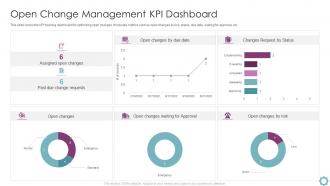 Open Change Management KPI Dashboard
This slide covers the KPI tracking dashboard for optimizing open changes. It includes metrics such as open changes by risk,status,due date,waiting for approval,etc. Introducing our Open Change Management KPI Dashboard set of slides. The topics discussed in these slides are Changes Request Status,Assigned Open Changes,Past Due,Change Requests. This is an immediately available PowerPoint presentation that can be conveniently customized. Download it and convince your audience.
-
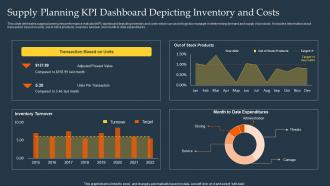 Supply Planning KPI Dashboard Depicting Inventory And Costs
This slide delineates supply planning key performance indicator KPI dashboard depicting inventory and costs which can assist logistics manager in determining demand and supply of products. It includes information about transaction based on units, out of stock products, inventory turnover and month to date expenditures. Presenting our well-structured Supply Planning KPI Dashboard Depicting Inventory And Costs. The topics discussed in this slide are Supply Planning, KPI Dashboard, Depicting Inventory, Costs. This is an instantly available PowerPoint presentation that can be edited conveniently. Download it right away and captivate your audience.
-
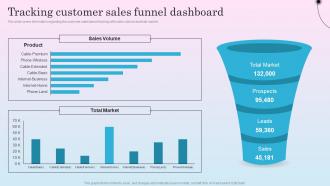 Tracking Customer Sales Funnel Dashboard Optimizing Sales Channel For Enhanced Revenues
This slide covers information regarding the customer sales funnel tracking with sales volume and total market. Deliver an outstanding presentation on the topic using this Tracking Customer Sales Funnel Dashboard Optimizing Sales Channel For Enhanced Revenues. Dispense information and present a thorough explanation of Product, Sales Volume, Total Market, Funnel Dashboard using the slides given. This template can be altered and personalized to fit your needs. It is also available for immediate download. So grab it now.
-
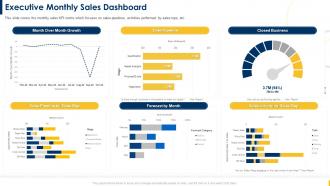 Building A Sales Territory Plan Executive Monthly Sales Dashboard
This slide covers the monthly sales KPI metric which focuses on sales pipelines, activities performed by sales reps, etc. Present the topic in a bit more detail with this Building A Sales Territory Plan Executive Monthly Sales Dashboard. Use it as a tool for discussion and navigation on Executive, Monthly Sales, Dashboard, Closed Business. This template is free to edit as deemed fit for your organization. Therefore download it now.
-
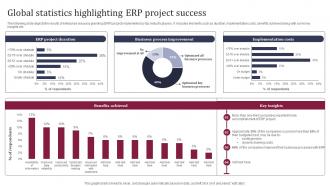 Global Statistics Highlighting ERP Project Success Enhancing Business Operations
The following slide depicts the results of enterprise resource planning ERP project implemented by top industry players. It includes elements such as duration, implementation costs, benefits achieved along with some key insights etc. Present the topic in a bit more detail with this Global Statistics Highlighting ERP Project Success Enhancing Business Operations. Use it as a tool for discussion and navigation on Project Duration, Business Process Improvement, Implementation Costs. This template is free to edit as deemed fit for your organization. Therefore download it now.
-
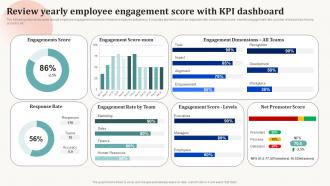 Review Yearly Employee Engagement Score Effective Employee Engagement
The following slide showcases annual employee engagement scores to measure employee activeness. It includes elements such as response rate, net promotor score, monthly engagement rate, number of responses, teams, accuracy etc. Deliver an outstanding presentation on the topic using this Review Yearly Employee Engagement Score Effective Employee Engagement. Dispense information and present a thorough explanation of Engagements Score, Engagement Score Mom, Engagement Dimensions using the slides given. This template can be altered and personalized to fit your needs. It is also available for immediate download. So grab it now.
-
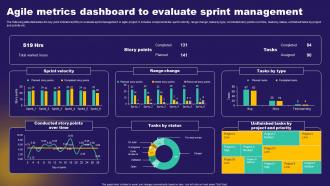 Agile Metrics Dashboard To Evaluate Sprint Management
The following slide delineates the key point indicators KPIs to evaluate sprint management in agile project. It includes components like sprint velocity, range change, tasks by type, concluded story points over time, tasks by status, unfinished tasks by project and priority etc. Introducing our Agile Metrics Dashboard To Evaluate Sprint Management set of slides. The topics discussed in these slides are Sprint Velocity, Range Change. This is an immediately available PowerPoint presentation that can be conveniently customized. Download it and convince your audience.
-
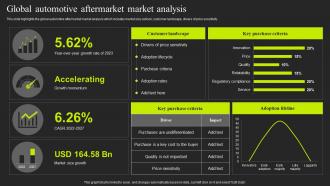 Global Automotive Aftermarket Market Analysis Auto Repair Industry Market Analysis
This slide highlights the global automotive aftermarket market analysis which includes market size outlook, customer landscape, drivers of price sensitivity. Present the topic in a bit more detail with this Global Automotive Aftermarket Market Analysis Auto Repair Industry Market Analysis. Use it as a tool for discussion and navigation on Customer Landscape, Key Purchase Criteria. This template is free to edit as deemed fit for your organization. Therefore download it now.
-
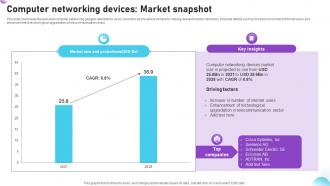 Computer Networking Devices Market Snapshot
This slide showcases the personal computer networking gadgets referable for users, investors and business owners for making relevant industry decisions. It include details such as increase in number of internet users and enhancement of technological upgradation in telecommunication sector. Presenting our well structured Computer Networking Devices Market Snapshot. The topics discussed in this slide are Market Size And Projections. This is an instantly available PowerPoint presentation that can be edited conveniently. Download it right away and captivate your audience.
-
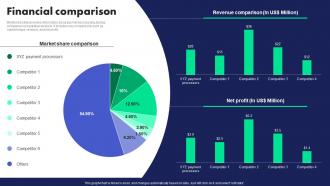 Startup Company Profile Financial Comparison Ppt Clipart CP SS
Mentioned slide provides information about payment processing startup companies comparative analysis. It includes key comparisons such as market share, revenue, and net profit. Deliver an outstanding presentation on the topic using this Startup Company Profile Financial Comparison Ppt Clipart CP SS. Dispense information and present a thorough explanation of Revenue, Comparison, Profit using the slides given. This template can be altered and personalized to fit your needs. It is also available for immediate download. So grab it now.
-
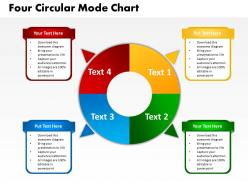 Four circular mode chart powerpoint templates graphics slides 0712
Use this graphic to represent a continuing sequence of stages, tasks, or events in a circular flow and emphasize the connection between all components.
-
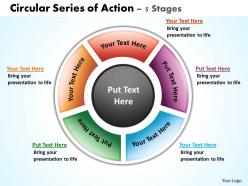 Circular series of action 5 stages powerpoint diagrams presentation slides graphics 0912
This diagram representing steps or actions in a process . Used to emphasize direction of movement and interconnections of stages in a flow.
-
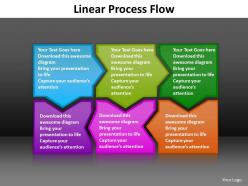 Linear process flow editable powerpoint templates infographics images 1121
This Business Oriented Chart will definitely help you to be more Successful. Use this graphics as key element in streamlining your plans.
-
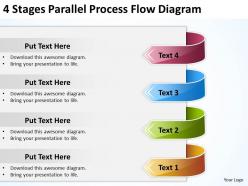 Business analysis diagrams process flow powerpoint templates ppt backgrounds for slides
We are proud to present our business analysis diagrams process flow powerpoint templates ppt backgrounds for slides. This PowerPoint Diagram shows you the Flow Diagram which consists of many steps to be covered in one Process. It is useful to explain components involved as well as the factors included in Process.
-
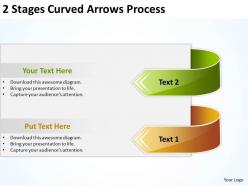 Business diagrams templates 2 stages curved arrows process powerpoint slides
We are proud to present our business diagrams templates 2 stages curved arrows process powerpoint slides. This PowerPoint slide shows parallel process arrow based diagram for strategic planning, business planning etc. You have some great folks working with you, thinking with you. A balanced approach to any situation is generally a guarantor of success.
-
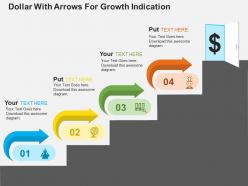 Dollar with arrows for growth indication flat powerpoint design
We are proud to present our dollar with arrows for growth indication flat powerpoint design. This power point template diagram has been crafted with graphic of dollar symbol and arrows. This PPT diagram contains the concept of growth indication. Use this PPT diagram for business and finance related presentations for your viewers.
-
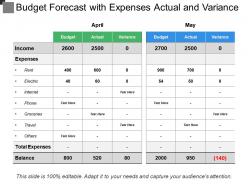 Budget forecast with expenses actual and variance
Presenting this set of slides with name - Budget Forecast With Expenses Actual And Variance. This is a two stage process. The stages in this process are Budget Forecast, Forecast Vs Actual Budget, Plan Vs Forecast.
-
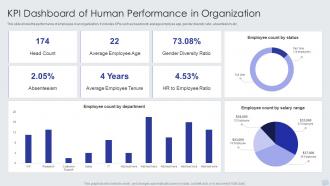 KPI Dashboard Of Human Performance In Organization
This slide shows the performance of employees in an organization. It includes KPIs such as headcount, average employee age, gender diversity ratio, absenteeism, etc. Introducing our KPI Dashboard Of Human Performance In Organization set of slides. The topics discussed in these slides are Head Count, Average Employee Age, Gender Diversity Ratio. This is an immediately available PowerPoint presentation that can be conveniently customized. Download it and convince your audience.
-
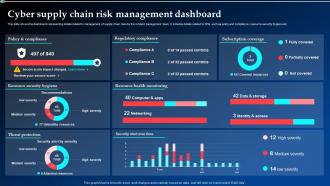 Cyber Supply Chain Risk Management Dashboard Ppt Powerpoint Presentation Pictures Topics
This slide shows the dashboard representing details related to management of supply chain risks by the incident management team. It includes details related to KPIs such as policy and compliance, resource security hygiene etc. Present the topic in a bit more detail with this Cyber Supply Chain Risk Management Dashboard Ppt Powerpoint Presentation Pictures Topics. Use it as a tool for discussion and navigation on Regulatory Compliance, Cyber Supply Chain, Management Dashboard. This template is free to edit as deemed fit for your organization. Therefore download it now.
-
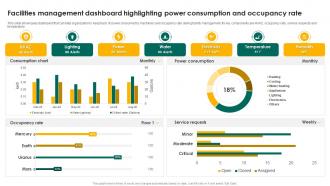 Facilities Management Dashboard Highlighting Power Consumption And Occupancy Rate
This slide showcases dashboard that can help organization to keep track of power consumed by machinery and occupancy rate during facility management. Its key components are HVAC, occupancy rate, service requests and temperature. Presenting our well structured Facilities Management Dashboard Highlighting Power Consumption And Occupancy Rate. The topics discussed in this slide are Consumption Chart, Power Consumption, Occupancy Rate. This is an instantly available PowerPoint presentation that can be edited conveniently. Download it right away and captivate your audience.
-
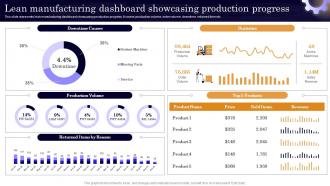 Lean Manufacturing Dashboard Executing Lean Production System To Enhance Process
This slide represents lean manufacturing dashboard showcasing production progress. It covers production volume, order volume, downtime, returned item etc. Present the topic in a bit more detail with this Lean Manufacturing Dashboard Executing Lean Production System To Enhance Process. Use it as a tool for discussion and navigation on Production Volume, Downtime Causes, Returned Items. This template is free to edit as deemed fit for your organization. Therefore download it now.
-
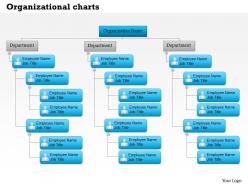 0514 organizational charts templates powerpoint presentation
We are proud to present our 0514 organizational charts templates powerpoint presentation. The template offers an excellent background to build up Organizational Chart. Give them an overview of your capability and insight into the minute details of the overall picture highlighting the interdependence at every operational level.
-
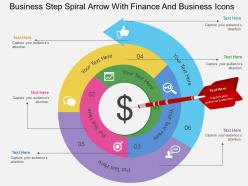 Gf business step spiral arrow with finance and business icons flat powerpoint design
Presenting gf business step spiral arrow with finance and business icons flat powerpoint design. This Power Point template diagram has been crafted with graphic of business step spiral arrow and icons. This PPT diagram contains the concept of business process flow representation. Use this PPT diagram for business and marketing related presentations.
-
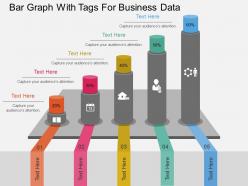 Pptx bar graph with tags for business data flat powerpoint design
Presenting pptx bar graph with tags for business data flat powerpoint design. This Power Point template diagram has been crafted with graphic of bar graph and tags icons. This PPT diagram contains the concept of business data analysis and business planning. Use this PPT diagram for business and finance related presentations.
-
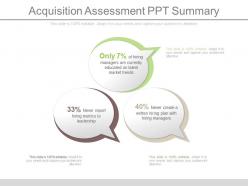 Acquisition assessment ppt summary
Presenting acquisition assessment ppt summary. This is a acquisition assessment ppt summary. This is a three stage process. The stages in this process are only 7 percent of hiring managers are currently educated on talent market trends, 33 percent never report hiring metrics to leadership, 40 percent never create a written hiring plan with hiring managers.
-
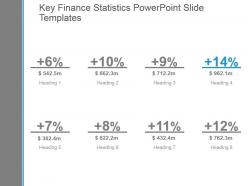 Key finance statistics powerpoint slide templates
Presenting key finance statistics powerpoint slide templates. This is a key finance statistics powerpoint slide templates. This is a eight stage process. The stages in this process are business, success, strategy, management, marketing, process.
-
 Money investment icon ppt inspiration
Presenting money investment icon ppt inspiration. This is a money investment icon ppt inspiration. This is a one stage process. The stages in this process are investment, venture capital, funding, private equity.
-
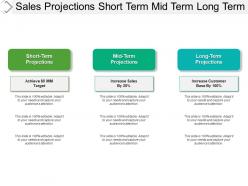 Sales projections short term mid term long term
Presenting Sales Projection Short Term Mid Term Long Term PowerPoint slide which is completely editable. The template is adaptable with Google Slides which makes it accessible at once. Can be changed into formats like PDF, JPG, and PNG. Customize the color, fonts, font size, and font types of the template as per the requirements. The slide is readily available in both 4:3 and 16:9 aspect ratios.
-
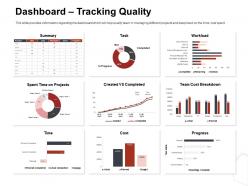 Dashboard snapshot tracking quality workload ppt file design
This slide provides information regarding the dashboard which will help quality team in managing different projects and keep track on the time cost spent. Presenting this set of slides with name Dashboard Snapshot Tracking Quality Workload Ppt File Design. The topics discussed in these slides are Task, Workload, Spent Time On Projects, Created VS Completed, Progress. This is a completely editable PowerPoint presentation and is available for immediate download. Download now and impress your audience.
-
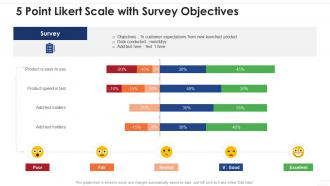 5 point likert scale with survey objectives
Presenting our well structured 5 Point Likert Scale With Survey Objectives. The topics discussed in this slide are Customer Expectations, Survey, Product. This is an instantly available PowerPoint presentation that can be edited conveniently. Download it right away and captivate your audience.
-
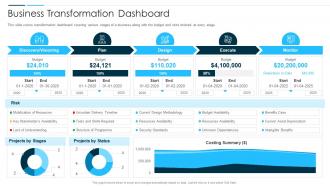 Digital Business Revolution Business Transformation Dashboard
This slide covers transformation dashboard covering various stages of a business along with the budget and risks involved at every stage. Deliver an outstanding presentation on the topic using this Digital Business Revolution Business Transformation Dashboard. Dispense information and present a thorough explanation of Discovery Visioning, Design, Plan using the slides given. This template can be altered and personalized to fit your needs. It is also available for immediate download. So grab it now.
-
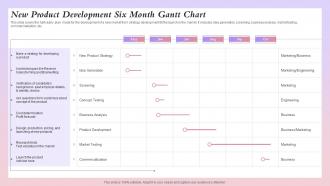 New Product Development Six Month Gantt Chart
This slide covers the half yearly plan made for the development of a new market from strategy development till the launch in the market. It includes idea generation, screening, business analysis, market testing , commercialization, etc. Your complex projects can be managed and organized simultaneously using this detailed New Product Development Six Month Gantt Chart template. Track the milestones, tasks, phases, activities, and subtasks to get an updated visual of your project. Share your planning horizon and release plan with this well-crafted presentation template. This exemplary template can be used to plot various dependencies to distinguish the tasks in the pipeline and their impact on the schedules and deadlines of the project. Apart from this, you can also share this visual presentation with your team members and stakeholders. It a resourceful tool that can be incorporated into your business structure. Therefore, download and edit it conveniently to add the data and statistics as per your requirement.
-
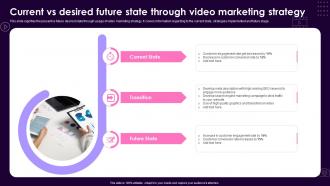 Current Vs Desired Future State Through Video Marketing Strategy
This slide signifies the present vs future desired state through usage of video marketing strategy. It covers information regarding to the current state, strategies implemented and future stage. Presenting our set of slides with name Current Vs Desired Future State Through Video Marketing Strategy. This exhibits information on three stages of the process. This is an easy-to-edit and innovatively designed PowerPoint template. So download immediately and highlight information on Current State, Transition, Future State.
-
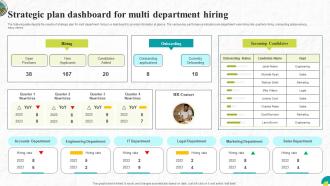 Strategic Plan Dashboard For Multi Department Hiring
The following slide depicts the results of strategic plan for multi department hiring in a dashboard to provide information at glance. The various key performance indicators are department wise hiring rate, quarterly hiring, onboarding status among many others Introducing our Strategic Plan Dashboard For Multi Department Hiring set of slides. The topics discussed in these slides are Strategic, Department, Hiring. This is an immediately available PowerPoint presentation that can be conveniently customized. Download it and convince your audience.
-
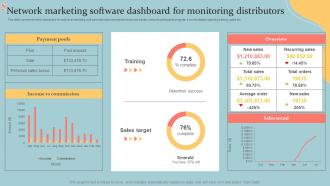 Network Marketing Software Dashboard For Monitoring Distributors Executive MLM Plan MKT SS V
This slide represents metric dashboard for multi level marketing software that helps marketers to track and monitor network participants progress. It covers details regarding training, sales etc. Present the topic in a bit more detail with this Network Marketing Software Dashboard For Monitoring Distributors Executive MLM Plan MKT SS V. Use it as a tool for discussion and navigation on Payment Pools, Overview, Sales Trend. This template is free to edit as deemed fit for your organization. Therefore download it now.
-
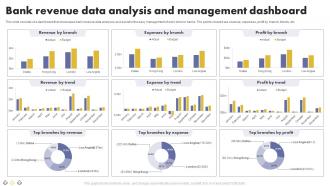 Bank Revenue Data Analysis And Management Dashboard
This slide consists of a dashboard that showcases bank revenue data analyses as it assist in the easy management of work done in banks. The points covered are revenue, expenses, profit by branch, trends, etc. Introducing our Bank Revenue Data Analysis And Management Dashboard set of slides. The topics discussed in these slides are Revenue By Branch, Expenses By Branch, Profit By Branch. This is an immediately available PowerPoint presentation that can be conveniently customized. Download it and convince your audience.
-
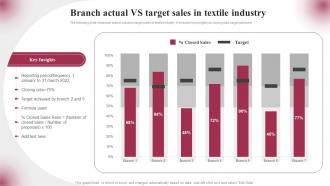 Branch Actual VS Target Sales In Textile Industry
The following slide showcase branch actual vs target sales in textile industry. It includes key insights as closing ratio, target achieved. Presenting our well structured Branch Actual VS Target Sales In Textile Industry. The topics discussed in this slide are Key Insights. This is an instantly available PowerPoint presentation that can be edited conveniently. Download it right away and captivate your audience.
-
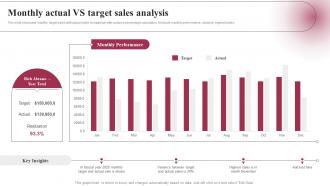 Monthly Actual VS Target Sales Analysis
This slide showcase monthly target sales with actual sales comparison with variance percentage calculation. It include monthly performance, variance, highest sales. Presenting our well structured Monthly Actual VS Target Sales Analysis. The topics discussed in this slide are Monthly Performance. This is an instantly available PowerPoint presentation that can be edited conveniently. Download it right away and captivate your audience.
-
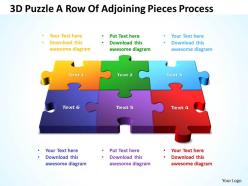 3d puzzle a row of adjoining pieces process powerpoint templates ppt presentation slides 812
Display with these 3D puzzle pieces coherences, process steps, sequences, subareas and workflows
-
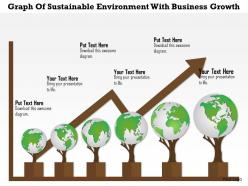 1214 graph of sustainable environment with business growth powerpoint template
We are proud to present our 1214 graph of sustainable environment with business growth powerpoint template. This Power Point template has been designed with graphic of graph. This PPT contains the concept of sustainable environment and business growth. Use this PPT for your environment and business related presentations.
-
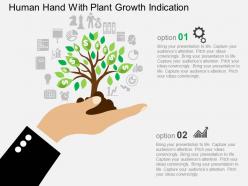 Human hand with plant growth indication flat powerpoint design
We are proud to present our human hand with plant growth indication flat powerpoint design. Graphic of human hand with plant growth has been used to design this power point template diagram. This PPT diagram contains the concept of growth indication. Use this PPT diagram for business and marketing related presentations.
-
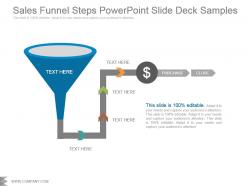 Sales funnel steps powerpoint slide deck samples
Presenting sales funnel steps powerpoint slide deck samples. Presenting sales funnel steps powerpoint slide deck samples. Presenting sales funnel steps powerpoint slide deck samples. Presenting sales funnel steps powerpoint slide deck samples. This is a sales funnel steps powerpoint slide deck samples. This is a one stage process. The stages in this process are business, funnel, strategy, marketing, management, arrow.
-
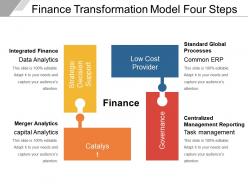 Finance transformation model four steps
Presenting finance transformation model four steps. Presenting finance transformation model four steps. This is a finance transformation model four steps. This is a four stage process. The stages in this process are finance transformation, money transformation, finance service.
-
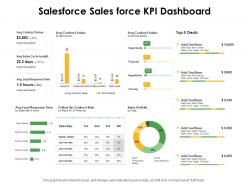 Salesforce sales force kpi dashboard snapshot ppt powerpoint presentation show sample
Presenting this set of slides with name Salesforce Sales Force KPI Dashboard Snapshot Ppt Powerpoint Presentation Show Sample. The topics discussed in these slides are Opportunity, Sales Activity, Negotiation. This is a completely editable PowerPoint presentation and is available for immediate download. Download now and impress your audience.
-
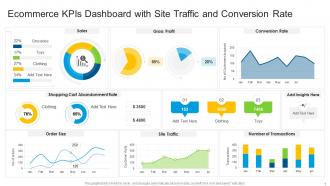 Ecommerce kpis dashboard snapshot with site traffic and conversion rate
Introducing our Ecommerce KPIs Dashboard Snapshot With Site Traffic And Conversion Rate set of slides. The topics discussed in these slides are Gross Profit, Conversion Rate, Sales. This is an immediately available PowerPoint presentation that can be conveniently customized. Download it and convince your audience.
-
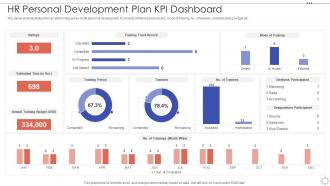 HR Personal Development Plan KPI Dashboard
The below slide illustrates the key performing areas of HR personal development. It consists of training track record, mode of training, no. of trainees, annual training budget etc. Introducing our HR Personal Development Plan KPI Dashboard set of slides. The topics discussed in these slides are Estimated Time, Annual Training Budget, Accounting. This is an immediately available PowerPoint presentation that can be conveniently customized. Download it and convince your audience.
-
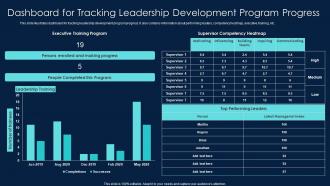 Dashboard For Tracking Leadership Development Program Progress
This slide illustrates dashboard for tracking leadership development program progress. It also contains information about performing leaders, competency heatmap, executive training, etc. Presenting our well-structured Dashboard For Tracking Leadership Development Program Progress. The topics discussed in this slide are Dashboard Tracking, Leadership Development, Program Progress. This is an instantly available PowerPoint presentation that can be edited conveniently. Download it right away and captivate your audience.
-
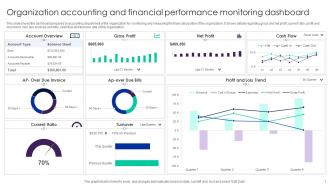 Organization Accounting And Financial Performance Monitoring Dashboard
This slide shows the dashboard prepared by accounting department of the organization for monitoring and measuring the financial position of the organization. It shows details regarding gross and net profit, current ratio, profit and loss trend, over due invoices and bills, cash flow and turnover rate of the organization. Introducing our Organization Accounting And Financial Performance Monitoring Dashboard set of slides. The topics discussed in these slides are Account Overview, Current Ratio, Net Profit. This is an immediately available PowerPoint presentation that can be conveniently customized. Download it and convince your audience.
-
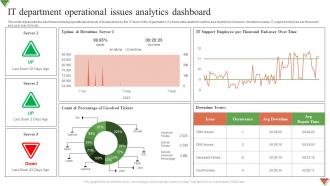 IT Department Operational Issues Analytics Dashboard
This slide represents the dashboard showing operational analysis of issues faced by the IT team of the organization. It shows data related to uptime and downtime of servers, downtime issues, IT support employee per thousand end user over time etc. Introducing our IT Department Operational Issues Analytics Dashboard set of slides. The topics discussed in these slides are Support Employee, Downtime Server, Count Percentage. This is an immediately available PowerPoint presentation that can be conveniently customized. Download it and convince your audience.
-
 IT Software Development Project Operational Analytics Dashboard
This slide represents the dashboard showing the operational analysis of the software development project undertaken by the IT team. It shows details related to overall progress, planning, design, development, testing, risks, budget, overdue tasks etc. related to the project. Presenting our well structured IT Software Development Project Operational Analytics Dashboard. The topics discussed in this slide are Overdue Tasks, Upcoming Deadlines, Project Budget. This is an instantly available PowerPoint presentation that can be edited conveniently. Download it right away and captivate your audience.
-
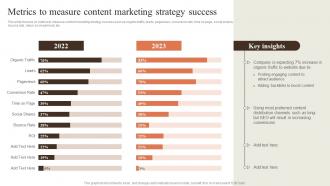 Metrics To Measure Content Marketing Strategy Creating Content Marketing Strategy
This slide focuses on metrics to measure content marketing strategy success such as organic traffic, leads, pageviews, conversion rate, time on page, social shares, bounce rate, return on investment, etc. Present the topic in a bit more detail with this Metrics To Measure Content Marketing Strategy Creating Content Marketing Strategy. Use it as a tool for discussion and navigation on Metrics To Measure, Content Marketing, Strategy Success. This template is free to edit as deemed fit for your organization. Therefore download it now.
-
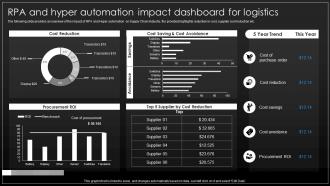 Implementation Process Of Hyper Automation RPA And Hyper Automation Impact Dashboard For Logistics
The following slide provides an overview of the impact of RPA and Hyper automation on Supply Chain Industry, the provided highlights reduction in cost, supplier cost reduction etc. Present the topic in a bit more detail with this Implementation Process Of Hyper Automation RPA And Hyper Automation Impact Dashboard For Logistics. Use it as a tool for discussion and navigation on Cost Reduction, Cost Saving, Cost Avoidance. This template is free to edit as deemed fit for your organization. Therefore download it now.


