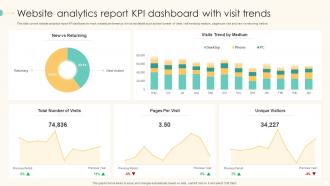
Finance PowerPoint Templates, Presentation Slide Diagrams & PPT Graphics
- Sub Categories
-
- 30 60 90 Day Plan
- Advertising
- Agile Development
- Aims and Objectives
- Arrows
- Before and After
- Blockchain Bitcoin
- Boxes
- Business
- Calender
- Case Study
- Celebrations
- Certificates
- Challenges Opportunities
- Channel Distribution
- Children
- Communication
- Competitive Landscape
- Computer
- Concepts
- Construction Management
- Corporate
- Crowdfunding
- Current State Future State
- Custom PowerPoint Diagrams
- Digital Transformation
- Dos and Donts
- Economics
- Education
- Environment
- Events
- Festival
- Finance
- Financials
- Food
- Game
- Gap Analysis
- Generic
- Geographical
- Health
- Heatmaps
- Holidays
- Icons
- Input Process Output
- Internet
- Key Messages
- Key Wins
- Ladder
- Leadership
- Lists
- Lucky Draw
- Management
- Marketing
- Measuring
- Medical
- Music
- News
- Next Steps
- People Process Technology
- Pillars
- Planning
- Post-it-Notes
- Problem Statement
- Process
- Proposal Management
- Pros and Cons
- Puzzle
- Puzzles
- Recruitment Strategy
- Religion
- Research and Development
- Risk Mitigation Strategies
- Roadmap
- Selling
- Shapes
- Short Term Long Term
- Social
- Stairs
- Start Stop Continue
- Strategy
- Symbol
- Technology
- Thesis Defense Dissertation
- Timelines
- Traffic
- Transition Plan
- Transportation
- Vehicles
- Venture Capital Funding
- Warning
- Winners
- Word Cloud
-
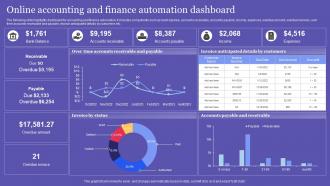 Online Accounting And Finance Automation Dashboard
The following slide highlights dashboard for accounting and finance automation. It includes components such as bank balance, accounts receivable, accounts payable, income, expenses, overdue amount, overdue invoices, over time accounts receivable and payable, invoice anticipated details by customers etc. Introducing our Online Accounting And Finance Automation Dashboard set of slides. The topics discussed in these slides are Receivable, Payable. This is an immediately available PowerPoint presentation that can be conveniently customized. Download it and convince your audience.
-
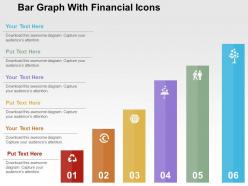 Bar graph with financial icons flat powerpoint design
Impressive use of colors and design. Eye catchy visuals. Images are of high resolution. No fear of pixilation when projected on wide screen. Compatible with large number of online and offline software options. Harmonious with numerous format options. Thoroughly editable slide. Include or exclude the content at ease. Personalize the presentation with company name and logo of yours.
-
 Company market size comparison chart ppt slide
Presenting company market size comparison chart ppt slide. This is a company market size comparison chart ppt slide. This is a two stage process. The stages in this process are business, success, strategy, finance, growth, success.
-
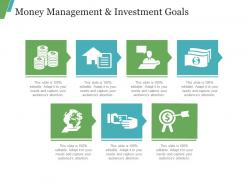 Money management and investment goals ppt images gallery
Presenting money management and investment goals PPT Images gallery. Picture quality of these slides does not change even when projected on a large screen. Simple data input like company logo, name or trademark. This PowerPoint theme is fully supported by Google Slides. This PPT offers fast downloading speed and formats can be easily changed to JPEG and PDF applications. This template is suitable for marketing, sales persons, business managers and entrepreneurs. Adjust PPT layout, font, text and color as per your necessity.
-
 Five stages business service offerings with icons
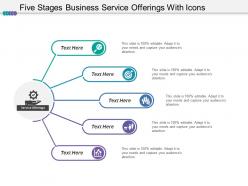
Presenting this set of slides with name - Five Stages Business Service Offerings With Icons. This is a five stage process. The stages in this process are Service Offering, Service Commitments, Service Management.
-
 Project prioritization matrix with financial benefit
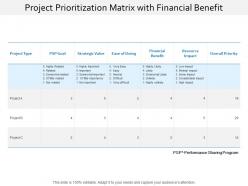
Presenting this set of slides with name - Project Prioritization Matrix With Financial Benefit. This is a seven stage process. The stages in this process are Project Prioritization, Business, Marketing.
-
 Email Marketing Kpi Dashboard With Bounce Rate
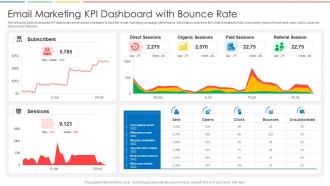
The following slide showcases KPI dashboard which allows marketers to track the email marketing campaign performance. Information covered in this slide is related to total subscribers, types of email sent, open, clicks, bounces and unsubscribed etc. Introducing our Email Marketing KPI Dashboard With Bounce Rate set of slides. The topics discussed in these slides are Direct Sessions, Organic Sessions, Paid Sessions, Referral Session. This is an immediately available PowerPoint presentation that can be conveniently customized. Download it and convince your audience.
-
 Project Test Summary Quality Report
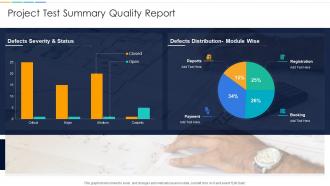
This graph or chart is linked to excel, and changes automatically based on data. Just left click on it and select Edit Data. Presenting our well structured Project Test Summary Quality Report. The topics discussed in this slide are Defects Severity And Status, Defects Distribution Module Wise, Payment, Booking, Registration, Reports. This is an instantly available PowerPoint presentation that can be edited conveniently. Download it right away and captivate your audience.
-
 Changes Before And After Implementing Lean Process
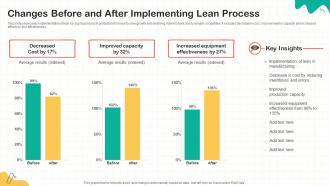
This slide showcases implementation of lean six sigma process in production firm due to slow growth and declining market share and to remain competitive. It includes decrease in cost , improvement in capacity and increased efficiency and effectiveness. Introducing our Changes Before And After Implementing Lean Process set of slides. The topics discussed in these slides are Decreased Cost, Improved Capacity, Increased Equipment Effectiveness. This is an immediately available PowerPoint presentation that can be conveniently customized. Download it and convince your audience.
-
 Manual Payroll Management Challenges
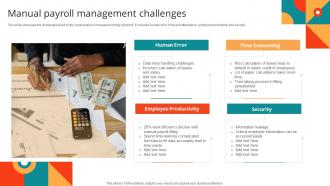
This slide showcase the challenges faced by the organisation in manual recording of payroll. It includes human error, time and attendance, employee productivity and security. Introducing our premium set of slides with Manual Payroll Management Challenges. Ellicudate the one stages and present information using this PPT slide. This is a completely adaptable PowerPoint template design that can be used to interpret topics like Human Error, Time Consuming, Employee Productivity, Security. So download instantly and tailor it with your information.
-
 Feedback Report For Conference Event Satisfaction
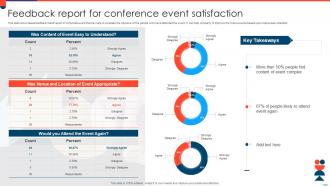
This slide showcases feedback result report of corporate event that can help to evaluate the opinions of the people who have attended the event. It can help company to improve the future events based upon responses collected. Presenting our well structured Feedback Report For Conference Event Satisfaction. The topics discussed in this slide are Venue And Location, Event Appropriate, Strongly Disagree. This is an instantly available PowerPoint presentation that can be edited conveniently. Download it right away and captivate your audience.
-
 Financial Ratio Analysis Dashboard With Profit Margin
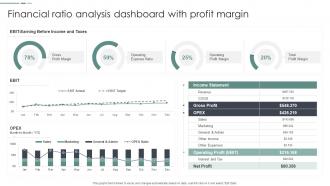
Introducing our Financial Ratio Analysis Dashboard With Profit Margin set of slides. The topics discussed in these slides are Financial Ratio Analysis, Dashboard, Profit Margin. This is an immediately available PowerPoint presentation that can be conveniently customized. Download it and convince your audience.
-
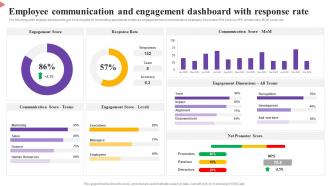 Employee Communication And Engagement Dashboard With Response Rate
The following slide displays dashboard to get- time insights for formulating appropriate employee engagement and communication strategies. It includes KPIs such as NPS, dimensions, MOM score, etc. Introducing our Employee Communication And Engagement Dashboard With Response Rate set of slides. The topics discussed in these slides are Engagement Score, Response Rate, Communication Score. This is an immediately available PowerPoint presentation that can be conveniently customized. Download it and convince your audience.
-
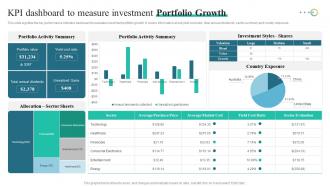 KPI Dashboard To Measure Investment Portfolio Growth
This slide signifies the key performance indicator dashboard to evaluate investment portfolio growth. It covers information about yield cost ratio, total annual dividends, sector summary and country exposure. Introducing our KPI Dashboard To Measure Investment Portfolio Growth set of slides. The topics discussed in these slides are KPI Dashboard, Measure Investment, Portfolio Growth. This is an immediately available PowerPoint presentation that can be conveniently customized. Download it and convince your audience.
-
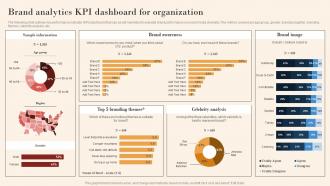 Brand Analytics KPI Dashboard For Organization Mkt Ss V
The following slide outlines key performance indicator KPI dashboard that can assist marketers to evaluate brand performance on social media channels. The metrics covered are age group, gender, brand perception, branding themes, celebrity analysis, etc. Present the topic in a bit more detail with this Brand Analytics KPI Dashboard For Organization Mkt Ss V. Use it as a tool for discussion and navigation on Sample Information, Brand Awareness. This template is free to edit as deemed fit for your organization. Therefore download it now.
-
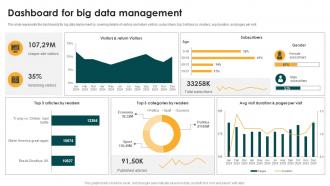 Dashboard For Big Data Management Big Data Analytics And Management
This slide represents the dashboards for big data deployment by covering details of visitors and return visitors, subscribers, top 3 articles by readers, avg duration, and pages per visit. Present the topic in a bit more detail with this Dashboard For Big Data Management Big Data Analytics And Management. Use it as a tool for discussion and navigation on Dashboard For Big Data Management. This template is free to edit as deemed fit for your organization. Therefore download it now.
-
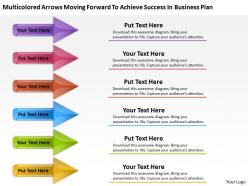 Work flow business process diagram forward to achieve success plan powerpoint slides
We are proud to present our work flow business process diagram forward to achieve success plan powerpoint slides. Visually support your Microsoft office PPT Presentation with our above template illustrating six stages of arrows moving forward to achieve success in business plan. It symbolizes affiliation, affinity, alliance, association, connection etc. Create captivating presentations to deliver comparative and weighted arguments.
-
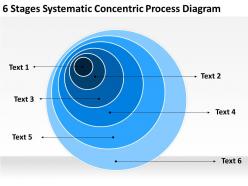 Business context diagram concentric process powerpoint templates ppt backgrounds for slides
We are proud to present our business context diagram concentric process powerpoint templates ppt backgrounds for slides. Heighten the anticipation of your audience with this slide listing onion diagram. An onion diagram is a kind of chart that shows the dependencies among parts of an organization or process. It features an image of concentric circles and designed to attract the attention of your audience.
-
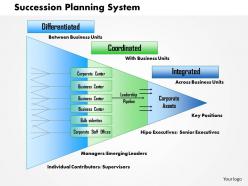 0514 succession planning process powerpoint presentation
Supreme quality PPT presentation layouts. Well-arranged structure to enable easy understanding and memorising of the information displayed. Great to form visually effective presentations. Can enhance the performance of the business processes. Compatible with Google slides. Runs smoothly with all software’s. Favorable to the investors, clients and customers. Completely Professional look and feel.
-
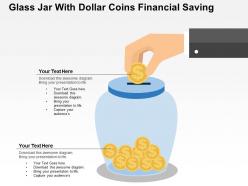 Glass jar with dollar coins financial saving flat powerpoint design
We are proud to present our glass jar with dollar coins financial saving flat powerpoint design. This power point template diagram has been crafted with graphic of glass jar and dollar coins. This PPT diagram contains the concept of financial saving. Use this PPT diagram for business and finance related presentations.
-
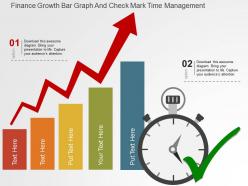 Finance growth bar graph and check mark time management flat powerpoint design
We are proud to present our finance growth bar graph and check mark time management flat powerpoint design. Graphic of bar graph and check mark has been used to craft this power point template diagram. This PPT diagram contains the concept of financial growth and time management. This PPT diagram can be used for business and finance related presentations.
-
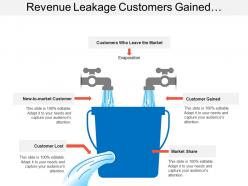 Revenue leakage customers gained lost market share
Presenting this set of slides with name - Revenue Leakage Customers Gained Lost Market Share. This is a two stage process. The stages in this process are Revenue Leakage, Capital Leakage, Income Leakage.
-
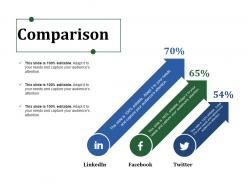 Comparison ppt background template
Presenting this set of slides with name - Comparison Ppt Background Template. This is a three stage process. The stages in this process are Linkedin, Facebook, Twitter, Comparison.
-
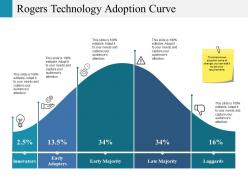 Rogers technology adoption curve ppt pictures rules
Presenting this set of slides with name - Rogers Technology Adoption Curve Ppt Pictures Rules. This is a five stage process. The stages in this process are Innovators, Early Majority, Late Majority, Laggards, Early Adopters.
-
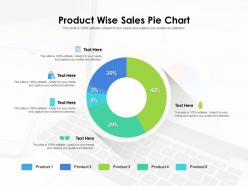 Product wise sales pie chart
Presenting this set of slides with name Product Wise Sales Pie Chart. The topics discussed in these slide is Product Wise Sales Pie Chart. This is a completely editable PowerPoint presentation and is available for immediate download. Download now and impress your audience.
-
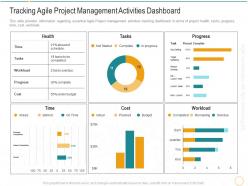 Tracking agile project management activities dashboard digital transformation agile methodology it
This slide provides information regarding essential Agile Project management activities tracking dashboard in terms of project health, tasks, progress, time, cost, workload. Present the topic in a bit more detail with this Tracking Agile Project Management Activities Dashboard Digital Transformation Agile Methodology IT. Use it as a tool for discussion and navigation on Tracking Agile Project Management Activities Dashboard. This template is free to edit as deemed fit for your organization. Therefore download it now.
-
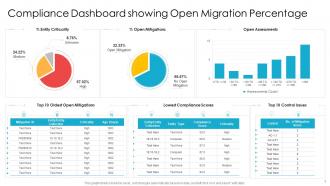 Compliance dashboard showing open migration percentage
Introducing our Compliance Dashboard Showing Open Migration Percentage set of slides. The topics discussed in these slides are Compliance Dashboard Showing Open Migration Percentage. This is an immediately available PowerPoint presentation that can be conveniently customized. Download it and convince your audience.
-
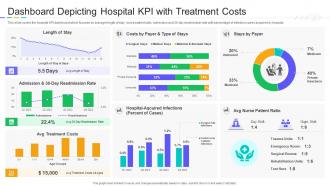 Dashboard Depicting Hospital KPI With Treatment Costs
This slide covers the hospital KPI dashboard which focuses on average length of stay, nurse patient ratio, admission and 30 day readmission rate with percentage of infection cases acquired by hospital. Introducing our Dashboard Depicting Hospital KPI With Treatment Costs set of slides. The topics discussed in these slides are Length Of Stay, Stays By Payer, Admission AND 30 Day Readmission Rate, Avg Nurse Patient Ratio. This is an immediately available PowerPoint presentation that can be conveniently customized. Download it and convince your audience.
-
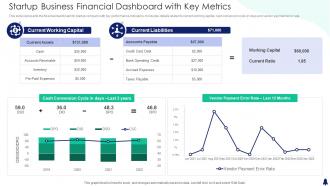 Startup Business Financial Dashboard With Key Metrics
This slide represents the financial dashboard for startup company with key performance indicators. It includes details related to current working capital, cash conversion cycle in days and vendor payment error rate. Introducing our Startup Business Financial Dashboard With Key Metrics set of slides. The topics discussed in these slides are Current Working Capital, Current Liabilities, Working Capital, Cash Conversion. This is an immediately available PowerPoint presentation that can be conveniently customized. Download it and convince your audience.
-
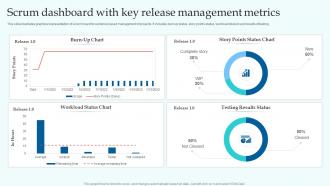 Scrum Dashboard With Key Release Management Metrics
This slide illustrates graphical representation of scrum board for evidence based management of projects. It includes burn up status, story points status, workload division and results of testing. Introducing our Scrum Dashboard With Key Release Management Metrics set of slides. The topics discussed in these slides are Testing Results Status, Workload Status Chart, Burn Up Chart. This is an immediately available PowerPoint presentation that can be conveniently customized. Download it and convince your audience.
-
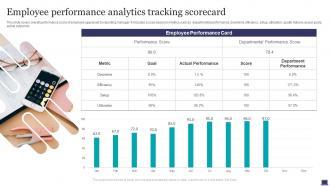 Employee Performance Analytics Tracking Scorecard
This slide covers overall performance score of employee appraised by reporting manager. It includes scores based on metrics such as departmental performance, downtime, efficiency, setup, utilization, quality failures as per goals, actual output etc. Introducing our Employee Performance Analytics Tracking Scorecard set of slides. The topics discussed in these slides are Employee Performance Analytics, Tracking Scorecard. This is an immediately available PowerPoint presentation that can be conveniently customized. Download it and convince your audience.
-
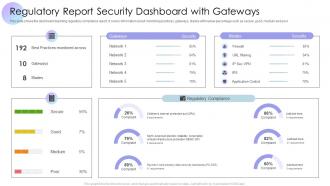 Regulatory Report Security Dashboard Snapshot With Gateways
This slide shows the dashboard depicting regulatory compliance report. It covers information about monitoring practices, gateways, blades with review percentage such as secure, good, medium and poor Introducing our Regulatory Report Security Dashboard Snapshot With Gateways set of slides. The topics discussed in these slides are Secure, Good, Medium, Poor. This is an immediately available PowerPoint presentation that can be conveniently customized. Download it and convince your audience.
-
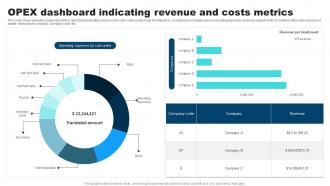 OPEX Dashboard Indicating Revenue And Costs Metrics
This slide shows operating expenses OPEX dashboard indicating revenue and costs metrics which can be referred by companies to manage various operating expenses of various departments. It contains information about cost center, revenue per company, company code, etc. Presenting our well-structured OPEX Dashboard Indicating Revenue And Costs Metrics. The topics discussed in this slide are OPEX Dashboard, Indicating Revenue, Costs Metrics. This is an instantly available PowerPoint presentation that can be edited conveniently. Download it right away and captivate your audience.
-
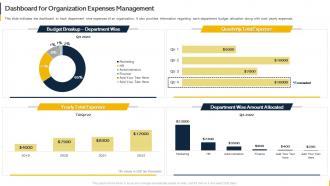 Dashboard For Organization Expenses Management Organization Budget Forecasting
This slide indicates the dashboard to track department wise expenses of an organization. It also provides information regarding each department budget allocation along with total yearly expenses. Present the topic in a bit more detail with this Dashboard For Organization Expenses Management Organization Budget Forecasting. Use it as a tool for discussion and navigation on Dashboard, Organization, Expenses Management. This template is free to edit as deemed fit for your organization. Therefore download it now.
-
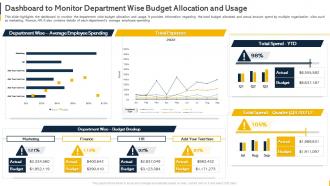 Dashboard To Monitor Department Wise Budget Allocation And Usage Organization Budget Forecasting
This slide highlights the dashboard to monitor the department wise budget allocation and usage. It provides information regarding the total budget allocated and actual amount spent by multiple organization silos such as marketing, finance, HR. It also contains details of each departments average employee spending. Deliver an outstanding presentation on the topic using this Dashboard To Monitor Department Wise Budget Allocation And Usage Organization Budget Forecasting. Dispense information and present a thorough explanation of Dashboard To Monitor, Department Wise Budget, Allocation And Usage using the slides given. This template can be altered and personalized to fit your needs. It is also available for immediate download. So grab it now.
-
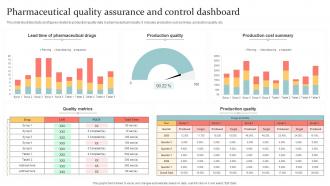 Pharmaceutical Quality Assurance And Control Dashboard
This slide illustrates facts and figures related to production quality data in pharmaceutical industry. It includes production cost summary, production quality, etc. Introducing our Pharmaceutical Quality Assurance And Control Dashboard set of slides. The topics discussed in these slides are Lead Time, Pharmaceutical Drugs, Production Quality. This is an immediately available PowerPoint presentation that can be conveniently customized. Download it and convince your audience.
-
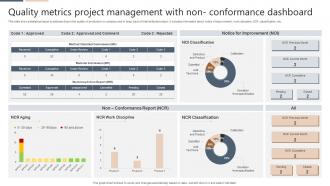 Quality Metrics Project Management With Non- Conformance Dashboard
This slide shows statistical report to address drop in the quality of products in a company and to keep track of total defected output. It includes information about notice of improvement, work discipline, NCR classification, etc. Presenting our well structured Quality Metrics Project Management With Non- Conformance Dashboard. The topics discussed in this slide are Notice For Improvement, Non Conformance Report. This is an instantly available PowerPoint presentation that can be edited conveniently. Download it right away and captivate your audience.
-
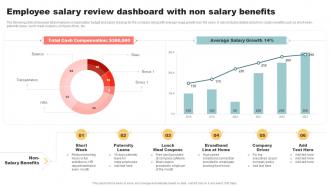 Employee Salary Review Dashboard With Non Salary Benefits
The following slide showcases total employee compensation budget and salary breakup for the company along with average wage growth over the years. It also includes details about non- salary benefits such as short week, paternity leave, lunch meal coupons, company driver, etc. Introducing our Employee Salary Review Dashboard With Non Salary Benefits set of slides. The topics discussed in these slides are Short Week, Broadband Line Home. This is an immediately available PowerPoint presentation that can be conveniently customized. Download it and convince your audience.
-
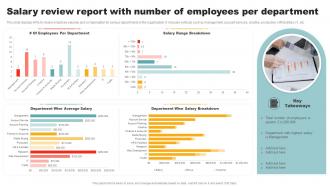 Salary Review Report With Number Of Employees Per Department
This slide displays KPIs to review employee salaries and compensation for various departments in the organization. It includes verticals such as management, account services, creative, production, HR facilities, IT, etc. Introducing our Salary Review Report With Number Of Employees Per Department set of slides. The topics discussed in these slides are Department Wise Salary Breakdown. This is an immediately available PowerPoint presentation that can be conveniently customized. Download it and convince your audience.
-
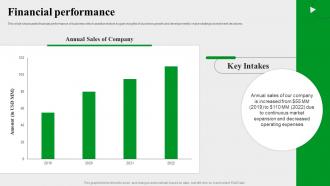 Financial Performance Evernote Investor Funding Elevator Pitch Deck
This slide showcases financial performance of business which assist investors to gain insights of business growth and development to make strategic investment decisions. Deliver an outstanding presentation on the topic using this Financial Performance Evernote Investor Funding Elevator Pitch Deck. Dispense information and present a thorough explanation of Annual Sales Of Company using the slides given. This template can be altered and personalized to fit your needs. It is also available for immediate download. So grab it now.
-
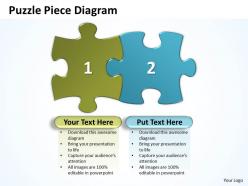 Puzzle piece diagram powerpoint templates ppt presentation slides 0812
This PowerPoint slide shows 2 puzzles diagram. There is a lot of space available for writing your text. You can easily edit the size, position, text, color.
-
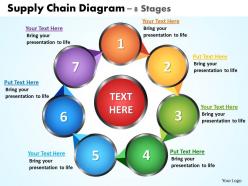 Supply chain diagram 8 stages powerpoint diagrams presentation slides graphics 0912
Use this diagram to visualize the the relationships between events and tasks and how the events affect each other.
-
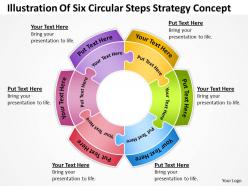 Business powerpoint examples of six circular steps strategy concept templates
We are proud to present our business powerpoint examples of six circular steps strategy concept templates. This PowerPoint Diagram illustrates whole process, segments of processes and can be used for presentations on business processes and strategic management. This is a wonderful graphics to see the smiles of happiness spread as your audience realizes the value of your words.
-
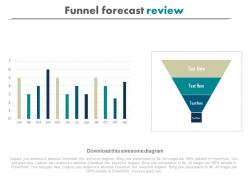 Download funnel forecast review powerpoint slides
Presenting download funnel forecast review powerpoint slides. This Power Point template slide has been crafted with graphic of funnel and bar graph charts. This PPT slide contains the concept of result analysis. Use this PPT slide for business and marketing related presentations.
-
 Dashboard snapshot executive report chart for business plans powerpoint template
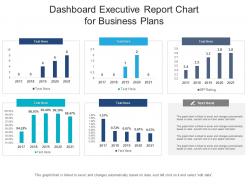
You can use this Dashboard Snapshot Executive Report Chart For Business Plans Powerpoint Template to showcase the most crucial verticals of your organization or a project. This dashboard template comes with graphical representations to make the depiction of insights, data, reports, etc, very easy. It is useful in simplifying complex business concepts, allowing the viewers to make better decisions and judgments. This PowerPoint layout is specially designed for different department heads to display diverse sets of information on the topic and help make the viewers become better analysts. Therefore, this PowerPoint layout is not only resourceful, but it is also attention-grabbing and high-quality. Everything from the content and graphics used in this slide can be modified and adjusted as per your needs. It can also be reproduced in PNG, JPG, and PDF formats, which increases the user-friendliness of this layout.
-
 Company information security risk information security risk scorecard
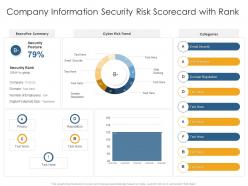
Present the topic in a bit more detail with this Company Information Security Risk Information Security Risk Scorecard. Use it as a tool for discussion and navigation on Cyber Risk Trend, Categories, Web Ranking, Email Security, Domain Reputation. This template is free to edit as deemed fit for your organization. Therefore download it now.
-
 Weekly Assembly Lines Production Report Dashboard Snapshot
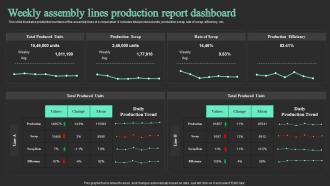
This slide illustrates production numbers of the assembly lines of a corporation. It includes total produced units, production scrap, rate of scrap, efficiency, etc. Introducing our Weekly Assembly Lines Production Report Dashboard set of slides. The topics discussed in these slides are Total Produced Units, Production Scrap, Production Efficiency. This is an immediately available PowerPoint presentation that can be conveniently customized. Download it and convince your audience.
-
 Agile Employee Engagement Dashboard With Score
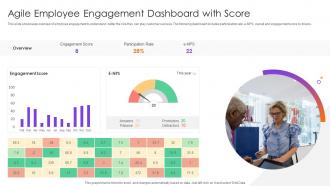
This slide showcases overview of employee engagement to understand better the role they can play customer success. The following dashboard includes participation rate, e-NPS, overall and engagement score by drivers. Introducing our Agile Employee Engagement Dashboard With Score set of slides. The topics discussed in these slides are Engagement Score, Participation Rate, Engagement Score. This is an immediately available PowerPoint presentation that can be conveniently customized. Download it and convince your audience.
-
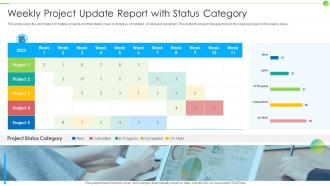 Weekly Project Update Report With Status Category
This slide covers the information of multiple projects and their status new, in progress, completed, on hold and cancelled. This helps the project manager to track the ongoing project on the weekly basis. Presenting our well structured Weekly Project Update Report With Status Category. The topics discussed in this slide are Project Status Category, In Progress, Completed. This is an instantly available PowerPoint presentation that can be edited conveniently. Download it right away and captivate your audience.
-
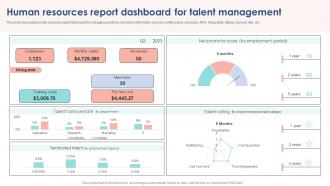 Human Resources Report Dashboard For Talent Management
This slide showcases human resources report dashboard for managing workforce. It provides information such as monthly salary, vacancies, NPS, hiring stats, ratings, turnover rate, etc. Introducing our Human Resources Report Dashboard For Talent Management set of slides. The topics discussed in these slides are Employees, Monthly Salary, Vacancies, Training Costs. This is an immediately available PowerPoint presentation that can be conveniently customized. Download it and convince your audience.
-
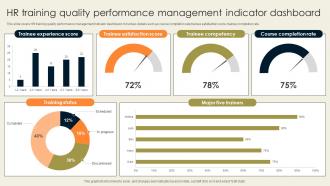 HR Training Quality Performance Management Indicator Dashboard
This slide covers HR training quality performance management indicator dashboard. It involves details such as course completion rate, trainee satisfaction score, trainee completion rate. Introducing our HR Training Quality Performance Management Indicator Dashboard set of slides. The topics discussed in these slides are Trainee Competency, Training Status, Major Five Trainers. This is an immediately available PowerPoint presentation that can be conveniently customized. Download it and convince your audience.
-
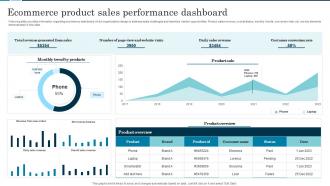 Ecommerce Product Sales Performance Dashboard
Following slide provides information regarding ecommerce dashboard which organizations design to address sales challenges and maximize market opportunities. Product sales revenue, overall status, monthly trends, conversion rate, etc. are key elements demonstrated in this slide. Introducing our Ecommerce Product Sales Performance Dashboard set of slides. The topics discussed in these slides are Daily Sales Revenue, Costumer Conversion Rate, Product Sale. This is an immediately available PowerPoint presentation that can be conveniently customized. Download it and convince your audience.
-
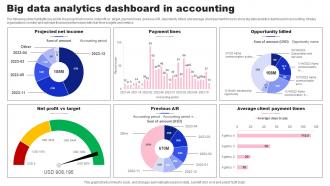 Big Data Analytics Dashboard In Accounting
The following slide highlights key points like project net income, net profit vs. target, payment lines, previous A R, opportunity billed, and average client payment times to show big data analytics dashboard in accounting. It helps organizations monitor and optimize financial performance with real-time insights and metrics. Presenting our well structured Big Data Analytics Dashboard In Accounting. The topics discussed in this slide are Payment Lines, Profit Vs Target. This is an instantly available PowerPoint presentation that can be edited conveniently. Download it right away and captivate your audience.
-
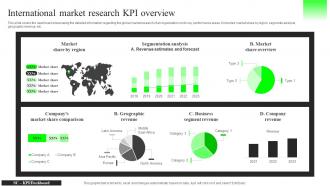 International Market Research KPI Overview
This slide covers the dashboard showcasing the detailed information regarding the global market research of an organization on its key performance areas. It inlcudes market share by region, segments analysis, geographic revenue, etc. Introducing our International Market Research KPI Overview set of slides. The topics discussed in these slides are Market Share Overview, Business Segment Revenue. This is an immediately available PowerPoint presentation that can be conveniently customized. Download it and convince your audience.
-
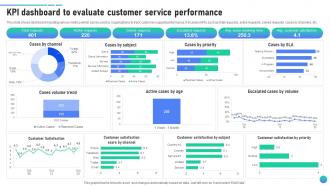 KPI Dashboard To Evaluate Customer Service Client Assistance Plan To Solve Issues Strategy SS V
This slide shows dashboard including various metrics which can be used by organizations to track customer support performance. It includes KPIs such as total requests, active requests, solved requests, cases by channels, etc. Present the topic in a bit more detail with this KPI Dashboard To Evaluate Customer Service Client Assistance Plan To Solve Issues Strategy SS V. Use it as a tool for discussion and navigation on Active Requests, Solved Requests. This template is free to edit as deemed fit for your organization. Therefore download it now.
-
 Financial Projection Business Model Of Zoom Ppt Icon Graphic Images BMC SS
This slide presents the financial projections showcasing company anticipated revenue growth. The projections are based on comprehensive market analysis and historical performance. Deliver an outstanding presentation on the topic using this Financial Projection Business Model Of Zoom Ppt Icon Graphic Images BMC SS. Dispense information and present a thorough explanation of Financial Projection, Historical Performance, Comprehensive Market Analysis using the slides given. This template can be altered and personalized to fit your needs. It is also available for immediate download. So grab it now.
-
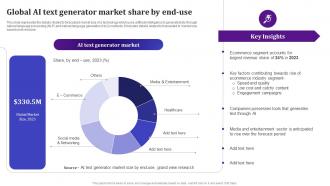 Global AI Text Generator Market Share By End Use AI Text To Voice Convertor Tools AI SS V
This slide represents the details related to forecasted market size of a technology which uses artificial intelligence to generate texts through natural language processing NLP and natural language generation NLG methods. It includes details related to forecasted AI market size based on its end use. Deliver an outstanding presentation on the topic using this Global AI Text Generator Market Share By End Use AI Text To Voice Convertor Tools AI SS V. Dispense information and present a thorough explanation of Media And Entertainment, Healthcare, E Commerce using the slides given. This template can be altered and personalized to fit your needs. It is also available for immediate download. So grab it now.
-
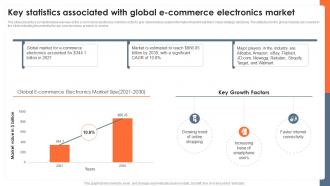 Key Statistics Associated With Global E Commerce Global Consumer Electronics Outlook IR SS
The slide presents a comprehensive overview of the e-commerce electronics market in order to give stakeholders useful information that will help them make strategic decisions. The statistics for the global markets are covered in the slide indicating the potential for any new business, product, or service. Present the topic in a bit more detail with this Key Statistics Associated With Global E Commerce Global Consumer Electronics Outlook IR SS. Use it as a tool for discussion and navigation on Global Market, E Commerce, Electronics Accounted. This template is free to edit as deemed fit for your organization. Therefore download it now.
-
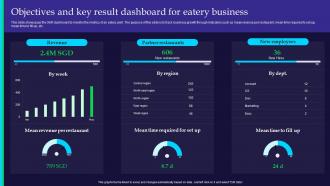 Objectives And Key Result Dashboard For Eatery Business
This slide showcases the OKR dashboard to monitor the metrics of an eatery joint. The purpose of this slide is to track business growth through indicators such as mean revenue per restaurant, mean time required to set up, mean time to fill up, etc. Presenting our well structured Objectives And Key Result Dashboard For Eatery Business The topics discussed in this slide are Revenue, Partner Restaurants, New Employees This is an instantly available PowerPoint presentation that can be edited conveniently. Download it right away and captivate your audience.


