Finance PowerPoint Templates, Presentation Slide Diagrams & PPT Graphics
- Sub Categories
-
- 30 60 90 Day Plan
- Advertising
- Agile Development
- Aims and Objectives
- Arrows
- Before and After
- Blockchain Bitcoin
- Boxes
- Business
- Calender
- Case Study
- Celebrations
- Certificates
- Challenges Opportunities
- Channel Distribution
- Children
- Communication
- Competitive Landscape
- Computer
- Concepts
- Construction Management
- Corporate
- Crowdfunding
- Current State Future State
- Custom PowerPoint Diagrams
- Digital Transformation
- Dos and Donts
- Economics
- Education
- Environment
- Events
- Festival
- Finance
- Financials
- Food
- Game
- Gap Analysis
- Generic
- Geographical
- Health
- Heatmaps
- Holidays
- Icons
- Input Process Output
- Internet
- Key Messages
- Key Wins
- Ladder
- Leadership
- Lists
- Lucky Draw
- Management
- Marketing
- Measuring
- Medical
- Music
- News
- Next Steps
- People Process Technology
- Pillars
- Planning
- Post-it-Notes
- Problem Statement
- Process
- Proposal Management
- Pros and Cons
- Puzzle
- Puzzles
- Recruitment Strategy
- Religion
- Research and Development
- Risk Mitigation Strategies
- Roadmap
- Selling
- Shapes
- Short Term Long Term
- Social
- Stairs
- Start Stop Continue
- Strategy
- Symbol
- Technology
- Thesis Defense Dissertation
- Timelines
- Traffic
- Transition Plan
- Transportation
- Vehicles
- Venture Capital Funding
- Warning
- Winners
- Word Cloud
-
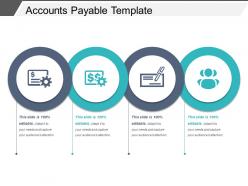 Accounts payable template powerpoint slide designs
Presenting accounts payable PPT slide image. This is professionally developed and organized PPT template which is quite constructive for the finance business professionals. 100% amendable shapes, patterns, text, color and other features. This PT image offers pliable options to insert caption or sub caption and is also authentic. Offers smooth downloads. Runs smoothly with all available software systems and Google Slide. High quality PowerPoint image even remain unaffected when projected over the larger or wider screens.
-
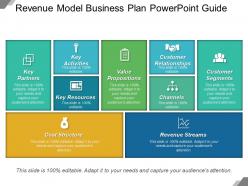 Revenue model business plan powerpoint guide
Presenting this PPT slide named Revenue Model Business Plan PowerPoint Guide. Customize the font color, font size and font style. The color of text and background can be formatted. You can design the PPT slide with a range of editable icons. You can add or edit text anywhere in the PowerPoint template. Its compatibility with Google Slides makes it accessible at once. You can customize and save the slide in PDF and JPG formats as well.
-
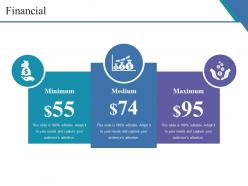 Financial ppt outline
Presenting this set of slides with name - Financial Ppt Outline. This is a three stage process. The stages in this process are Minimum, Medium, Maximum, Financial, Business.
-
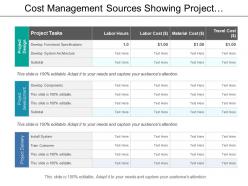 Cost management sources showing project development and delivery
Presenting this set of slides with name - Cost Management Sources Showing Project Development And Delivery. This is a three stage process. The stages in this process are Cost Management, Budget Framework, Fund Model.
-
 Ledger book icon with budget list
Presenting this set of slides with name - Ledger Book Icon With Budget List. This is a one stage process. The stages in this process are Ledger, Bookkeeping, Accounting.
-
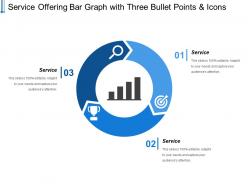 Service Offering Bar Graph With Three Bullet Points And Icons
Presenting this set of slides with name - Service Offering Bar Graph With Three Bullet Points And Icons. This is a three stage process. The stages in this process are Service Offering, Service Commitments, Service Management.
-
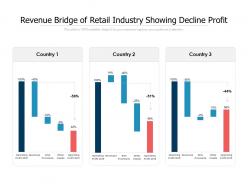 Revenue bridge of retail industry showing decline profit
Presenting this set of slides with name Revenue Bridge Of Retail Industry Showing Decline Profit. The topics discussed in these slides are Operating profit 2018, revenues, risk provisions, other coasts, Operating profit 2019. This is a completely editable PowerPoint presentation and is available for immediate download. Download now and impress your audience.
-
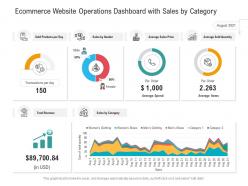 Ecommerce website operations dashboard with sales by category
Introducing our Ecommerce Website Operations Dashboard With Sales By Category set of slides. The topics discussed in these slides are Average Sales Price, Average Sold Quantity, Sales By Gender. This is an immediately available PowerPoint presentation that can be conveniently customized. Download it and convince your audience.
-
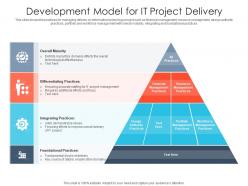 Development model for it project delivery
This slide shows the practices for managing delivery on information technology project such as financial management, resource management, design authority practices, portfolio and workforce management with overall maturity, integrating and foundational practices. Presenting our set of slides with Development Model For IT Project Delivery. This exhibits information on four stages of the process. This is an easy-to-edit and innovatively designed PowerPoint template. So download immediately and highlight information on Foundational Practices, Integrating Practices, Differentiating Practices, Overall Maturity.
-
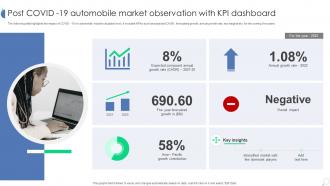 Post COVID 19 Automobile Market Observation With KPI Dashboard
The following slide highlights the impact of COVID - 19 on automobile industry at global level. It includes KPAs such as expected CAGR, forecasted growth, annual growth rate, key insights etc. for the coming five years. Introducing our Post COVID 19 Automobile Market Observation With KPI Dashboard set of slides. The topics discussed in these slides are Expected Compound, Annual Growth Rate, Annual Growth Rate, Overall Impact. This is an immediately available PowerPoint presentation that can be conveniently customized. Download it and convince your audience.
-
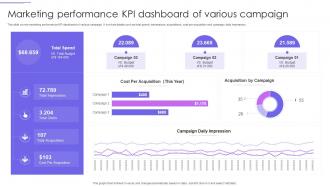 Marketing Performance KPI Dashboard Of Various Campaign
This slide covers marketing performance KPI dashboard of various campaign. It involves details such as total spend, impressions, acquisitions, cost per acquisition and campaign daily impression. Presenting our well structured Marketing Performance KPI Dashboard Of Various Campaign. The topics discussed in this slide are Total Spend, Total Impressions, Total Clicks, Total Acquisitions. This is an instantly available PowerPoint presentation that can be edited conveniently. Download it right away and captivate your audience.
-
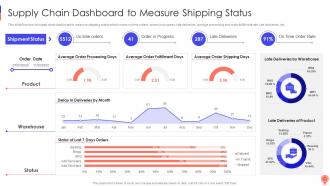 Supply Chain Dashboard To Measure Shipping Status Logistics Optimization Models
This slide focuses on supply chain dashboard to measure shipping status which covers on time orders, orders in progress, late deliveries, average processing and order fulfillment rate, late deliveries, etc. Deliver an outstanding presentation on the topic using this Supply Chain Dashboard To Measure Shipping Status Logistics Optimization Models. Dispense information and present a thorough explanation of Product, Warehouse, Status using the slides given. This template can be altered and personalized to fit your needs. It is also available for immediate download. So grab it now.
-
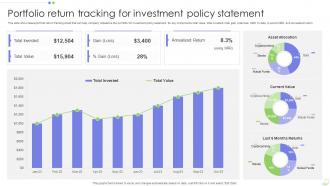 Portfolio Return Tracking For Investment Policy Statement
This slide showcases portfolio return tracking sheet that can help company rebalance the portfolio for investment policy statement. Its key components total value, total invested, total gain, total loss, XIRR to date, 6-period XIRR and annualized return. Presenting our well structured Portfolio Return Tracking For Investment Policy Statement. The topics discussed in this slide are Total Invested, Total Value, Annualized Return. This is an instantly available PowerPoint presentation that can be edited conveniently. Download it right away and captivate your audience.
-
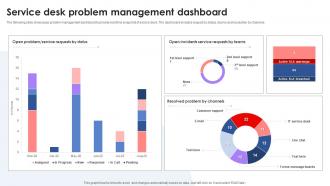 Service Desk Problem Management Dashboard
The following slide showcases problem management dashboard to provide real time snapshot of service desk. The dashboard includes request by status, teams and resolution by channels. Introducing our Service Desk Problem Management Dashboard set of slides. The topics discussed in these slides are Service Desk, Problem Management, Dashboard. This is an immediately available PowerPoint presentation that can be conveniently customized. Download it and convince your audience.
-
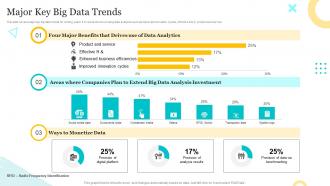 Major Key Big Data Trends
This slide covers major key big data trends for coming years. It involves drivers of using data analytics such as improved innovation cycles, effective R and D, product and service. Presenting our well structured Major Key Big Data Trends. The topics discussed in this slide are Companies Plan, Big Data Analysis, Big Data Trends. This is an instantly available PowerPoint presentation that can be edited conveniently. Download it right away and captivate your audience.
-
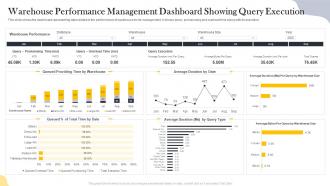 Warehouse Performance Management Dashboard Showing Query Execution
This slide shows the dashboard representing data related to the performance of warehouse for its management. It shows query provisioning and overload time along with its execution. Introducing our Warehouse Performance Management Dashboard Showing Query Execution set of slides. The topics discussed in these slides are Warehouse Performance, Management Dashboard, Query Execution. This is an immediately available PowerPoint presentation that can be conveniently customized. Download it and convince your audience.
-
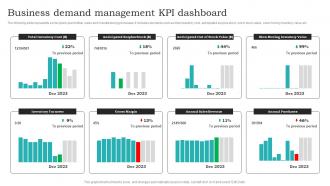 Business Demand Management KPI Dashboard
The following slide represents some kpis to plan further sales and manufacturing processes. It includes elements such as total inventory cost, anticipated surplus stock, out of stock value, slow moving inventory value etc. Introducing our Business Demand Management KPI Dashboard set of slides. The topics discussed in these slides are Total Inventory Cost, Inventory Turnover, Gross Margin. This is an immediately available PowerPoint presentation that can be conveniently customized. Download it and convince your audience.
-
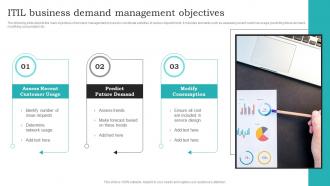 ITIL Business Demand Management Objectives
The following slide depicts the main objectives of demand management process to coordinate activities of various departments. It includes elements such as assessing recent customer usage, predicting future demand, modifying consumption etc. Presenting our set of slides with ITIL Business Demand Management Objectives. This exhibits information on three stages of the process. This is an easy to edit and innovatively designed PowerPoint template. So download immediately and highlight information on Assess Recent, Customer Usage, Predict Future Demand.
-
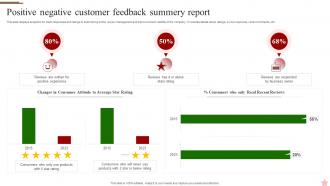 Positive Negative Customer Feedback Summery Report
This slide displays analytics for client responses and ratings to build strong online review management and improve brand visibility of the company. It includes details about ratings, owner response, recent comments, etc. Presenting our well structured Positive Negative Customer Feedback Summery Report. The topics discussed in this slide are Star Rating, Products, Recent Reviews. This is an instantly available PowerPoint presentation that can be edited conveniently. Download it right away and captivate your audience.
-
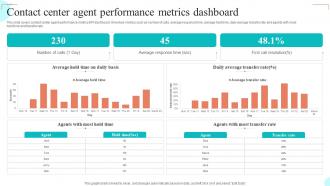 Contact Center Agent Performance Metrics Dashboard
This slide covers contact center agent performance metrics KPI dashboard. It involves metrics such as number of calls, average response time, average hold time, daily average transfer rate and agents with most hold time and transfer rate. Introducing our Contact Center Agent Performance Metrics Dashboard set of slides. The topics discussed in these slides are Number Of Calls, Average Response Time, First Call Resolution This is an immediately available PowerPoint presentation that can be conveniently customized. Download it and convince your audience.
-
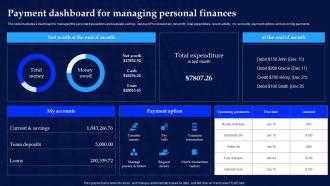 Payment Dashboard For Managing Personal Finances
The slide illustrates a dashboard to managed the personal transactions and evaluate savings. Various KPIs involved are net worth, total expenditure, recent activity, my accounts, payment options and upcoming payments. Introducing our Payment Dashboard For Managing Personal Finances set of slides. The topics discussed in these slides are Payment Dashboard, Managing Personal Finances. This is an immediately available PowerPoint presentation that can be conveniently customized. Download it and convince your audience.
-
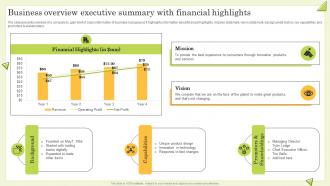 Business Overview Executive Summary With Financial Highlights Guide To Perform Competitor
The slide presents overview of a company to gain brief of basic information of business background. It highlights information about financial highlights, mission statement, vision statement, backgroundand history, key capabilities and promoters and stakeholders. Deliver an outstanding presentation on the topic using this Business Overview Executive Summary With Financial Highlights Guide To Perform Competitor. Dispense information and present a thorough explanation of Business Overview, Executive Summary, Financial Highlights using the slides given. This template can be altered and personalized to fit your needs. It is also available for immediate download. So grab it now.
-
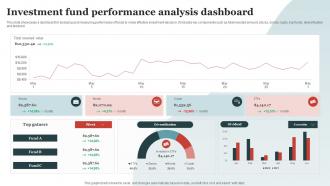 Investment Fund Performance Analysis Dashboard
This slide showcases a dashboard for analyzing and measuring performance of funds to make effective investment decision. It includes key components such as total invested amount, stocks, bonds, crypto, top funds, diversification and dividend. Introducing our Investment Fund Performance Analysis Dashboard set of slides. The topics discussed in these slides are Investment Fund, Performance Analysis Dashboard. This is an immediately available PowerPoint presentation that can be conveniently customized. Download it and convince your audience.
-
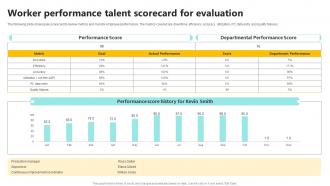 Worker Performance Talent Scorecard For Evaluation
The following slide showcases scorecard to review metrics and monitor employee performance. The metrics covered are downtime, efficiency, accuracy, utilization, PC data entry and quality failures. Introducing our Worker Performance Talent Scorecard For Evaluation set of slides. The topics discussed in these slides are Performance Score, Departmental Performance Score, Performance Score History. This is an immediately available PowerPoint presentation that can be conveniently customized. Download it and convince your audience.
-
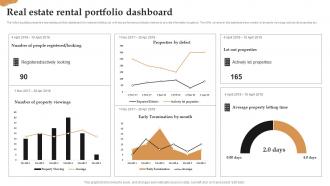 Real Estate Rental Portfolio Dashboard
The following slide presents a real estate portfolio dashboard for rental and letting out with key performance indicator metrics to provide information at glance. The KPIs covered in this dashboard are number of property viewings, actively let properties etc. Introducing our Real Estate Rental Portfolio Dashboard set of slides. The topics discussed in these slides are Property Viewings, Actively Let Properties, Properties By Defect. This is an immediately available PowerPoint presentation that can be conveniently customized. Download it and convince your audience.
-
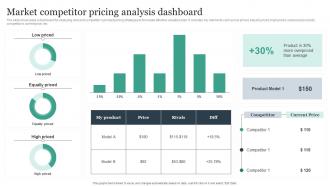 Market Competitor Pricing Analysis Dashboard
The slide showcases a dashboard for analyzing own and competitors product pricing strategies to formulate effective valuation plan. It includes key elements such as low priced, equally priced, high priced, overpriced products, competitors current price, etc. Presenting our well structured Market Competitor Pricing Analysis Dashboard. The topics discussed in this slide are Market Competitor, Pricing Analysis Dashboard. This is an instantly available PowerPoint presentation that can be edited conveniently. Download it right away and captivate your audience.
-
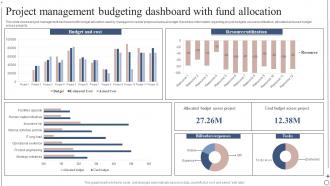 Project Management Budgeting Dashboard With Fund Allocation
This slide shows project management dashboard with budget allocation used by managers to review proposed annual budget. It provides information regarding project budgets, resource utilization, allocated and used budget across projects. Introducing our Project Management Budgeting Dashboard With Fund Allocation set of slides. The topics discussed in these slides are Resource Utilization, Budget, Bill. This is an immediately available PowerPoint presentation that can be conveniently customized. Download it and convince your audience.
-
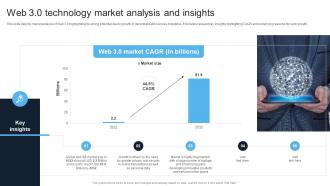 Introduction To Web 3 0 Era Web 3 0 Technology Market Analysis And Insights BCT SS
This slide depicts market analysis of Web 3.0 highlighting its strong potential due to growth of decentralization across industries. It includes relevant key insights highlighting CAGR and underlying reasons for such growth. Present the topic in a bit more detail with this Introduction To Web 3 0 Era Web 3 0 Technology Market Analysis And Insights BCT SS. Use it as a tool for discussion and navigation on Technology Market Analysis, Growth Of Decentralization, Developing Innovative Products. This template is free to edit as deemed fit for your organization. Therefore download it now.
-
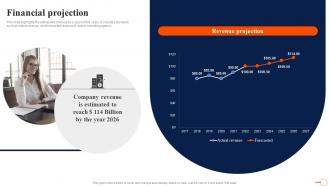 Financial Projection Regiohelden Investor Funding Elevator Pitch Deck
This slide highlights the anticipated revenue for a span of five years. It includes elements such as actual revenue, and forecasted revenue of online marketing agency. Deliver an outstanding presentation on the topic using this Financial Projection Regiohelden Investor Funding Elevator Pitch Deck. Dispense information and present a thorough explanation of Financial Projection, Revenue Projection, Anticipated Revenue, Online Marketing Agency using the slides given. This template can be altered and personalized to fit your needs. It is also available for immediate download. So grab it now.
-
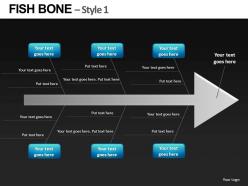 Fishbone style 1 powerpoint presentation slides db
This PPT side can be used by any company's employee for Business, Concepts, Economics, and Finance related process. The subject’s heads shown in the boxes are carefully chosen but can be altered to your liking and so can the corresponding text in the downward and upward area. The color of the boxes and triangle can also be changed.
-
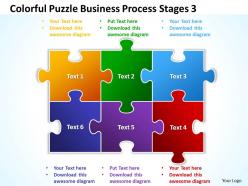 Colorful puzzle business process stages 3 powerpoint templates ppt presentation slides 812
This diagram shows an organized view of business services and processes.
-
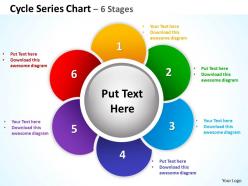 Cycle series chart 6 stages powerpoint diagrams presentation slides graphics 0912
In a cycle series chart, you can explain the main events in the cycle, how they interact, and how the cycle repeats.
-
 Business powerpoint templates smiley emoticon with graduation degree and cap sales ppt slides
This PowerPoint Diagram Shows the Different types of smiley?s with Graduation degree celebrating their completion of degree. It expresses achievement, attainment, close, conclusion, end, expiration, finalization, finish, fulfillment, hips, integration, perfection, realization.
-
 Business powerpoint templates angry emoticon pointing accusing finger sales ppt slides
Use this PowerPoint Diagram in which Angry emoticon pointing an accusing finger is shown. This Diagram formulates acrimony, animosity, annoyance etc. You can use this Diagram to express your views in different situations.
-
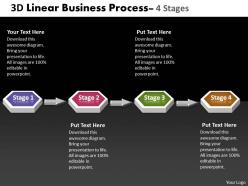 Business powerpoint templates 4 phase diagram ppt 3d linear process sales slides
Use this Astonishing PowerPoint Diagram on the black Background to describe the different phases of a Development Mechanism. It symbolizes continuous flow, interminable, looped, no end of, no end to, on a treadmill, perpetual, prolonged, regular etc.
-
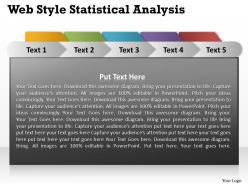 Web style statistical analysis powerpoint slides presentation diagrams templates
We are proud to present our web style statistical analysis powerpoint slides presentation diagrams templates. This diagram slideshows performance scorecard in a web style format. It is used independently of the balanced scorecard methodology to monitor the progress of any organizational goal. Present your views using our innovative slides and be assured of leaving a lasting impression.
-
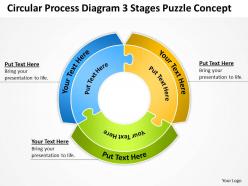 Business Process Flow Chart Circular Diagram 3 Stages Puzzle Concept Powerpoint Templates
We are proud to present our business process flow chart circular diagram 3 stages puzzle concept powerpoint templates. Create visually stunning and define your PPT Presentations in a unique and inspiring manner using our above template which contains a graphic of three stages of circular puzzle process. Use this diagram for business planning, features of business process stages, showing results, creating report, etc.
-
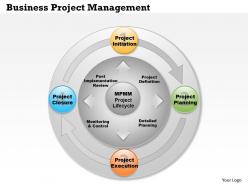 0514 business project management template powerpoint presentation
Use of high resolution graphs and project development process diagrams. Customized content including images and text for project cycle illustration. Fully editable icons. Multiple options in styles and effects. Pre-built infograpics such as data diagrams and business project management models. All the business analyst, marketers, project managers, investors, stakeholders, students and professors can use this PPT slide design for their purpose.
-
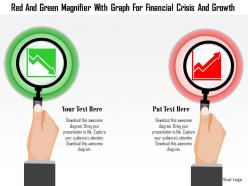 0115 red and green magnifier with graph for financial crisis and growth powerpoint template
We are proud to present our 0115 red and green magnifier with graph for financial crisis and growth powerpoint template. Graphic of red and green magnifier has been used to craft this power point template. This PPT contains the concept of analyzing the financial crisis and growth with the help of graph. This PPT can be used for business and finance related presentations.
-
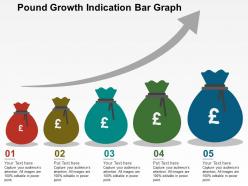 Pound growth indication bar graph flat powerpoint design
We are proud to present our pound growth indication bar graph flat powerpoint design. Concept of growth indication has been displayed in this power point template diagram. This PPT diagram contains the graphic of bar graph and pound. Use this PPT diagram for business and finance related presentations.
-
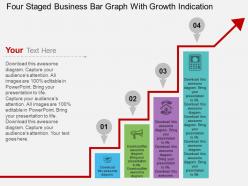 Hd four staged business bar graph with growth indication flat powerpoint design
Presenting hd four staged business bar graph with growth indication flat powerpoint design. Four staged business bar graph diagram has been used to design this power point template diagram. This PPT diagram contains the concept of global business data analysis and growth representation. Use this PPT diagram for business and marketing related presentations.
-
 3 investment highlights powerpoint slide
SlideTeam would like to present to all of you this most demanded and downloaded 3 investment highlights PowerPoint slide. These slides are 100% editable, which lets you alter the font style, font color and font size of the text used. The slides can be saved in the format of either JPG or PDF and are also compatible with Google Slides due to which it becomes highly user-friendly. You can also alter the color, size, and orientation of the diagrams used in the predesigned set of business slides.
-
 Credit card payment icon ppt slide template
Presenting credit card payment icon PPT slide template PPT slide. This PPT is applicable by entrepreneurs, financial analysts, economists, teachers, and students. It’s a plethora of professionally crafted slides. This is a thoroughly editable PowerPoint presentation. Modify the content at your personal comfort and need. Personalize it with your company name and logo. Download and save the presentation in the desired format. PPT is compatible with a wide variety of online and offline software options.
-
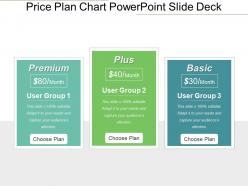 Price plan chart powerpoint slide deck
Presenting Price Plan Chart PowerPoint Slide Deck. Individualize the slide and give it a look as you want. Easily change colors, text, fonts, and backgrounds. The slide is convertible in PDF, JPEG or JPG formats. Customize the shape, size, or color of the icon. Its compatibility with Google Slides makes it available anywhere. Avail it both in standard screen size and widescreen size.
-
 Increase revenue icons powerpoint images
Presenting increase revenue icons PowerPoint images PPT slide. Get this fully customizable template that works on your command. You can change anything in this slide as per your field of interest. Increase or decrease the size of the icon. Change the colors, font type and the font size as well. This can be converted and saved into JPG, PDF, PNG and JPEG formats. These slides goes well with the Google Slides and can be downloaded in 2 screen sizes i.e. standard screen and widescreen.
-
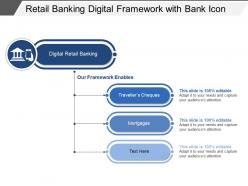 Retail banking digital framework with bank icon
Presenting this set of slides with name - Retail Banking Digital Framework With Bank Icon. This is a three stage process. The stages in this process are Retail Banking, Consumer Banking, Retail Lending.
-
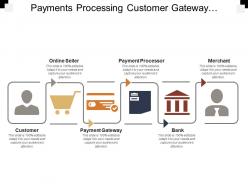 Payments processing customer gateway bank merchant
Presenting, payments processing customer gateway bank merchant PPT deck. This presentation diagram has been professionally designed and is fully editable in a PowerPoint software. Can be readily transformed into PDF and JPG format. You can customize the font type, font size, colors of the design, and backdrop color as per your requirement. Exchange the dummy content in text placeholders with your display content. High-quality graphics and images guarantee that there is no depreciating in quality on increasing their size. The content is genuine and ready to use.
-
 Budget capex planning report icon
Presenting our set of slides with Budget Capex Planning Report Icon. This exhibits information on three stages of the process. This is an easy to edit and innovatively designed PowerPoint template. So download immediately and highlight information on Budget Capex Planning Report Icon.
-
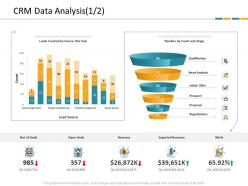 Crm application dashboard snapshot crm data analysis ppt file ideas
Present the topic in a bit more detail with this CRM Application Dashboard Snapshot CRM Data Analysis Ppt File Ideas. Use it as a tool for discussion and navigation on Open Deals, Lead Source, Revenue, Expected Revenue, Win. This template is free to edit as deemed fit for your organization. Therefore download it now.
-
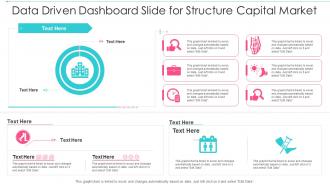 Data Driven Dashboard Snapshot Slide For Structure Capital Market Infographic Template
Deploy our Data Driven Dashboard Snapshot Slide For Structure Capital Market Infographic Template to present high-quality presentations. It is designed in PowerPoint and is available for immediate download in standard and widescreen sizes. Not only this, but this layout is also 100 percent editable, giving you full control over its applications.
-
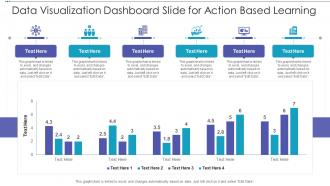 Data Visualization Dashboard Slide For Action Based Learning Infographic Template
This is a single slide titled Data Visualization Dashboard Slide For Action Based Learning Infographic Template. It is crafted using high-quality vector-based visuals that are 100 percent editable and available for immediate download in standard and widescreen aspect ratios.
-
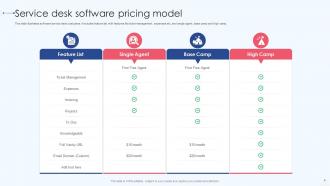 Service Desk Software Pricing Model
This slide illustrates software service desk cost plans. it includes feature list with features like ticket management, expenses etc, and single agent, base camp and high camp. Presenting our well structured Service Desk Software Pricing Model. The topics discussed in this slide are Ticket Management, Knowledgeable, Invoicing. This is an instantly available PowerPoint presentation that can be edited conveniently. Download it right away and captivate your audience.
-
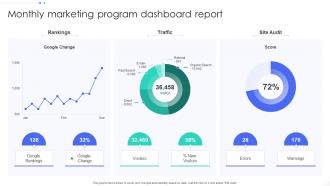 Monthly Marketing Program Dashboard Snapshot Report
Presenting our well structured Monthly Marketing Program Dashboard Snapshot Report. The topics discussed in this slide are Rankings, Traffic, Site Audit. This is an instantly available PowerPoint presentation that can be edited conveniently. Download it right away and captivate your audience.
-
 CRM Implementation Dashboard With Customer Satisfaction Sales CRM Cloud Implementation
This slide illustrates the issues that trigger poor relationship with customers which includes no real time support, no innovative product launched, bad after sale service and lack of engagement. Present the topic in a bit more detail with this Sales CRM Cloud Implementation Poor Relationship With Customers Ppt Slides Picture. Use it as a tool for discussion and navigation on Weak Relationship Building, Poor Customer Service, Product Launched. This template is free to edit as deemed fit for your organization. Therefore download it now.
-
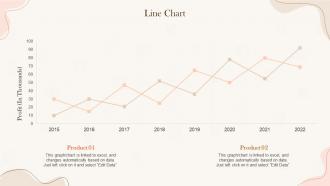 Line Chart Implementing Project Time Management Strategies
Present the topic in a bit more detail with this Line Chart Implementing Project Time Management Strategies. Use it as a tool for discussion and navigation on Line Chart, Product, Profit. This template is free to edit as deemed fit for your organization. Therefore download it now.
-
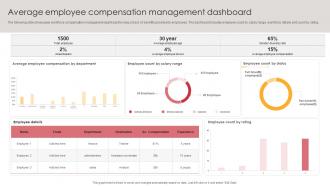 Average Employee Compensation Management Dashboard
The following slide showcases workforce compensation management dashboard to keep a track of benefits provided to employees. The dashboard includes employee count by salary range, workforce details and count by rating. Introducing our Average Employee Compensation Management Dashboard set of slides. The topics discussed in these slides are Average Employee Compensation, Management Dashboard. This is an immediately available PowerPoint presentation that can be conveniently customized. Download it and convince your audience.
-
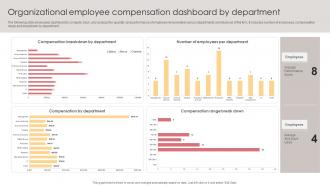 Organizational Employee Compensation Dashboard By Department
The following slide showcases dashboard to compute, track, and analyze the quantity and performance of employee remuneration across departments and divisions of the firm. It includes number of employees, compensation range and breakdown by department. Introducing our Organizational Employee Compensation Dashboard By Department set of slides. The topics discussed in these slides are Compensation Breakdown, Organizational Employee, Compensation Dashboard. This is an immediately available PowerPoint presentation that can be conveniently customized. Download it and convince your audience.
-
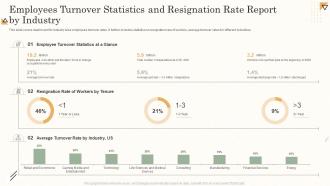 Employees Turnover Statistics And Resignation Rate Report By Industry
This slide covers dashboard for industry wise employees turnover rates. It further includes statistics on resignation rare of workers, average turnover rates for different industries. Introducing our Employees Turnover Statistics And Resignation Rate Report By Industry set of slides. The topics discussed in these slides are Employees Turnover, Statistics And Resignation, Rate Report By Industry. This is an immediately available PowerPoint presentation that can be conveniently customized. Download it and convince your audience.
-
 Dashboard Depicting Customer Retention Analytics Initiatives For Customer Attrition
This slide shows the dashboard that depicts customer retention analytics which includes net promoter score, customer loyalty rate, customer lifetime value, customer and revenue churn, monthly recurring revenue growth, etc. Present the topic in a bit more detail with this Dashboard Depicting Customer Retention Analytics Initiatives For Customer Attrition. Use it as a tool for discussion and navigation on Customer Loyalty Rate, Dashboard Depicting, Retention Analytics. This template is free to edit as deemed fit for your organization. Therefore download it now.
-
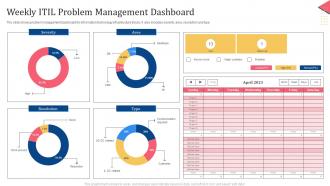 Weekly ITIL Problem Management Dashboard
The slide shows problem management dashboard for information technology infrastructure library. It also includes severity, area, resolution and type. Introducing our Weekly ITIL Problem Management Dashboard set of slides. The topics discussed in these slides are Severity, Resolution, Management Dashboard. This is an immediately available PowerPoint presentation that can be conveniently customized. Download it and convince your audience.


