Finance PowerPoint Templates, Presentation Slide Diagrams & PPT Graphics
- Sub Categories
-
- 30 60 90 Day Plan
- Advertising
- Agile Development
- Aims and Objectives
- Arrows
- Before and After
- Blockchain Bitcoin
- Boxes
- Business
- Calender
- Case Study
- Celebrations
- Certificates
- Challenges Opportunities
- Channel Distribution
- Children
- Communication
- Competitive Landscape
- Computer
- Concepts
- Construction Management
- Corporate
- Crowdfunding
- Current State Future State
- Custom PowerPoint Diagrams
- Digital Transformation
- Dos and Donts
- Economics
- Education
- Environment
- Events
- Festival
- Finance
- Financials
- Food
- Game
- Gap Analysis
- Generic
- Geographical
- Health
- Heatmaps
- Holidays
- Icons
- Input Process Output
- Internet
- Key Messages
- Key Wins
- Ladder
- Leadership
- Lists
- Lucky Draw
- Management
- Marketing
- Measuring
- Medical
- Music
- News
- Next Steps
- People Process Technology
- Pillars
- Planning
- Post-it-Notes
- Problem Statement
- Process
- Proposal Management
- Pros and Cons
- Puzzle
- Puzzles
- Recruitment Strategy
- Religion
- Research and Development
- Risk Mitigation Strategies
- Roadmap
- Selling
- Shapes
- Short Term Long Term
- Social
- Stairs
- Start Stop Continue
- Strategy
- Symbol
- Technology
- Thesis Defense Dissertation
- Timelines
- Traffic
- Transition Plan
- Transportation
- Vehicles
- Venture Capital Funding
- Warning
- Winners
- Word Cloud
-
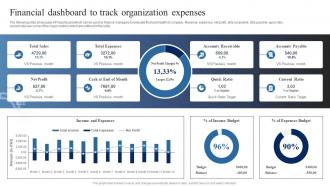 Market Analysis Of Information Technology Financial Dashboard To Track Organization Expenses
The following slide showcases KPI dashboard which can be used by finance managers to evaluate financial health of company. Revenue, expenses, net profit, bills receivable, bills payable, quick ratio, current ratio are some of the major metrics which are outlined in the slide. Present the topic in a bit more detail with this Market Analysis Of Information Technology Financial Dashboard To Track Organization Expenses. Use it as a tool for discussion and navigation on Financial Dashboard, Track Organization Expenses, Expenses Budget. This template is free to edit as deemed fit for your organization. Therefore download it now.
-
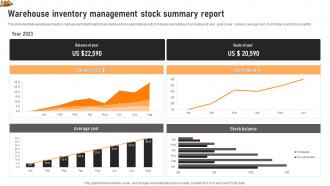 Warehouse Inventory Management Stock Summary Report
This slide illustrate warehouse inventory management dashboard of perishable and non perishable goods. It includes elements such as balance pf year, goal of year, balance, average cost, stock balance and stock quantity. Introducing our Warehouse Inventory Management Stock Summary Report set of slides. The topics discussed in these slides are Average Cost, Stock Balance, Summary Report. This is an immediately available PowerPoint presentation that can be conveniently customized. Download it and convince your audience.
-
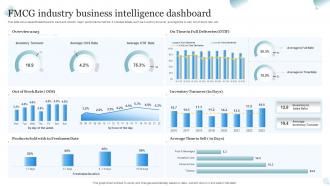 FMCG Industry Business Intelligence Dashboard
This slide showcases BI dashboard to track and monitor major performance metrics. It includes details such as inventory turnover, average time to sell, out of stock rate, etc. Introducing our FMCG Industry Business Intelligence Dashboard set of slides. The topics discussed in these slides are Full Deliveries, Sales Ratio, Inventory Turnover. This is an immediately available PowerPoint presentation that can be conveniently customized. Download it and convince your audience.
-
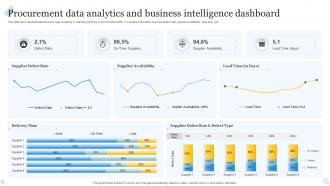 Procurement Data Analytics And Business Intelligence Dashboard
This slide showcases BI dashboard to help company in real time tracking of procurement KPIs. It includes information such as defect rate, supplier availability, lead time, etc. Introducing our Procurement Data Analytics And Business Intelligence Dashboard set of slides. The topics discussed in these slides are Supplier Defect Rate, Supplier Availability, Lead Time. This is an immediately available PowerPoint presentation that can be conveniently customized. Download it and convince your audience.
-
 Agriculture Business Management Dashboard With Sales Volume
Introducing our Agriculture Business Management Dashboard With Sales Volume set of slides. The topics discussed in these slides are Sales Volume, Order Value, Selling Items. This is an immediately available PowerPoint presentation that can be conveniently customized. Download it and convince your audience. The slide showcases a dashboard for farm business management which provides real time insights of business. It covers aspects like sales volume, order value, top selling items, inventory insights, top customers and new customers.
-
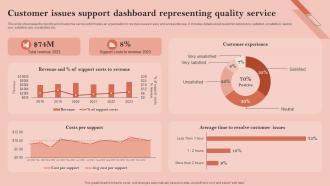 Customer Issues Support Dashboard Representing Quality Service
This slide showcases the dashboard of customer service which helps an organization to resolve issues in easy and accessible way. It includes details about customer experience, satisfied, unsatisfied, neutral, very satisfied, very unsatisfied, etc. Introducing our Customer Issues Support Dashboard Representing Quality Service set of slides. The topics discussed in these slides are Support Costs To Revenue, Total Revenue. This is an immediately available PowerPoint presentation that can be conveniently customized. Download it and convince your audience.
-
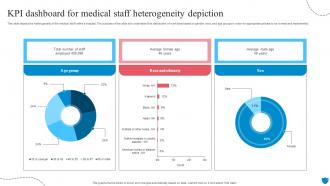 KPI Dashboard For Medical Staff Heterogeneity Depiction
This slide depicts the heterogeneity of the medical staff within a hospital. The purpose of this slide is to understand the distribution of workforce based on gender, race, and age groups in order for appropriate policies to be formed and implemented. Introducing our KPI Dashboard For Medical Staff Heterogeneity Depiction set of slides. The topics discussed in these slides are Dashboard For Medical, Staff Heterogeneity Depiction. This is an immediately available PowerPoint presentation that can be conveniently customized. Download it and convince your audience.
-
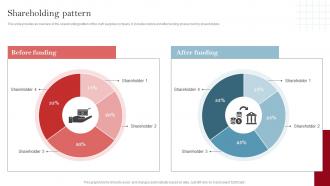 Shareholding Pattern Craft Supply Kits Provider Investor Funding Pitch Deck
This slide provides an overview of the shareholding pattern of the craft supplies company. It includes before and after funding shares held by shareholders. Deliver an outstanding presentation on the topic using this Shareholding Pattern Craft Supply Kits Provider Investor Funding Pitch Deck. Dispense information and present a thorough explanation of Provides, Supplies, Includes using the slides given. This template can be altered and personalized to fit your needs. It is also available for immediate download. So grab it now.
-
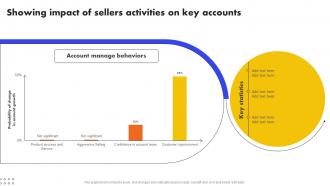 Showing Impact Of Sellers Activities On Key Accounts Analyzing And Managing Strategy SS V
Present the topic in a bit more detail with this Showing Impact Of Sellers Activities On Key Accounts Analyzing And Managing Strategy SS V Use it as a tool for discussion and navigation on Account Manage Behaviors, Showing Impact, Sellers Activities This template is free to edit as deemed fit for your organization. Therefore download it now.
-
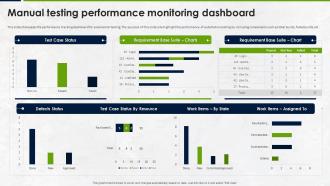 Manual Testing Strategies For Quality Manual Testing Performance Monitoring Dashboard
This slide showcases the performance tracking dashboard for automation testing. The purpose of this slide is to highlight the performance of automation testing by including components such as total builds, failed builds, etc. Deliver an outstanding presentation on the topic using this Manual Testing Strategies For Quality Manual Testing Performance Monitoring Dashboard. Dispense information and present a thorough explanation of Manual Testing Performance, Monitoring Dashboard, Tracking Dashboard using the slides given. This template can be altered and personalized to fit your needs. It is also available for immediate download. So grab it now.
-
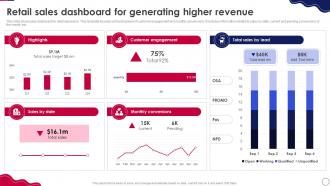 Retail Expansion Strategies To Grow Retail Sales Dashboard For Generating Higher Revenue
This slide showcases dashboard for retail expansion. This template focuses on tracking level of customer engagement and monthly conversions. It includes information related to sales by state, current and pending conversions of the month, etc. Deliver an outstanding presentation on the topic using this Retail Expansion Strategies To Grow Retail Sales Dashboard For Generating Higher Revenue. Dispense information and present a thorough explanation of Retail Sales Dashboard, Generating Higher Revenue, Customer Engagement, Monthly Conversions using the slides given. This template can be altered and personalized to fit your needs. It is also available for immediate download. So grab it now.
-
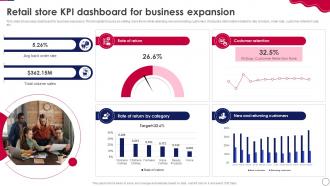 Retail Expansion Strategies To Grow Retail Store KPI Dashboard For Business Expansion
This slide showcases dashboard for business expansion. This template focuses on selling more items while retaining new and existing customers. It includes information related to rate of return, order rate, customer retention rate, etc. Deliver an outstanding presentation on the topic using this Retail Expansion Strategies To Grow Retail Store KPI Dashboard For Business Expansion. Dispense information and present a thorough explanation of Retail Store KPI Dashboard, Business Expansion, Customer Retention Rate using the slides given. This template can be altered and personalized to fit your needs. It is also available for immediate download. So grab it now.
-
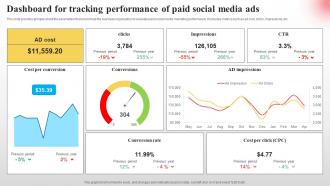 Dashboard For Tracking Performance Implementing Paid Social Media Advertising Strategies
This slide provides glimpse about the parameters that would help the business organization to evaluate paid social media marketing performance. It includes metrics such as ad cost, clicks, impressions, etc. Deliver an outstanding presentation on the topic using this Dashboard For Tracking Performance Implementing Paid Social Media Advertising Strategies. Dispense information and present a thorough explanation of Conversions, Impressions, Performance using the slides given. This template can be altered and personalized to fit your needs. It is also available for immediate download. So grab it now.
-
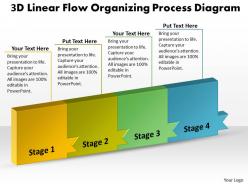 Ppt 3d linear flow organizing process diagram layouts powerpoint 2003 business templates 4 stages
Using this diagram you can easily visualize the operating cycle and information-flow, demonstrate the potential for optimizing and improvement, automation and management questions.
-
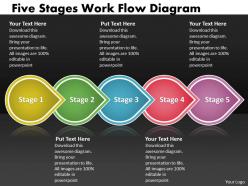 Ppt five stages work flow spider diagram powerpoint template business templates 5 stages
Present your ideas, concepts and processes with our professionally designed template for PowerPoint presentations. Decorate it with your well wrapped ideas and colorful thoughts.
-
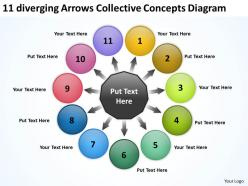 11 diverging arrows collective concepts diagram circular spoke powerpoint templates
Use this diagram to illustrate your ideas one by one and demonstrate how each is an important cog in running the entire wheel. Lead the way to spread good cheer to one and all.
-
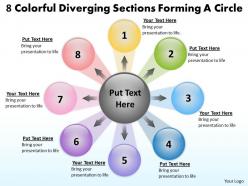 8 colorful diverging sections forming a circle circular flow layout diagram powerpoint slides
We are proud to present our 8 colorful diverging sections forming a circle circular flow layout diagram powerpoint slides. This diagram make your audience understands essential elements of your overall strategy and also shows an organized view of business services and processes.
-
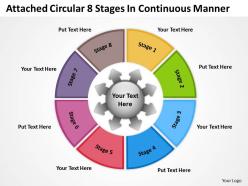 Attached circular 8 stages in continuous manner arrows network software powerpoint templates
We are proud to present our attached circular 8 stages in continuous manner arrows network software powerpoint templates. If you need to create advanced, completely customizable diagrams for your data, this is a perfect diagram with excellent graphics that help you convey your ideas successfully - no matter what they are
-
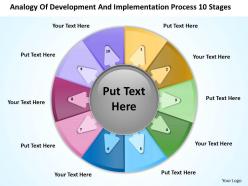 Business use case diagram example and implementation process 10 stages powerpoint templates
We are proud to present our business use case diagram example and implementation process 10 stages powerpoint templates. Develop competitive advantage with our above template which contains an image of circular process. Circle diagrams are used to show relationships between items. Like your thoughts arrows are inherently precise and true. Illustrate your plans to your listeners with the same accuracy. Show them how to persistently hit bulls eye.
-
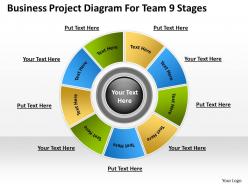 Business workflow diagram project for team 9 stages powerpoint slides
We are proud to present our business workflow diagram project for team 9 stages powerpoint slides. Use this diagram for visualization of production processes, stages of production activities of the department, company, etc. This PowerPoint diagram consists of nine stages for project management. Deliver amazing presentations to mesmerize your audience.
-
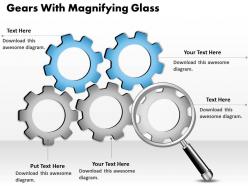 0314 business ppt diagram gears with magnifying glass powerpoint template
We are proud to present our 0314 business ppt diagram gears with magnifying glass powerpoint template. Our 0314 Business Ppt Diagram Gears With Magnifying Glass Powerpoint Template are the sinews of your lecture. Give them the muscle of your vibrant thoughts. Our management give you the basic framework of your talk. Give it the shape you desire with your wonderful views.
-
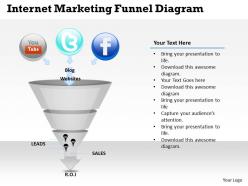 0314 business ppt diagram internet marketing funnel diagram powerpoint template
We are proud to present our 0314 business ppt diagram internet marketing funnel diagram powerpoint template. Our 0314 Business Ppt Diagram Internet Marketing Funnel Diagram Powerpoint Template are the heartstrings of your brilliant song. Strum them and produce a tune certain to touch the souls of your audience. Our arrows are the essential beat of your lilting melody. Adorn them with your tuneful thoughts and top the charts.
-
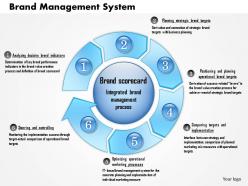 0514 brand management system powerpoint presentation
We are proud to present our 0514 brand management system powerpoint presentation. This Diagram is a visual representation of Brand management system. This diagram helps expound on the logic of your detailed thought process to take your company forward. Deliver amazing presentations to mesmerize your audience.
-
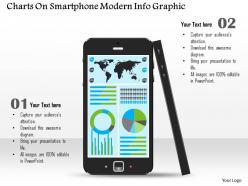 0814 business consulting diagram charts on smartphone modern info graphic powerpoint slide template
High resolution PPT visuals do not pixel ate even after customization. All the PPT icons, text, background and diagrams can be edited to match your need. It can further be saved in any format of your choice (JPG/JPEG/PDF). Precise and easy to comprehend information on PPT sample. Guidance for editing of the PPT visual diagram is provided for assistance. It’s a useful PowerPoint slide design for business owners, operations mangers, marketing executive, professors and students
-
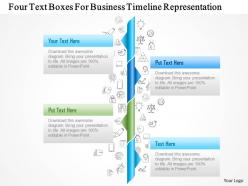 1214 four text boxes for business timeline representation powerpoint template
We are proud to present our 1214 four text boxes for business timeline representation powerpoint template. Explain the importance of business timeline in any presentation by using this innovative PPT diagram. This power point template has been designed with graphic of four text boxes in timeline style. Use this PPT and build exclusive presentation for your viewers.
-
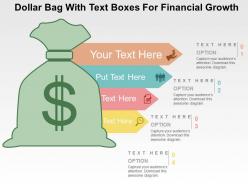 Dollar bag with text boxes for financial growth flat powerpoint design
We are proud to present our dollar bag with text boxes for financial growth flat powerpoint design. Graphic of dollar bag and text boxes has been used to design this power point template diagram. This PPT diagram contains the concept of financial growth. Use this PPT diagramfor finance and data related presentations.
-
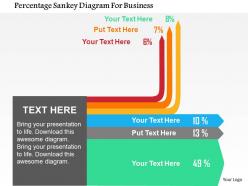 Percentage sankey diagram for business flat powerpoint design
We are proud to present our percentage sankey diagram for business flat powerpoint design. Graphic of percentage Sankey diagram has been used to craft this power point template diagram. This PPT diagram contains the concept of visualization from one set of values to other. Use this PPT diagram and build an exclusive presentation for your business related topics.
-
 Measure and monitor organization and operations ppt slide
Presenting measure and monitor organization and operations ppt slide. Presenting measure and monitor organization and operations ppt slide. This is a measure and monitor organization and operations ppt slide. This is a three stage process. The stages in this process are finance, strategy, management, business.
-
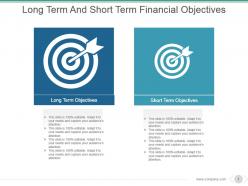 Long term and short term financial objectives powerpoint slide design ideas
Presenting long term and short term financial objectives powerpoint slide design ideas. This is a long term and short term financial objectives powerpoint slide design ideas. This is a two stage process. The stages in this process are long term objectives, short term objectives.
-
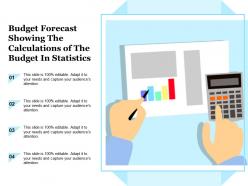 Budget forecast showing the calculations of the budget in statistics
Presenting this set of slides with name - Budget Forecast Showing The Calculations Of The Budget In Statistics. This is a four stage process. The stages in this process are Budget Forecast, Forecast Vs Actual Budget, Plan Vs Forecast.
-
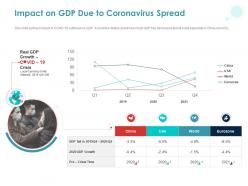 Impact on gdp due to coronavirus spread ppt powerpoint presentation examples
This slide portrays impact of COVID-19 outbreak on GDP. It provides details about how much GDP has decreased global scale especially in China and USA. Presenting this set of slides with name Impact On Gdp Due To Coronavirus Spread Ppt Powerpoint Presentation Examples. The topics discussed in these slides are China, USA, World, Eurozone. This is a completely editable PowerPoint presentation and is available for immediate download. Download now and impress your audience.
-
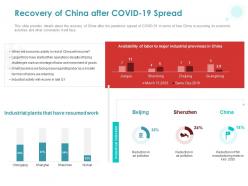 Recovery of china after covid 19 spread ppt powerpoint presentation outline shapes
This slide provides details about the recovery of China after the pandemic spread of COVID-19 in terms of how China is resuming its economic activities and what constraints it will face. Presenting this set of slides with name Recovery Of China After COVID 19 Spread Ppt Powerpoint Presentation Outline Shapes. The topics discussed in these slides are Beijing, Shenzhen, China, Industrial Plants That Have Resumed Work, Industrial Indicator. This is a completely editable PowerPoint presentation and is available for immediate download. Download now and impress your audience.
-
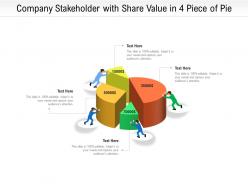 Company stakeholder with share value in 4 piece of pie
Presenting this set of slides with name Company Stakeholder With Share Value In 4 Piece Of Pie. This is a four stage process. The stages in this process are Company Stakeholder With Share Value In 4 Piece Of Pie. This is a completely editable PowerPoint presentation and is available for immediate download. Download now and impress your audience.
-
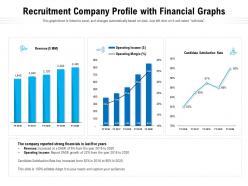 Recruitment company profile with financial graphs
Presenting our well-structured Recruitment Company Profile With Financial Graphs. The topics discussed in this slide are Revenue, Candidate Satisfaction Rate, Operating Income. This is an instantly available PowerPoint presentation that can be edited conveniently. Download it right away and captivate your audience.
-
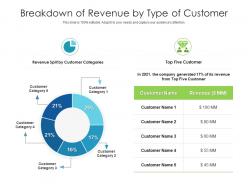 Breakdown of revenue by type of customer
Presenting our well-structured Breakdown Of Revenue By Type Of Customer. The topics discussed in this slide are Breakdown Of Revenue By Type Of Customer. This is an instantly available PowerPoint presentation that can be edited conveniently. Download it right away and captivate your audience.
-
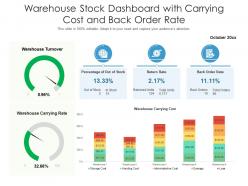 Warehouse stock dashboard with carrying cost and back order rate
Presenting our well-structured Warehouse Stock Dashboard With Carrying Cost And Back Order Rate. The topics discussed in this slide are Warehouse Turnover, Percentage Of Out Of Stock, Return Rate. This is an instantly available PowerPoint presentation that can be edited conveniently. Download it right away and captivate your audience.
-
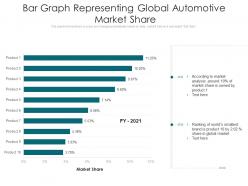 Bar graph representing global automotive market share
Present the topic in a bit more detail with this Bar Graph Representing Global Automotive Market Share. Use it as a tool for discussion and navigation on Bar Graph Representing Global Automotive Market Share. This template is free to edit as deemed fit for your organization. Therefore download it now.
-
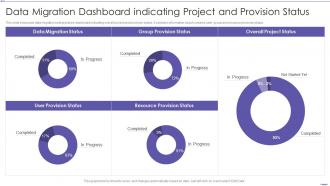 Data Migration Dashboard Snapshot Indicating Project And Provision Status
This slide showcase data migration best practices dashboard snapshot indicating overall project and provision status. It contains information about contains user, group and resource provision status. Presenting our well structured Data Migration Dashboard Indicating Project And Provision Status. The topics discussed in this slide are Data Migration Status, Overall Project Status, Resource Provision Status. This is an instantly available PowerPoint presentation that can be edited conveniently. Download it right away and captivate your audience.
-
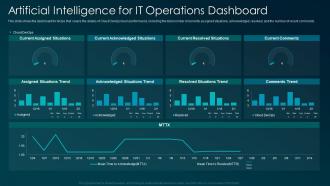 Artificial intelligence for IT operations dashboard snapshot ppt introduction
This slide shows the dashboard for AIOps that covers the details of Cloud DevOps team performance, including the total number of currently assigned situations, acknowledged, resolved, and the number of recent comments. Present the topic in a bit more detail with this artificial intelligence for IT operations dashboard snapshot ppt introduction. Use it as a tool for discussion and navigation on Assigned Situations, Acknowledged Situations, Resolved Situations. This template is free to edit as deemed fit for your organization. Therefore download it now.
-
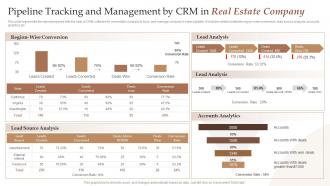 Pipeline Tracking And Management By CRM In Real Estate Company
This slide represents the report prepared with the help of CRM software for real estate company to track and manage companys sales pipeline. It includes details related to region-wise conversion, lead source analysis, accounts analytics etc. Presenting our well-structured Pipeline Tracking And Management By CRM In Real Estate Company. The topics discussed in this slide are Lead Source Analysis, Lead Analysis, Accounts Analytics. This is an instantly available PowerPoint presentation that can be edited conveniently. Download it right away and captivate your audience.
-
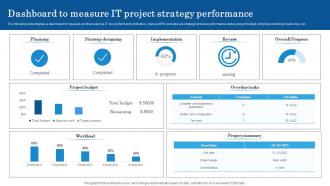 Dashboard To Measure IT Project Strategy Performance
The following slide displays a dashboard to measure and track various IT key performance indicators. Various KPIs included are strategic process performance status, project budget, employee workload, tasks due, etc Introducing our Dashboard To Measure IT Project Strategy Performance set of slides. The topics discussed in these slides are Planning, Strategy Designing, Implementation, Review, Overall Progress. This is an immediately available PowerPoint presentation that can be conveniently customized. Download it and convince your audience.
-
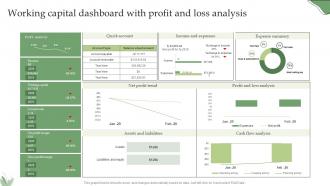 Working Capital Dashboard With Profit And Loss Analysis
Introducing our Working Capital Dashboard With Profit And Loss Analysis set of slides. The topics discussed in these slides are Working Capital Dashboard, Profit And Loss Analysis. This is an immediately available PowerPoint presentation that can be conveniently customized. Download it and convince your audience.
-
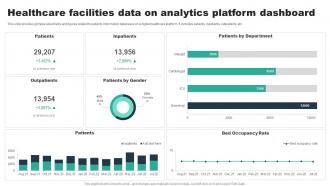 Healthcare Facilities Data On Analytics Platform Dashboard
This slide provides glimpse about facts and figures related to patients information databases on a digital healthcare platform. It includes patients, inpatients, outpatients, etc. Presenting our well-structured Healthcare Facilities Data On Analytics Platform Dashboard. The topics discussed in this slide are Outpatients, Patients, Inpatients, Patients By Gender. This is an instantly available PowerPoint presentation that can be edited conveniently. Download it right away and captivate your audience.
-
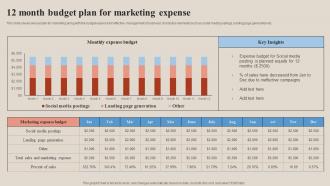 12 Month Budget Plan For Marketing Expense
This slide shows annual plan for marketing along with the budget expense for effective management of business. It includes elements such as social media postings, landing page generation etc. Presenting our well structured 12 Month Budget Plan For Marketing Expense. The topics discussed in this slide are Social Media Postings, Landing Page Generation, Percent Of Sales. This is an instantly available PowerPoint presentation that can be edited conveniently. Download it right away and captivate your audience.
-
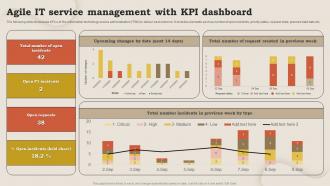 Agile IT Service Management With KPI Dashboard
The following slide showcases KPA s of the information technology service administration ITSM to deliver best outcome. It includes elements such as number of open incidents, priority status, request state, planned start date etc. Presenting our well structured Agile IT Service Management With KPI Dashboard. The topics discussed in this slide are Previous Week, Upcoming Changes, Request Created. This is an instantly available PowerPoint presentation that can be edited conveniently. Download it right away and captivate your audience.
-
 B2B Business User Experience Map
This slide provides glimpse about a customer journey map for a business to business company to meet user experience. It includes touchpoints, barriers, motivators, etc. Introducing our B2B Business User Experience Map set of slides. The topics discussed in these slides are Touchpoints, Barriers, Motivators, Implementation. This is an immediately available PowerPoint presentation that can be conveniently customized. Download it and convince your audience.
-
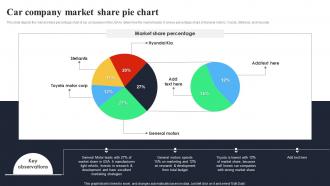 Car Company Market Share Pie Chart
This slide depicts the market share percentage chart of car companies in the USA to determine the market leader. It shows percentage share of General motors, Toyota, Stellanis and Hyundai. Introducing our Car Company Market Share Pie Chart set of slides. The topics discussed in these slides are Toyota Motor Corp, General Motors, Market Share Percentage. This is an immediately available PowerPoint presentation that can be conveniently customized. Download it and convince your audience.
-
 Social Media Channels Preference Pie Chart
This slide illustrates the percentage usage preference of social media channels. It includes percentages of Facebook, Instagram, LinkedIn, YouTube, Twitter and Pinterest. Introducing our Social Media Channels Preference Pie Chart set of slides. The topics discussed in these slides are Social Media, Channels Preference, Pie Chart. This is an immediately available PowerPoint presentation that can be conveniently customized. Download it and convince your audience.
-
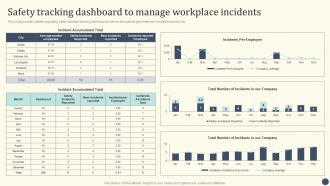 Essential Initiatives To Safeguard Safety Tracking Dashboard To Manage Workplace Incidents
This slide provides details regarding safety activities tracking dashboard in terms of incidents per employee, incidents tracked, etc. Present the topic in a bit more detail with this Essential Initiatives To Safeguard Safety Tracking Dashboard To Manage Workplace Incidents. Use it as a tool for discussion and navigation on Safety Tracking, Dashboard To Manage, Workplace Incidents This template is free to edit as deemed fit for your organization. Therefore download it now.
-
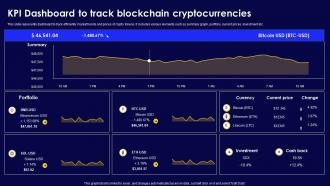 Kpi Dashboard To Track Blockchain Cryptocurrencies
This slide represents dashboard to track efficiently market trends and prices of crypto tokens. It includes various elements such as summary graph, portfolio, current prices, investment etc. Introducing our Kpi Dashboard To Track Blockchain Cryptocurrencies set of slides. The topics discussed in these slides are Portfolio, Current Price. This is an immediately available PowerPoint presentation that can be conveniently customized. Download it and convince your audience.
-
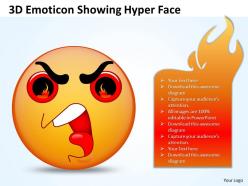 Business powerpoint templates 3d emoticon showing hyper face sales ppt slides
This 3D Emoticon PowerPoint Diagram Shows you the Ferocious and annoyed face. You can use this Diagram to express your views in different situations. With this many other emoticons are attached.
-
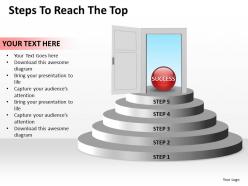 Business powerpoint templates steps to reach the top editable sales ppt slides
This template is skillfully designed and is completely editable to suit all the needs and requirements of the user. The color of the font, its size, style, and all other elements can be customized according to the user's desire The text in the PPT placeholder can be replaced with the desired information making this template highly flexible and adaptable as well. This template is also compatible with various Microsoft versions and formats like Google Slides, JPG, PDF, etc so the user will face no issue in saving it in the format of his choice.
-
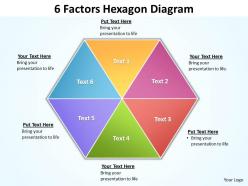 6 factors hexagon diagram editable powerpoint slides templates
This Business PowerPoint Diagram shows you the regular Hexagon describing six issues in one particular slide of Presentation. It symbolizes six-pointed star, Jewish star, Star of Bethlehem, stile, hexagon, hexagram and hexahedron.
-
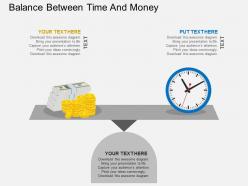 Balance between time and money flat powerpoint design
We are proud to present our balance between time and money flat powerpoint design. Concept of balance between money and time has been displayed in this power point template diagram. This PPT diagram contains the graphic of balance scale ,money and clock. Use this PPT diagram for finance and time related presentations.
-
 Globe with four financial icons and banking solution flat powerpoint design
We are proud to present our globe with four financial icons and banking solution flat powerpoint design. Graphic of globe with four financial icons has been used to craft this power point template diagram. This PPT diagram contains the concept of financial and banking solution. Use this PPT diagram for business and finance related presentations.
-
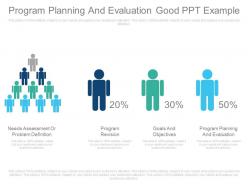 Custom program planning and evaluation good ppt example
Presenting custom program planning and evaluation good ppt example. This is a program planning and evaluation good ppt example. This is a four stage process. The stages in this process are needs assessment or problem definition, program revision, goals and objectives, program planning and evaluation.
-
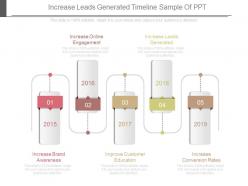 Increase leads generated timeline sample of ppt
Use of innovative and high quality background images. 100% editing of the slides allowed. Allow editing with the Google slides. Easy to download and save in various formats. No effect on quality when opened on a wide screen. Useful for the project leads, employees and the business managers.The stages in this process are increase online engagement, increase leads generated, increase brand awareness, improve customer education, increase conversion rates.
-
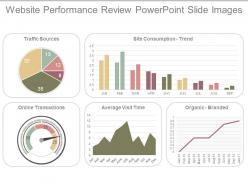 Website performance review powerpoint slide images
Presenting website performance review powerpoint slide images. This is a website performance review powerpoint slide images. This is a five stage process. The stages in this process are site consumption trend, organic branded, average visit time, online transactions, traffic sources.
-
 Crowd funding powerpoint presentation slides
Presenting Crowdfunding PowerPoint Presentation Slides. Set of 57 PowerPoint Slides and professional layouts. When you download the PPT, you get the deck in both widescreen (16:9) and standard (4:3) aspect ratio. This ready-to-use PPT comprises visually stunning PowerPoint templates, vector icons, images, data-driven charts and graphs and business diagrams. The PowerPoint presentation is 100% editable. Customize the presentation background, font, and colours as per your company’s branding. The slide templates are compatible with Google slides, PDF and JPG formats
-
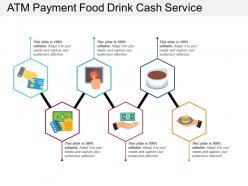 Atm payment food drink cash service
Presenting Atm Payment Food Drink Cash Service. The template is compatible with Google Slides. Feel free to alter the slide according to the needs. Also, you can add appealing data visualization tools including charts, graphs, tables, etc. to the slide. It is further editable in MS PowerPoint and similar software. You can save it into common images or document formats such as JPEG, PNG or PDF. High-quality graphics will prevent distortion at any cost.


