Finance PowerPoint Templates, Presentation Slide Diagrams & PPT Graphics
- Sub Categories
-
- 30 60 90 Day Plan
- Advertising
- Agile Development
- Aims and Objectives
- Arrows
- Before and After
- Blockchain Bitcoin
- Boxes
- Business
- Calender
- Case Study
- Celebrations
- Certificates
- Challenges Opportunities
- Channel Distribution
- Children
- Communication
- Competitive Landscape
- Computer
- Concepts
- Construction Management
- Corporate
- Crowdfunding
- Current State Future State
- Custom PowerPoint Diagrams
- Digital Transformation
- Dos and Donts
- Economics
- Education
- Environment
- Events
- Festival
- Finance
- Financials
- Food
- Game
- Gap Analysis
- Generic
- Geographical
- Health
- Heatmaps
- Holidays
- Icons
- Input Process Output
- Internet
- Key Messages
- Key Wins
- Ladder
- Leadership
- Lists
- Lucky Draw
- Management
- Marketing
- Measuring
- Medical
- Music
- News
- Next Steps
- People Process Technology
- Pillars
- Planning
- Post-it-Notes
- Problem Statement
- Process
- Proposal Management
- Pros and Cons
- Puzzle
- Puzzles
- Recruitment Strategy
- Religion
- Research and Development
- Risk Mitigation Strategies
- Roadmap
- Selling
- Shapes
- Short Term Long Term
- Social
- Stairs
- Start Stop Continue
- Strategy
- Symbol
- Technology
- Thesis Defense Dissertation
- Timelines
- Traffic
- Transition Plan
- Transportation
- Vehicles
- Venture Capital Funding
- Warning
- Winners
- Word Cloud
-
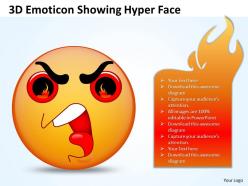 Business powerpoint templates 3d emoticon showing hyper face sales ppt slides
This 3D Emoticon PowerPoint Diagram Shows you the Ferocious and annoyed face. You can use this Diagram to express your views in different situations. With this many other emoticons are attached.
-
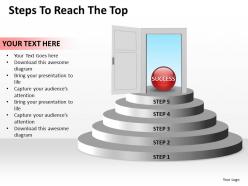 Business powerpoint templates steps to reach the top editable sales ppt slides
This template is skillfully designed and is completely editable to suit all the needs and requirements of the user. The color of the font, its size, style, and all other elements can be customized according to the user's desire The text in the PPT placeholder can be replaced with the desired information making this template highly flexible and adaptable as well. This template is also compatible with various Microsoft versions and formats like Google Slides, JPG, PDF, etc so the user will face no issue in saving it in the format of his choice.
-
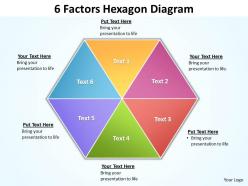 6 factors hexagon diagram editable powerpoint slides templates
This Business PowerPoint Diagram shows you the regular Hexagon describing six issues in one particular slide of Presentation. It symbolizes six-pointed star, Jewish star, Star of Bethlehem, stile, hexagon, hexagram and hexahedron.
-
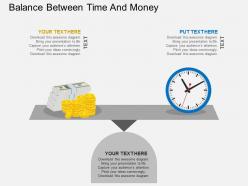 Balance between time and money flat powerpoint design
We are proud to present our balance between time and money flat powerpoint design. Concept of balance between money and time has been displayed in this power point template diagram. This PPT diagram contains the graphic of balance scale ,money and clock. Use this PPT diagram for finance and time related presentations.
-
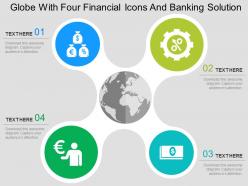 Globe with four financial icons and banking solution flat powerpoint design
We are proud to present our globe with four financial icons and banking solution flat powerpoint design. Graphic of globe with four financial icons has been used to craft this power point template diagram. This PPT diagram contains the concept of financial and banking solution. Use this PPT diagram for business and finance related presentations.
-
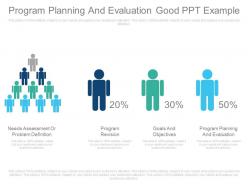 Custom program planning and evaluation good ppt example
Presenting custom program planning and evaluation good ppt example. This is a program planning and evaluation good ppt example. This is a four stage process. The stages in this process are needs assessment or problem definition, program revision, goals and objectives, program planning and evaluation.
-
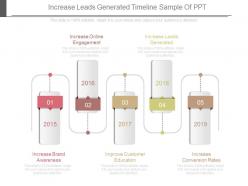 Increase leads generated timeline sample of ppt
Use of innovative and high quality background images. 100% editing of the slides allowed. Allow editing with the Google slides. Easy to download and save in various formats. No effect on quality when opened on a wide screen. Useful for the project leads, employees and the business managers.The stages in this process are increase online engagement, increase leads generated, increase brand awareness, improve customer education, increase conversion rates.
-
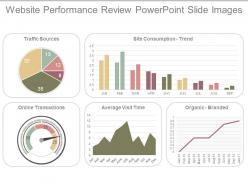 Website performance review powerpoint slide images
Presenting website performance review powerpoint slide images. This is a website performance review powerpoint slide images. This is a five stage process. The stages in this process are site consumption trend, organic branded, average visit time, online transactions, traffic sources.
-
 Atm payment food drink cash service
Presenting Atm Payment Food Drink Cash Service. The template is compatible with Google Slides. Feel free to alter the slide according to the needs. Also, you can add appealing data visualization tools including charts, graphs, tables, etc. to the slide. It is further editable in MS PowerPoint and similar software. You can save it into common images or document formats such as JPEG, PNG or PDF. High-quality graphics will prevent distortion at any cost.
-
 Coins stack cost structure icon
Presenting coins stack cost structure icon. This is a coins stack cost structure icon. This is a three stage process. The stages in this process are cost structure, budget framework, fun model.
-
 Customer acquisition cost powerpoint slide information
Presenting customer acquisition cost powerpoint slide information. This is a customer acquisition cost powerpoint slide information. This is a thirteen stage process. The stages in this process are team, composition, on target earnings, salary cost, total team cost, adjusted team cost.
-
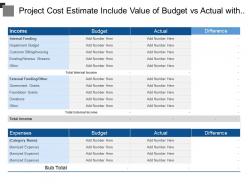 Project cost estimate include value of budget vs actual with their difference
Presenting this set of slides with name - Project Cost Estimate Include Value Of Budget Vs Actual With Their Difference. This is a three stage process. The stages in this process are Forecast Vs Actual Budget, Actual Vs Budget, Marketing Budget.
-
 Liquidity icon showing money bag
Presenting this set of slides with name - Liquidity Icon Showing Money Bag. This is a four stage process. The stages in this process are Cash Assets, Solvency, Liquidity.
-
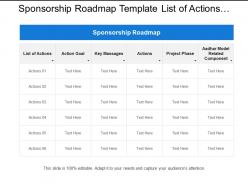 Sponsorship roadmap template list of actions goals
Presenting this set of slides with name - Sponsorship Roadmap Template List Of Actions Goals. This is a six stage process. The stages in this process are Sponsorship Roadmap Template, Sponsorship Timeline Template, Sponsorship Linear Process Template.
-
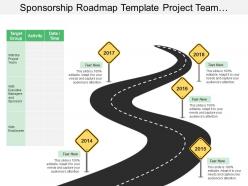 Sponsorship roadmap template project team activity date time
Presenting this set of slides with name - Sponsorship Roadmap Template Project Team Activity Date Time. This is a five stage process. The stages in this process are Sponsorship Roadmap Template, Sponsorship Timeline Template, Sponsorship Linear Process Template.
-
 Budget forecast showing the calculations of the budget in statistics
Presenting this set of slides with name - Budget Forecast Showing The Calculations Of The Budget In Statistics. This is a four stage process. The stages in this process are Budget Forecast, Forecast Vs Actual Budget, Plan Vs Forecast.
-
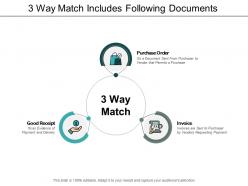 3 way match includes following documents
Presenting this set of slides with name - 3 Way Match Includes Following Documents. This is a three stage process. The stages in this process are Three Way Match,Three Document,Accounting.
-
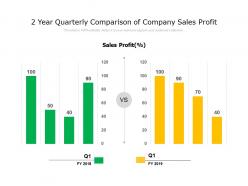 2 year quarterly comparison of company sales profit
Presenting this set of slides with name 2 Year Quarterly Comparison Of Company Sales Profit. The topics discussed in these slides are Year Comparison, Marking Strategy, Sales Profit. This is a completely editable PowerPoint presentation and is available for immediate download. Download now and impress your audience.
-
 Sales and roi performance chart for 6 months
Presenting this set of slides with name Sales And ROI Performance Chart For 6 Months. The topics discussed in these slides is Sales And ROI Performance Chart For 6 Months. This is a completely editable PowerPoint presentation and is available for immediate download. Download now and impress your audience.
-
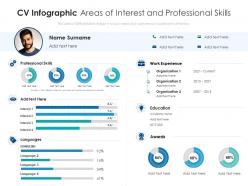 Cv infographic areas of interest and professional skills
Introducing our CV Infographic Areas Of Interest And Professional Skills. set of slides. The topics discussed in these slides are Professional Skills, Organization, Work Experience, Education, Awards. This is an immediately available PowerPoint presentation that can be conveniently customized. Download it and convince your audience.
-
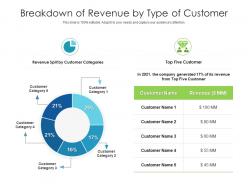 Breakdown of revenue by type of customer
Presenting our well-structured Breakdown Of Revenue By Type Of Customer. The topics discussed in this slide are Breakdown Of Revenue By Type Of Customer. This is an instantly available PowerPoint presentation that can be edited conveniently. Download it right away and captivate your audience.
-
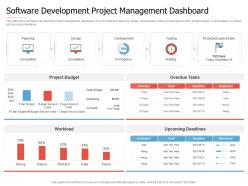 Software Development Project Management Dashboard Introduction To Agile Project Management
This slide shows software development project management dashboard. It covers status of planning, design, development, testing project launch date, project budget, overdue tasks, workload and upcoming deadlines. Deliver an outstanding presentation on the topic using this Software Development Project Management Dashboard Introduction To Agile Project Management. Dispense information and present a thorough explanation of Project Budget, Overdue Tasks, Workload, Upcoming Deadlines, Planning using the slides given. This template can be altered and personalized to fit your needs. It is also available for immediate download. So grab it now.
-
 Corporate Dashboard Snapshot Showing Details About Financial Performance And Ratios
This graph or chart is linked to excel, and changes automatically based on data. Just left click on it and select Edit Data. Presenting our well structured Corporate Dashboard Snapshot Showing Details About Financial Performance And Ratios. The topics discussed in this slide are Revenue YTD 2022, Short Term Assets, Global Financial Performance, Quick Ratio I Current Ratio I Debt Equity. This is an instantly available PowerPoint presentation that can be edited conveniently. Download it right away and captivate your audience.
-
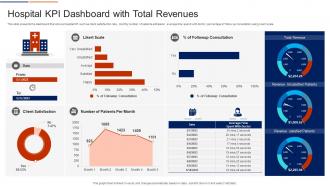 Hospital KPI Dashboard With Total Revenues
This slide presents the dashboard that shows hospital KPI such as client satisfaction rate, monthly number of patients admission, average time spend with doctor, percentage of follow up consultation using Likert scale. Introducing our Hospital KPI Dashboard With Total Revenues set of slides. The topics discussed in these slides are Likert Scale, Client Satisfaction, Sales. This is an immediately available PowerPoint presentation that can be conveniently customized. Download it and convince your audience.
-
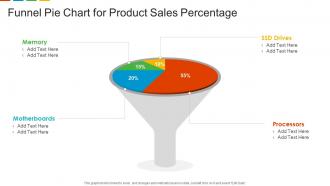 Funnel Pie Chart For Product Sales Percentage
This graph or chart is linked to excel, and changes automatically based on data. Just left click on it and select edit data. Introducing our Funnel Pie Chart For Product Sales Percentage set of slides. The topics discussed in these slides are Memory, SSD Drives, Motherboards, Processors. This is an immediately available PowerPoint presentation that can be conveniently customized. Download it and convince your audience.
-
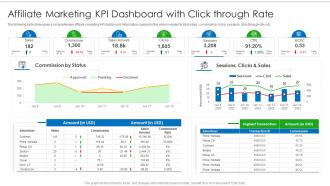 Affiliate Marketing KPI Dashboard With Click Through Rate
The following slide showcases a comprehensive affiliate marketing KPI dashboard. Information covered in this slide is related to total sales , commission, clicks, sessions, click-through rate, etc. Introducing our Affiliate Marketing KPI Dashboard With Click Through Rate set of slides. The topics discussed in these slides are Commission By Status, Sessions, Clicks And Sales, Highest Transaction, Sessions, Clicks And Sales. This is an immediately available PowerPoint presentation that can be conveniently customized. Download it and convince your audience.
-
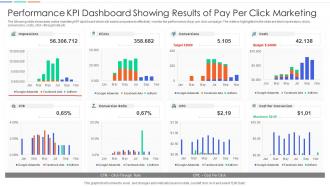 Performance KPI Dashboard Showing Results Of Pay Per Click Marketing
The following slide showcases online marketing KPI dashboard which will assist companies to effectively monitor the performance of pay per click campaign. The metrics highlighted in the slide are total impressions, clicks, conversions, costs, click through rate etc. Presenting our well structured Performance KPI Dashboard Showing Results Of Pay Per Click Marketing. The topics discussed in this slide are Impressions, Clicks, Conversions, Costs, Cost Per Conversion, Conversion Ratio, CPC. This is an instantly available PowerPoint presentation that can be edited conveniently. Download it right away and captivate your audience.
-
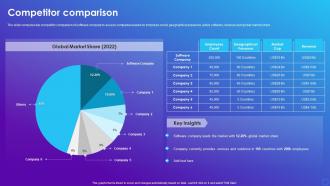 Competitor Comparison Software Company Profile Ppt Guidelines
The slide compares top competitor comparison of software company to assess companies based on employee count, geographical presence, active software, revenue and global market share. Present the topic in a bit more detail with this Competitor Comparison Software Company Profile Ppt Guidelines. Use it as a tool for discussion and navigation on Competitor Comparison. This template is free to edit as deemed fit for your organization. Therefore download it now
-
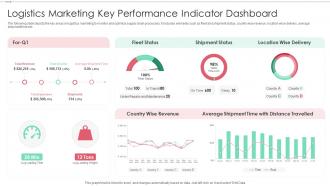 Logistics Marketing Key Performance Indicator Dashboard
The following slide depicts the key areas in logistics marketing to monitor and optimize supply chain processes. It includes elements such as fleet and shipment status, country wise revenue, location wise delivery, average shipment time etc. Introducing our Logistics Marketing Key Performance Indicator Dashboard set of slides. The topics discussed in these slides are Country Wise Revenue, Average Shipment, Distance Travelled. This is an immediately available PowerPoint presentation that can be conveniently customized. Download it and convince your audience.
-
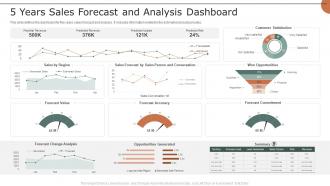 5 Years Sales Forecast And Analysis Dashboard
This slide defines the dashboard for five years sales forecast and analysis . It includes information related to the estimated and actual sales. Presenting our well structured 5 Years Sales Forecast And Analysis Dashboard. The topics discussed in this slide are Sales Forecast, Analysis Dashboard, Customer Satisfaction. This is an instantly available PowerPoint presentation that can be edited conveniently. Download it right away and captivate your audience.
-
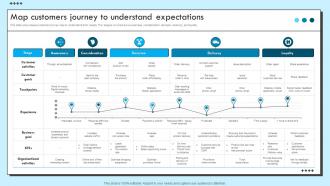 Map Customers Journey To Understand Expectations Improvement Strategies For Support
This slide provides an overview of individual and team goals of customer support department. Major goals covered are improve customer loyalty, increase satisfaction and retention, promote self service, etc. Deliver an outstanding presentation on the topic using this Map Customers Journey To Understand Expectations Improvement Strategies For Support. Dispense information and present a thorough explanation of Business Goal, Organizational Activities, Customer Activities using the slides given. This template can be altered and personalized to fit your needs. It is also available for immediate download. So grab it now.
-
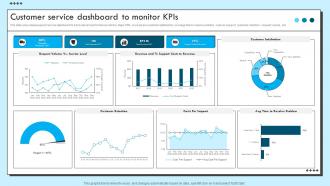 Customer Service Dashboard To Monitor KPIS Improvement Strategies For Support
This slide showcases dashboard depicting major customer service KPIs. The performance metrics covered are search exit rate, CSAT, average first response time, tickets solved, etc. Deliver an outstanding presentation on the topic using this Customer Service Dashboard To Monitor KPIS Improvement Strategies For Support. Dispense information and present a thorough explanation of Customer Retention, Costs Per Support, Revenue using the slides given. This template can be altered and personalized to fit your needs. It is also available for immediate download. So grab it now.
-
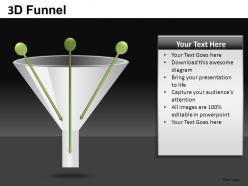 3d funnel powerpoint presentation slides db
These high quality, editable pre-designed powerpoint slides and powerpoint templates have been carefully created by our professional team to help you impress your audience. Each graphic in every powerpoint slide is vector based and is 100% editable in powerpoint. Each and every property of any slide - color, size, shading etc can be modified to build an effective powerpoint presentation. Use these slides to convey complex business concepts in a simplified manner. Any text can be entered at any point in the powerpoint slide. Simply DOWNLOAD, TYPE and PRESENT!
-
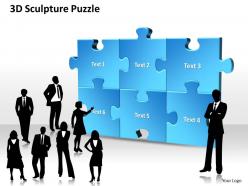 3d sculpture puzzle powerpoint templates ppt presentation slides 0812
Use this 3D cycle puzzle process diagram to show sequential steps in a process
-
 3d men doing work laptops networking internet ppt graphics icons
We are proud to present our 3d men doing work laptops networking internet ppt graphics icons. Use this Diagram to illustrate the Concept of team work as the men are sitting together doing work. This Diagram portrays the concepts of business, computer, education, home, internet, laptop, man, notebook, computer and business.
-
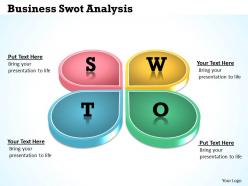 Business swot analysis powerpoint slides presentation diagrams templates
We are proud to present our business swot analysis powerpoint slides presentation diagrams templates. This PowerPoint diagram slide shows 4 quadrant. The slide can be used to represent various concepts. The SWOT analysis is an important tool used in business to highlight and identify strengths, weaknesses, opportunities and threats. It is an analytical method, which is used to identify and categorise significant internal factors strengths and weaknesses and external factors opportunities and threats an organisation faces. This diagram helps you to give enough attention to each aspect of your analysis.
-
 Text box for entering quote powerpoint slides presentation diagrams templates
We are proud to present our text box for entering quote powerpoint slides presentation diagrams templates. This PowerPoint diagram slide has a useful and stylish text box to show a quote. It encourage questions from audience at the end of your presentation. Original thinking is the need of the hour. We provide the means to project your views.
-
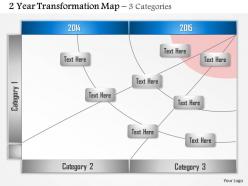 0514 3 category 2 year transformation map
We are proud to present our 0514 3 category 2 year transformation map. The transformation map provides clarity around where you need to get to and what activities will get you there. This transformation map design is a visualization tool which can help in business strategy discussion and support.
-
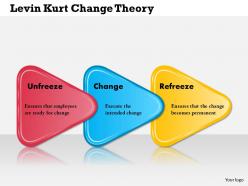 0514 lewin kurt change theory powerpoint presentation
We are proud to present our 0514 lewin kurt change theory powerpoint presentation. Lewin Kurt Change theory and this three step model is very much significant part of change management strategies for managing changes in the workplace. This PPT Slide is an excellent tool to make attractive business presentation.
-
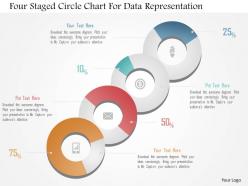 1214 four staged circle chart for data representation powerpoint template
We are proud to present our 1214 four staged circle chart for data representation powerpoint template. Four staged circle chart has been used to craft this power point template. This PPT contains the concept of data representation. Display data and related topics in your presentation with this unique PPT.
-
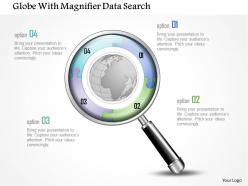 1214 globe with magnifier data search powerpoint template
We are proud to present our 1214 globe with magnifier data search powerpoint template. Graphic of globe with magnifier has been used to craft this PPT. This PPT contains the concept of data search and magnification. Display data related topics in any presentation with this exclusive PPT.
-
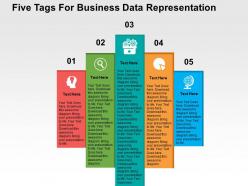 Five tags for business data representation flat powerpoint design
We are proud to present our five tags for business data representation flat powerpoint design. Graphic of five tags has been used to craft this power point template diagram. This PPT diagram contains the concept of business data representation. Use this PPT diagram for business and data related presentations.
-
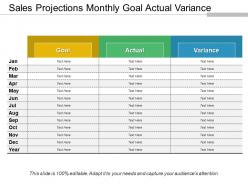 Sales projections monthly goal actual variance
Presenting sales projections monthly goal actual variance. This is a sales projections monthly goal actual variance. This is a three stage process. The stages in this process are forecast revenue, sales projections, sales forecast.
-
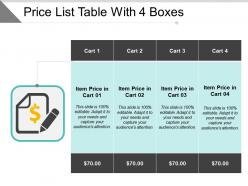 Price list table with 4 boxes
Presenting Price List Table With 4 Boxes template. Alter the font type, font size, colors of the diagram, etc. according to the requirements. The slide is designed according to your specific needs. It is customizable in PowerPoint and other office suites. The diagram is compatible with Google Slides and can be saved in multiple images and document formats such as JPG or PDF. High-quality images and icons ensure that distortion is prevented at any cost.
-
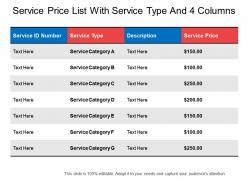 Service price list with service type and 4 columns
Presenting service price list with service type and 4 columns. This is a service price list with service type and 4 columns. This is a four stage process. The stages in this process are price list table with 4 boxes, price list differentiation design with 5 columns, price list diversification table with 4 columns, service price list with service type and 4 columns.
-
 Net present value showing weighing scale icon
Presenting this set of slides with name - Net Present Value Showing Weighing Scale Icon. This is a two stage process. The stages in this process are Capital Budget, Fixed Asset Expenditure, Net Present Value.
-
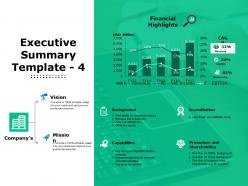 Executive summary ppt styles layouts
Presenting this set of slides with name - Executive Summary Ppt Styles Layouts. This is a five stage process. The stages in this process are Vision, Mission, Background, Accreditation, Capabilities.
-
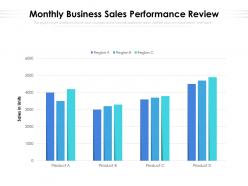 Monthly business sales performance review
Presenting this set of slides with name Monthly Business Sales Performance Review. The topics discussed in these slides are Sales, Product, Region. This is a completely editable PowerPoint presentation and is available for immediate download. Download now and impress your audience.
-
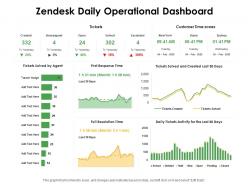 Zendesk daily operational dashboard ppt powerpoint presentation outline background
Presenting this set of slides with name Zendesk Daily Operational Dashboard Ppt Powerpoint Presentation Outline Background. The topics discussed in these slides are Time, Created, Customer Time. This is a completely editable PowerPoint presentation and is available for immediate download. Download now and impress your audience.
-
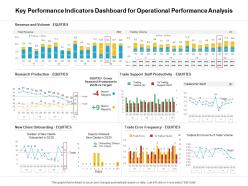 Key performance indicators dashboard for operational performance analysis ppt shapes
Presenting this set of slides with name Key Performance Indicators Dashboard For Operational Performance Analysis Ppt Shapes. The topics discussed in these slides are Key Performance, Indicators Dashboard, Operational Performance, Analysis. This is a completely editable PowerPoint presentation and is available for immediate download. Download now and impress your audience.
-
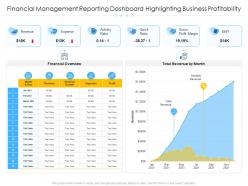 Financial management reporting dashboard highlighting business profitability
Introducing our Financial Management Reporting Dashboard Highlighting Business Profitability set of slides. The topics discussed in these slides are Revenue, Expense, Activity Ratio, Quick Ratio, Gross Profit Margin. This is an immediately available PowerPoint presentation that can be conveniently customized. Download it and convince your audience.
-
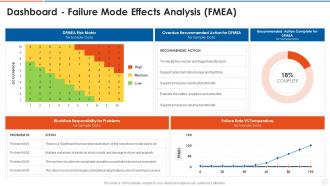 Dashboard failure mode effects analysis fmea ppt slides icon
Deliver an outstanding presentation on the topic using this Dashboard Failure Mode Effects Analysis FMEA Ppt Slides Icon. Dispense information and present a thorough explanation of Occurrence, Workflow Responsibility Problems, Sample Data, Failure Rate Vs Temperature using the slides given. This template can be altered and personalized to fit your needs. It is also available for immediate download. So grab it now.
-
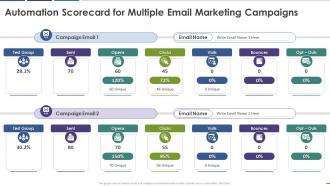 Automation scorecard for multiple email marketing campaigns
This graph or chart is linked to excel, and changes automatically based on data. Just left click on it and select Edit Data. Introducing Automation Scorecard For Multiple Email Marketing Campaigns to increase your presentation threshold. Encompassed with two stages, this template is a great option to educate and entice your audience. Dispence information on Test Group, Opens Visits, Bounces, Campaign Email, using this template. Grab it now to reap its full benefits.
-
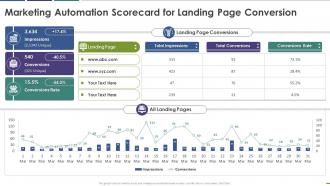 Marketing automation scorecard for landing page conversion
This graph or chart is linked to excel, and changes automatically based on data. Just left click on it and select Edit Data. Present the topic in a bit more detail with this Marketing Automation Scorecard For Landing Page Conversion. Use it as a tool for discussion and navigation on Landing Page Conversions, Landing Page, Total Impressions, Total Conversions, Conversions Rate. This template is free to edit as deemed fit for your organization. Therefore download it now.
-
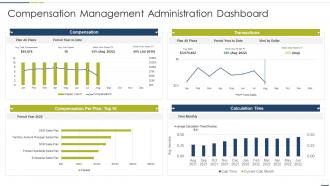 Compensation management administration dashboard
Present the topic in a bit more detail with this Compensation Management Administration Dashboard. Use it as a tool for discussion and navigation on Compensation, Transactions, Compensation Per Plan, Top 10, Calculation Time. This template is free to edit as deemed fit for your organization. Therefore download it now.
-
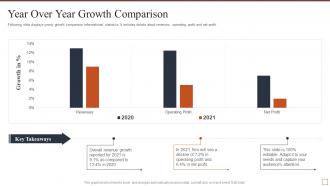 Year over year growth comparison effective brand building strategy
Following slide displays yearly growth comparison informational statistics. It includes details about revenues, operating profit and net profit. Present the topic in a bit more detail with this Year Over Year Growth Comparison Effective Brand Building Strategy. Use it as a tool for discussion and navigation on Year Over Year Growth Comparison. This template is free to edit as deemed fit for your organization. Therefore download it now.
-
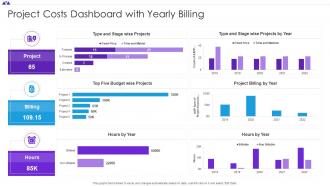 Project Costs Dashboard With Yearly Billing
This graph or chart is linked to excel, and changes automatically based on data. Just left click on it and select Edit Data. Introducing our Project Costs Dashboard With Yearly Billing set of slides. The topics discussed in these slides are Top Five Budget, Project Billing Year, Type And Stage. This is an immediately available PowerPoint presentation that can be conveniently customized. Download it and convince your audience.
-
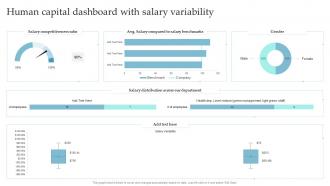 Human Capital Dashboard With Salary Variability
Presenting our well structured Human Capital Dashboard With Salary Variability. The topics discussed in this slide are Salary Compared, Salary Benchmarks, Salary Variability. This is an instantly available PowerPoint presentation that can be edited conveniently. Download it right away and captivate your audience.
-
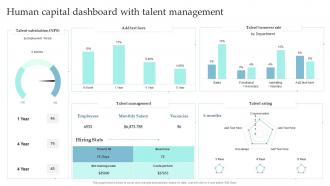 Human Capital Dashboard With Talent Management
Introducing our Human Capital Dashboard With Talent Management set of slides. The topics discussed in these slides are Talent Satisfaction, Talent Management, Talent Rating. This is an immediately available PowerPoint presentation that can be conveniently customized. Download it and convince your audience.
-
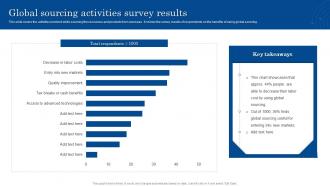 Global Sourcing Activities Survey Results
This slide covers the activities involved while sourcing the resources and products from overseas. It shows the survey results of respondents on the benefits of using global sourcing. Introducing our Global Sourcing Activities Survey Results set of slides. The topics discussed in these slides are Global, Sourcing Activities, Survey Results. This is an immediately available PowerPoint presentation that can be conveniently customized. Download it and convince your audience.


