Client centric financial planning process powerpoint presentation slides
Failing to design a client centric financial planning process PowerPoint presentation due to lack of skill or time? No problem! Whatever may be the reason we have solution in form of completely pre designed financial planning process slide presentation. To help you further here we are sharing few tips to use this PPT model. Now, using this visual communication you can lay emphasis on your short term as well as long term financial goals. In addition, our PowerPoint presentation slide supports to brief employees about the objective and advantages of financial planning. Further, with help of our PPT sample you can also train your employees to adopt a customer centric delivery model having balanced financial approach to meet the goals. Not just these, exclusive presentation templates like cash flow analysis, financial growth analysis, new capital budgeting, risk tolerance analysis, risk reward matrix etc. are few other highlights of this visual show. In short, our presentation deck has everything to take your process of financial planning to the next level. So, start building your next show. Institute incentives for creditable effort with our Client Centric Financial Planning Process PowerPoint presentation slide. Heighten interest in doing a good job.
- Google Slides is a new FREE Presentation software from Google.
- All our content is 100% compatible with Google Slides.
- Just download our designs, and upload them to Google Slides and they will work automatically.
- Amaze your audience with SlideTeam and Google Slides.
-
Want Changes to This PPT Slide? Check out our Presentation Design Services
- WideScreen Aspect ratio is becoming a very popular format. When you download this product, the downloaded ZIP will contain this product in both standard and widescreen format.
-

- Some older products that we have may only be in standard format, but they can easily be converted to widescreen.
- To do this, please open the SlideTeam product in Powerpoint, and go to
- Design ( On the top bar) -> Page Setup -> and select "On-screen Show (16:9)” in the drop down for "Slides Sized for".
- The slide or theme will change to widescreen, and all graphics will adjust automatically. You can similarly convert our content to any other desired screen aspect ratio.
Compatible With Google Slides

Get This In WideScreen
You must be logged in to download this presentation.
PowerPoint presentation slides
Complete package of 54 PPT designs.Designed to support financial planners, financial advisors, customer relation managers, sales managers. Rich with vibrant graphics, images and tables. High resolution template themes. Customize background, font, color, or layout as per your choice. Insertion option for animation, videos, logo, name and trademark. Downloading triggers with a click. Converts readily into PDF, JPG and Google slides. The stages in this process are financial pyramid, tax planning, risk tolerance analysis, budget financial plan new capital budgeting, budget monitoring process.
People who downloaded this PowerPoint presentation also viewed the following :
Content of this Powerpoint Presentation
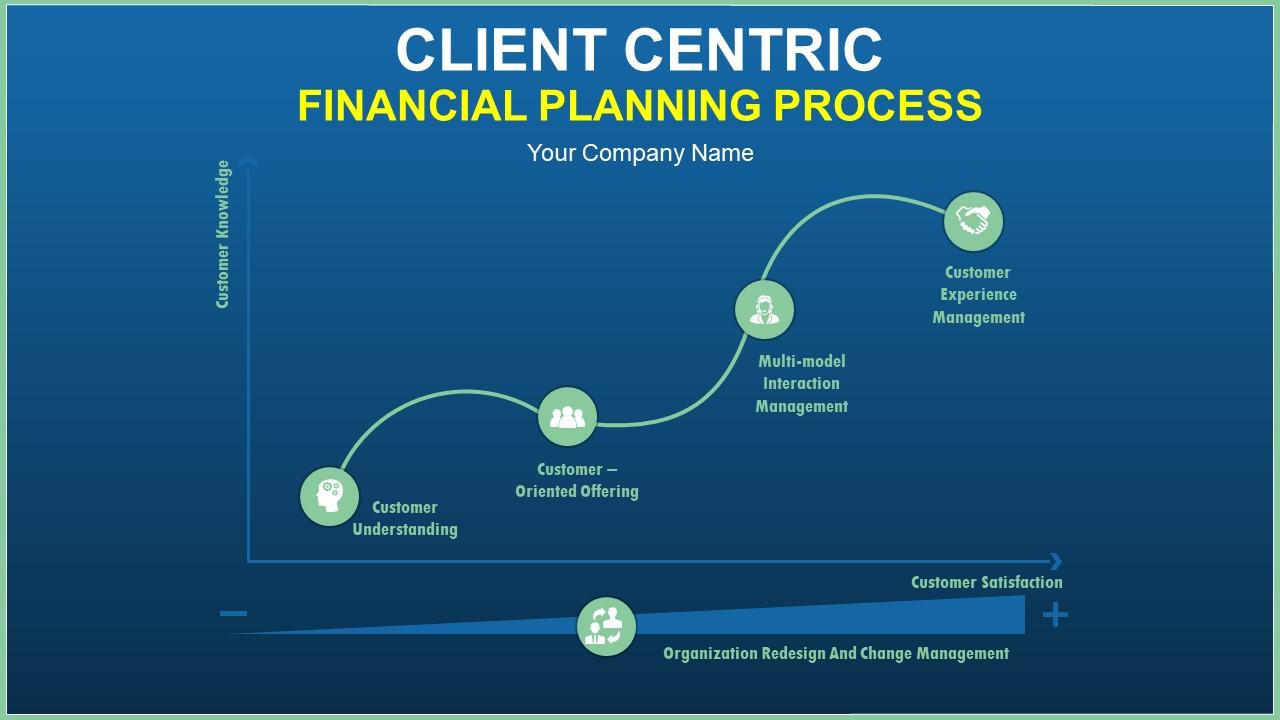
Slide 1: This slide introduces Client Centric Financial Planning Process with imagery.
Slide 2: This is an Agenda slide. State your agendas here.
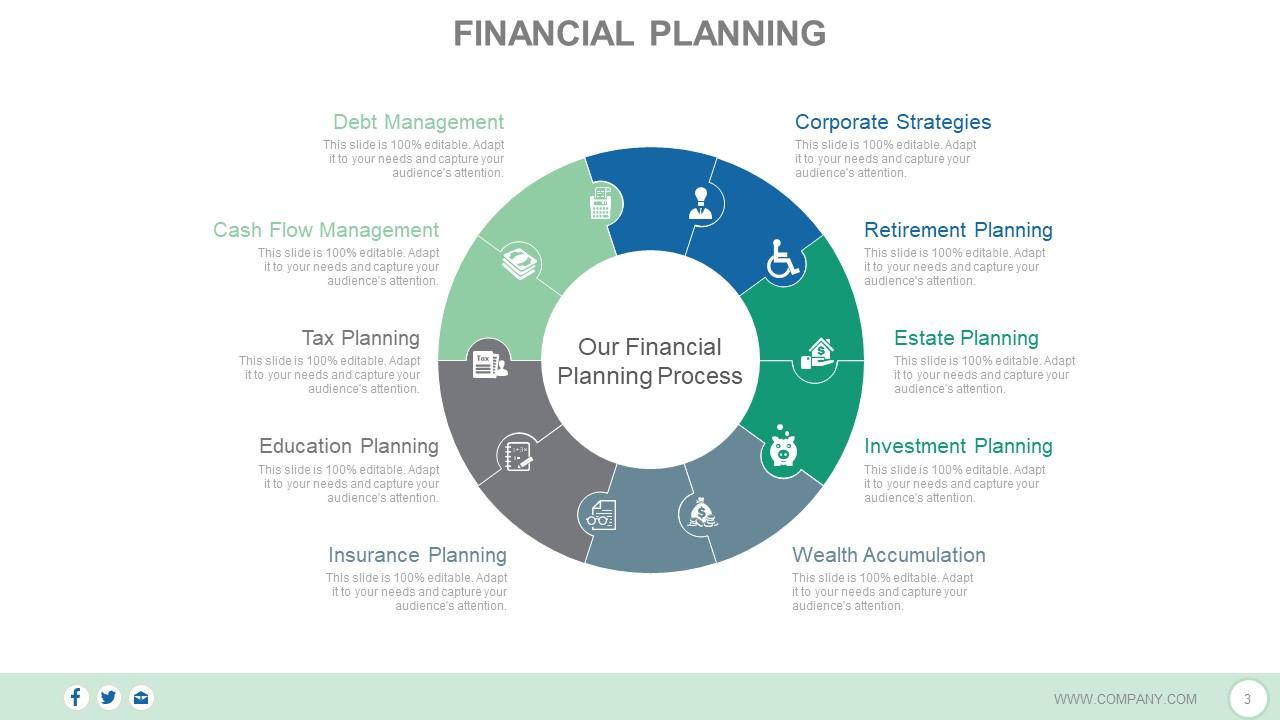
Slide 3: This slide shows Financial Planning process with the following components- Retirement Planning, Estate Planning, Investment Planning, Wealth Accumulation, Insurance Planning, Education Planning, Tax Planning, Cash Flow Management, Corporate Strategies, Debt Management.
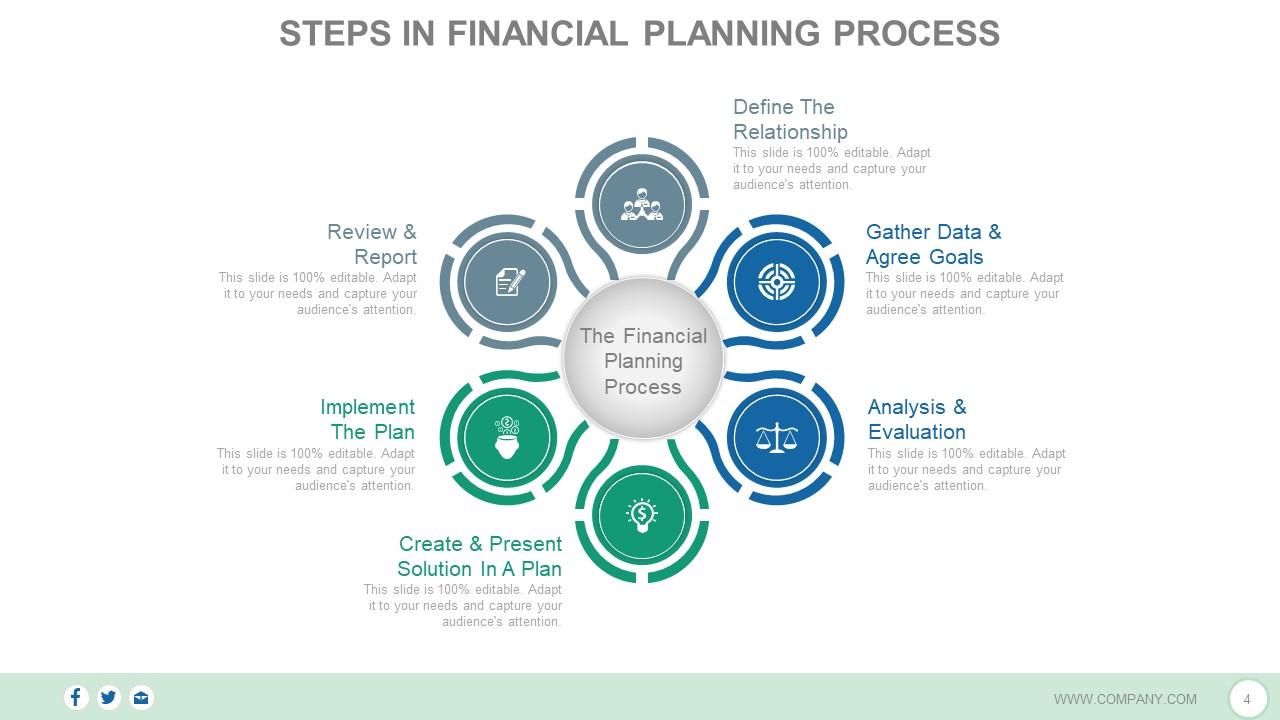
Slide 4: This slide shows Steps In Financial Planning Process. Some of these are- Define The Relationship, Gather Data & Agree Goals, Analysis & Evaluation, Create & Present Solution In A Plan, Implement The Plan, Review & Report.
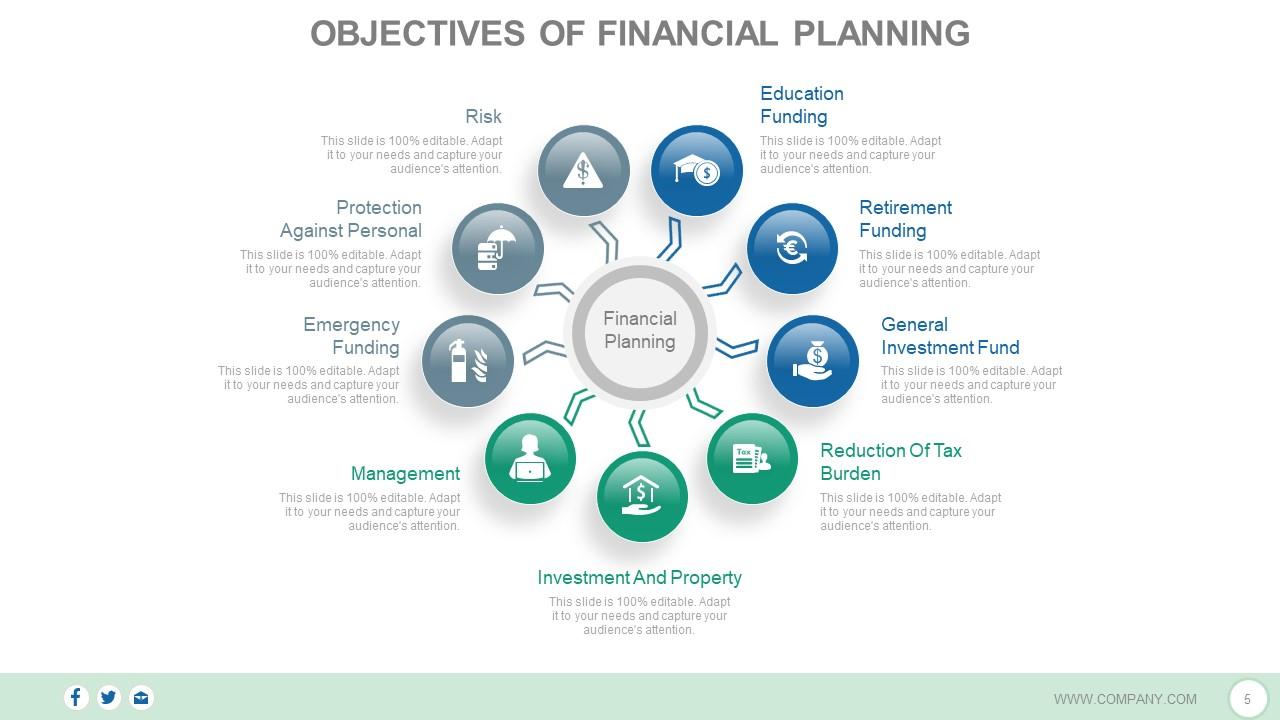
Slide 5: This slide shows Objectives Of Financial Planning such as- Education Funding, Investment And Property, Reduction Of Tax Burden, Management, General Investment Fund, Emergency Funding, Retirement Funding, Protection Against Personal, Risk.
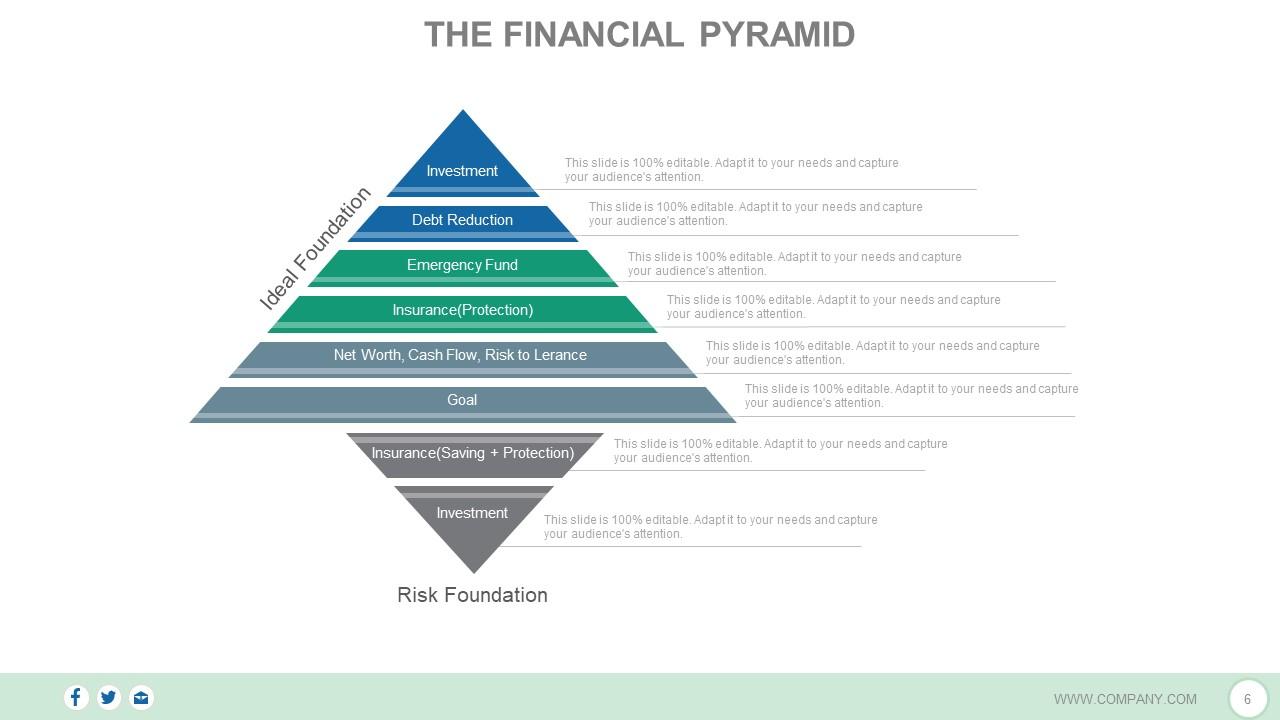
Slide 6: This slide shows The Financial Pyramid with various levels listed as- Investment, Debt Reduction, Emergency Fund, Insurance(Protection), Net Worth, Cash Flow, Risk to Lerance, Goal, Insurance(Saving + Protection).
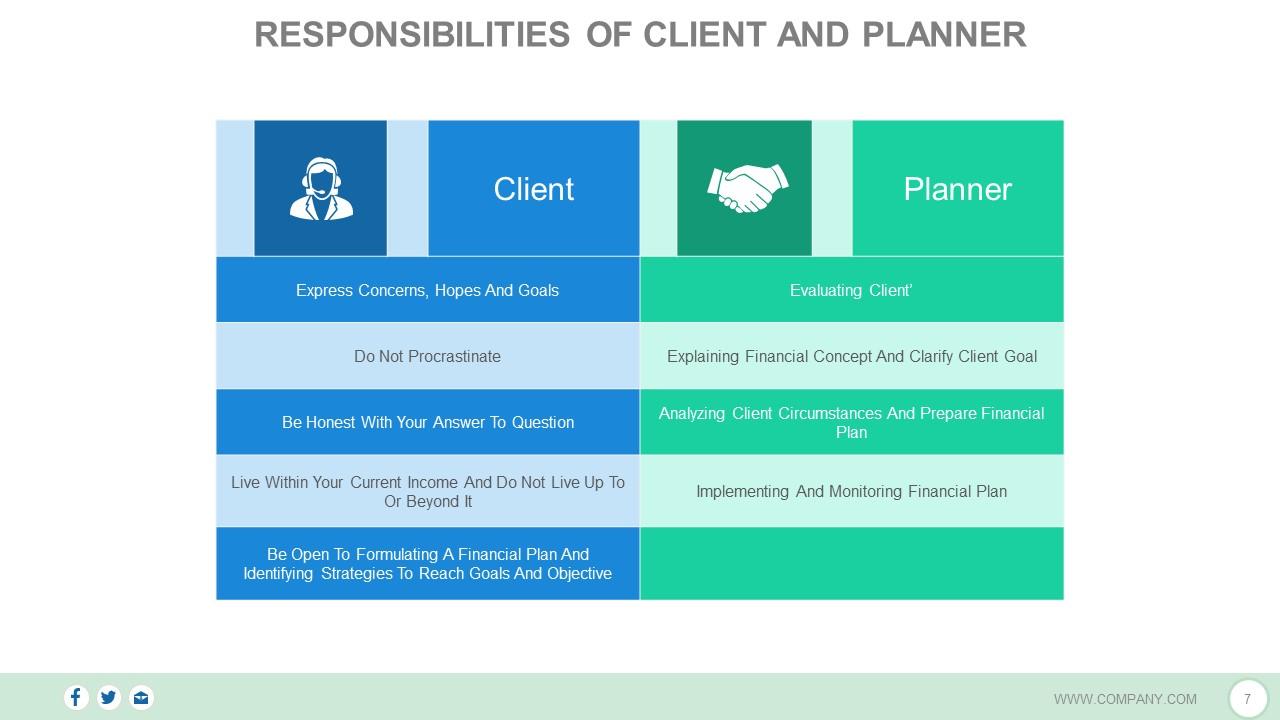
Slide 7: This slide states the Responsibilities Of Client And Planner. Add them here and use it accordingly.
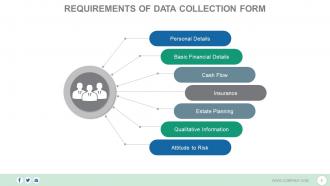
Slide 8: This slide showcases seven Requirements Of Data Collection Form which are- Personal Details, Basic Financial Details, Cash Flow, Insurance, Estate Planning, Qualitative Information, Attitude to Risk.
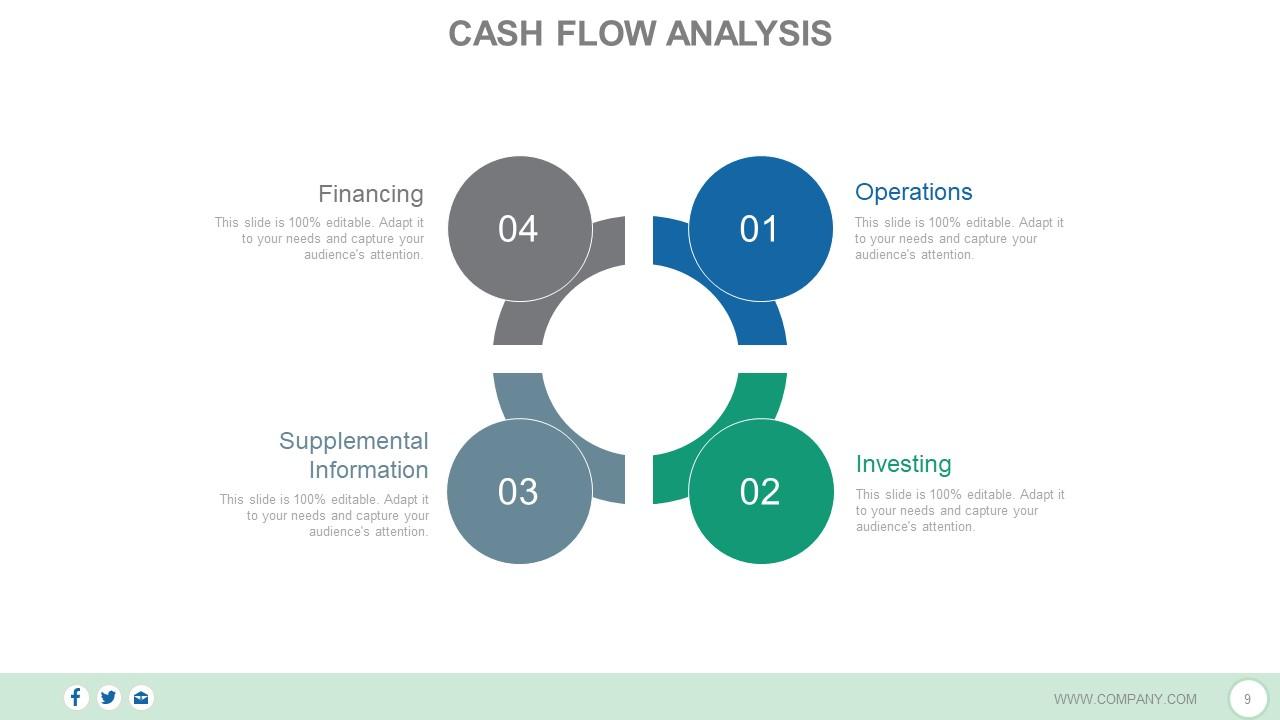
Slide 9: This slide shows 4 components of Cash Flow Analysis- Investing, Supplemental Information, Operations, Financing.
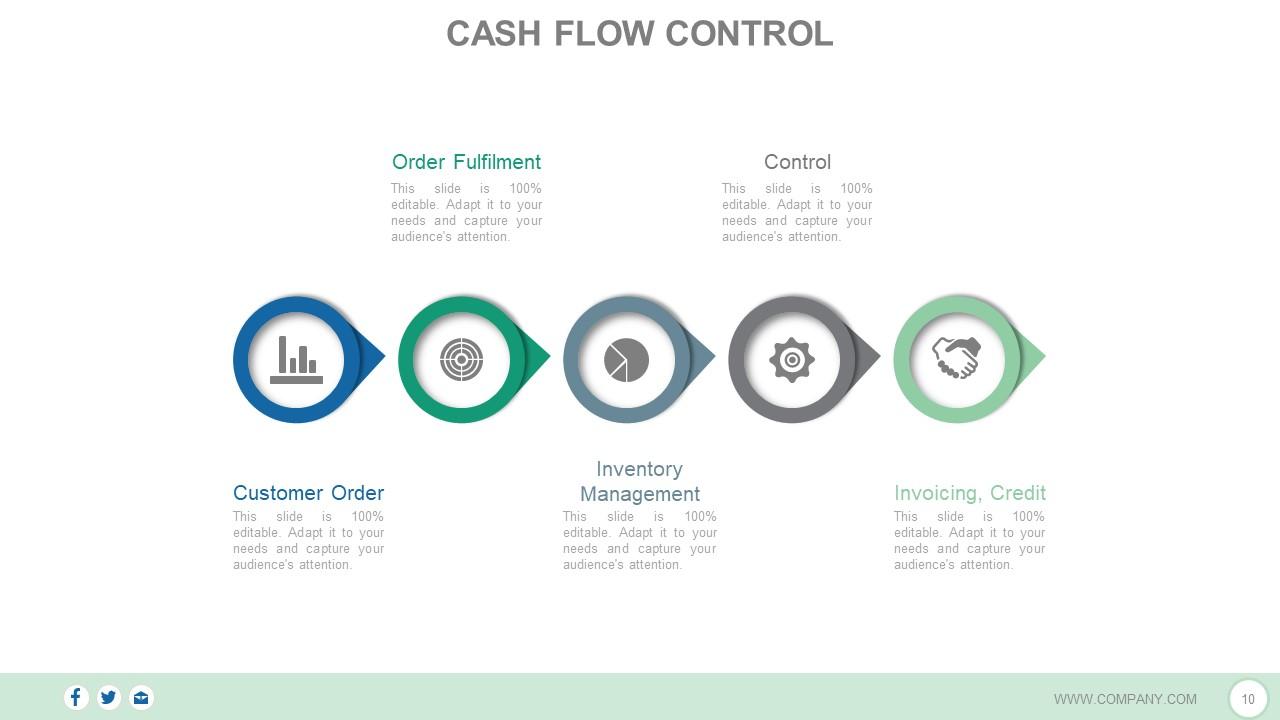
Slide 10: This is Cash Flow Control slide showing- Invoicing, Credit, Inventory Management, Customer Order, Order Fulfilment, Control.
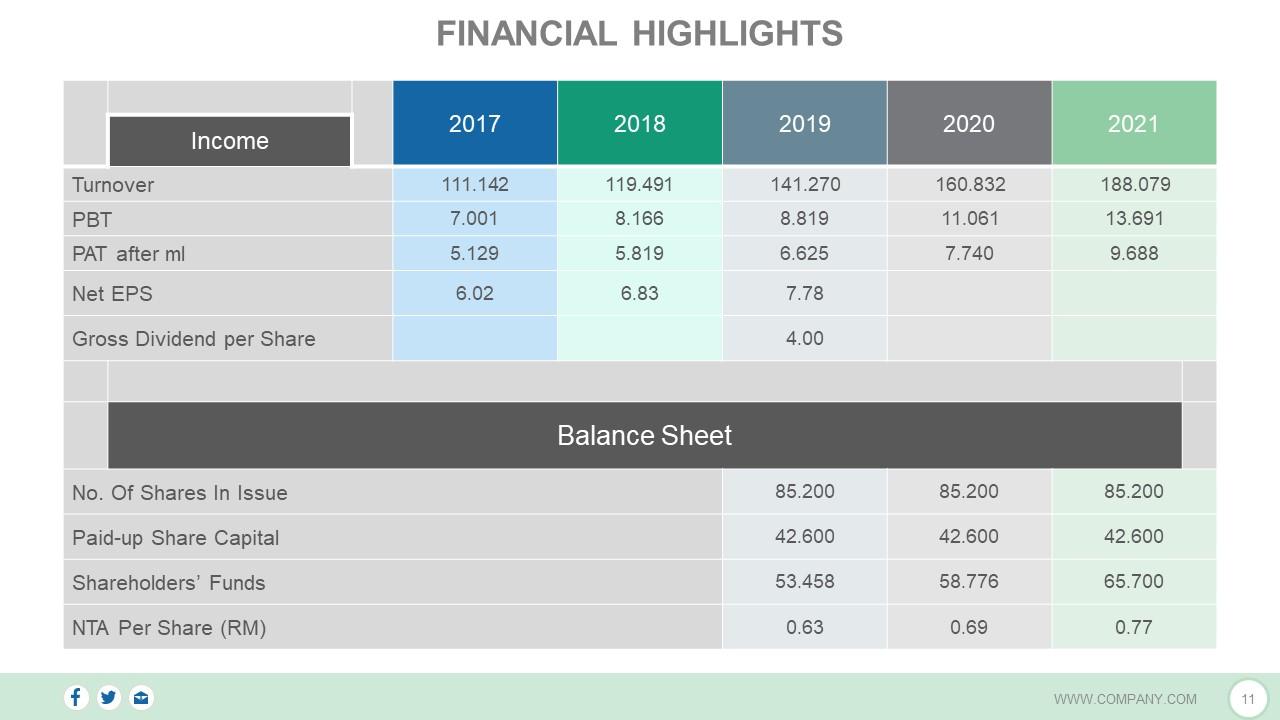
Slide 11: This slide presents Financial Highlights in years.
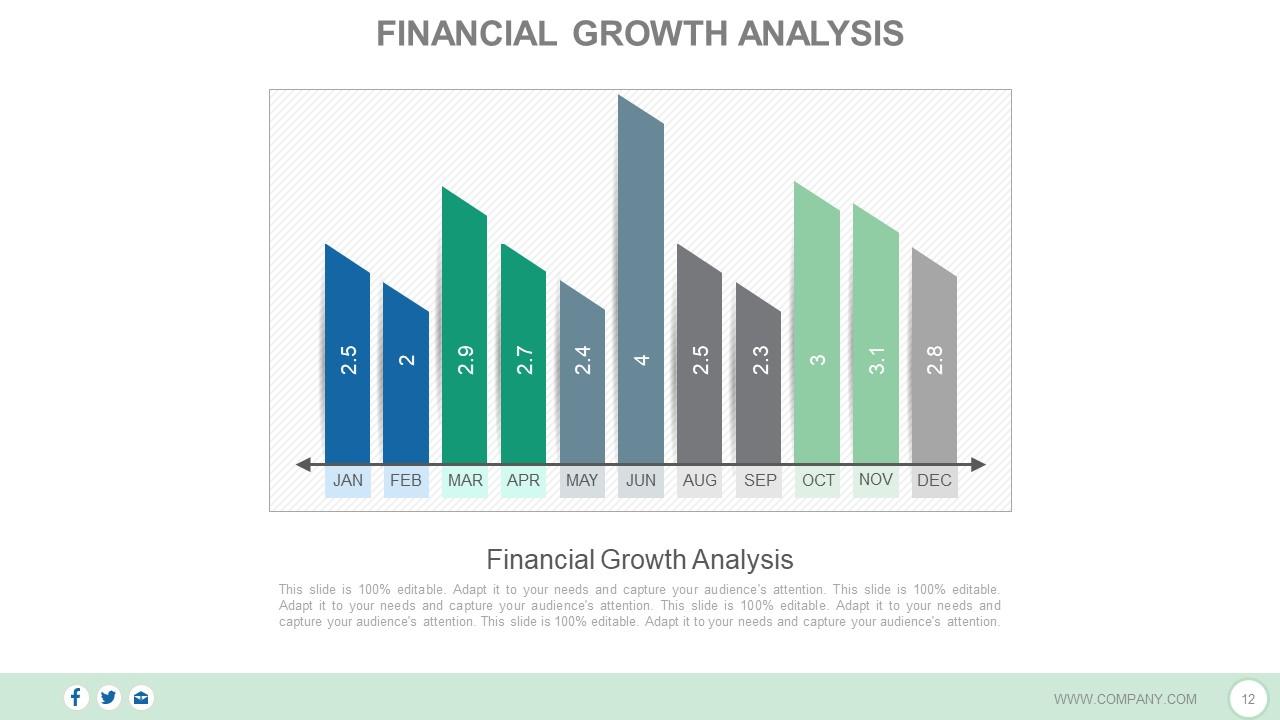
Slide 12: This slide shows a graphical presentation of Financial Growth Analysis.
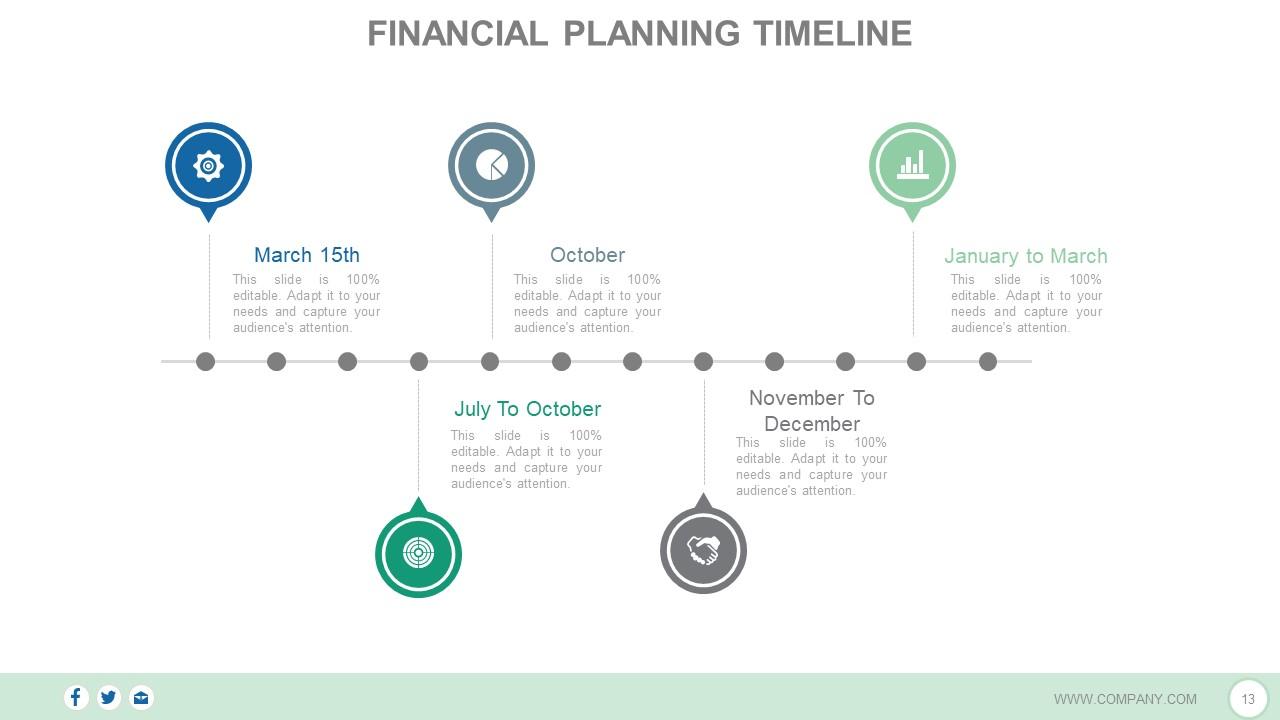
Slide 13: This slide presents Financial Planning Timeline. Add relevant data here as per your need.
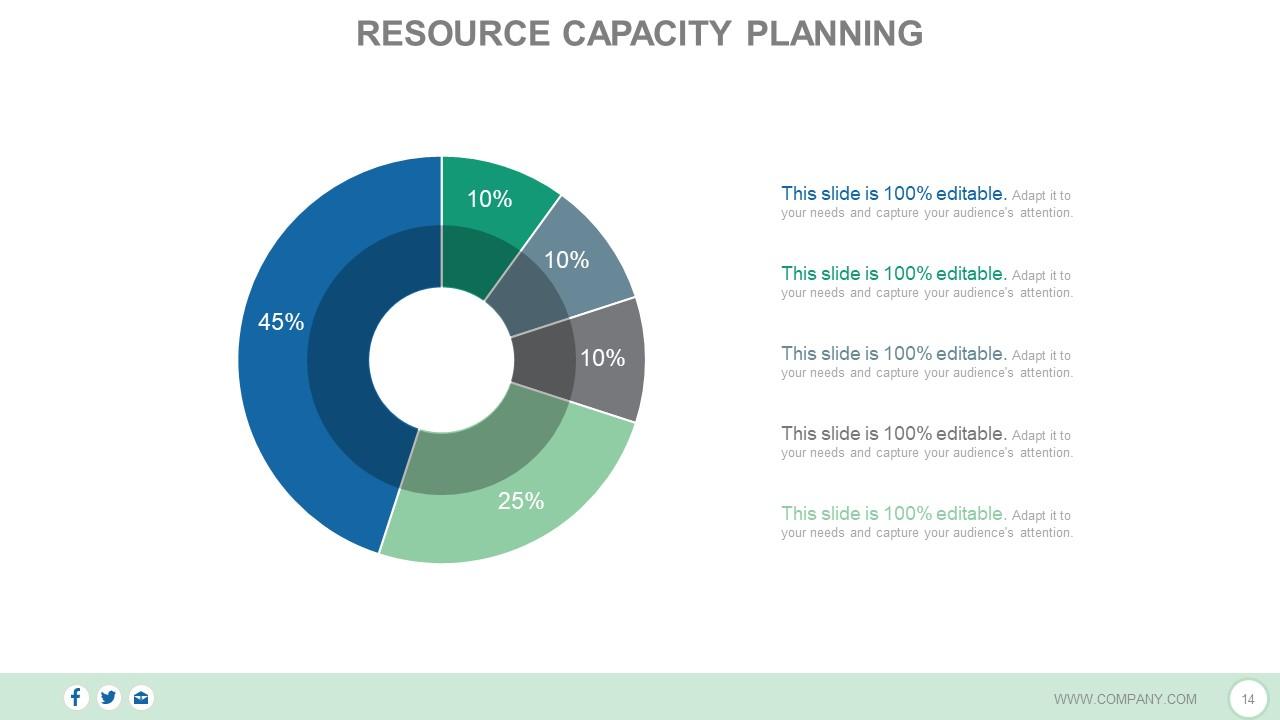
Slide 14: This slide shows Resource Capacity Planning in a pie chart/ graph form with text boxes.
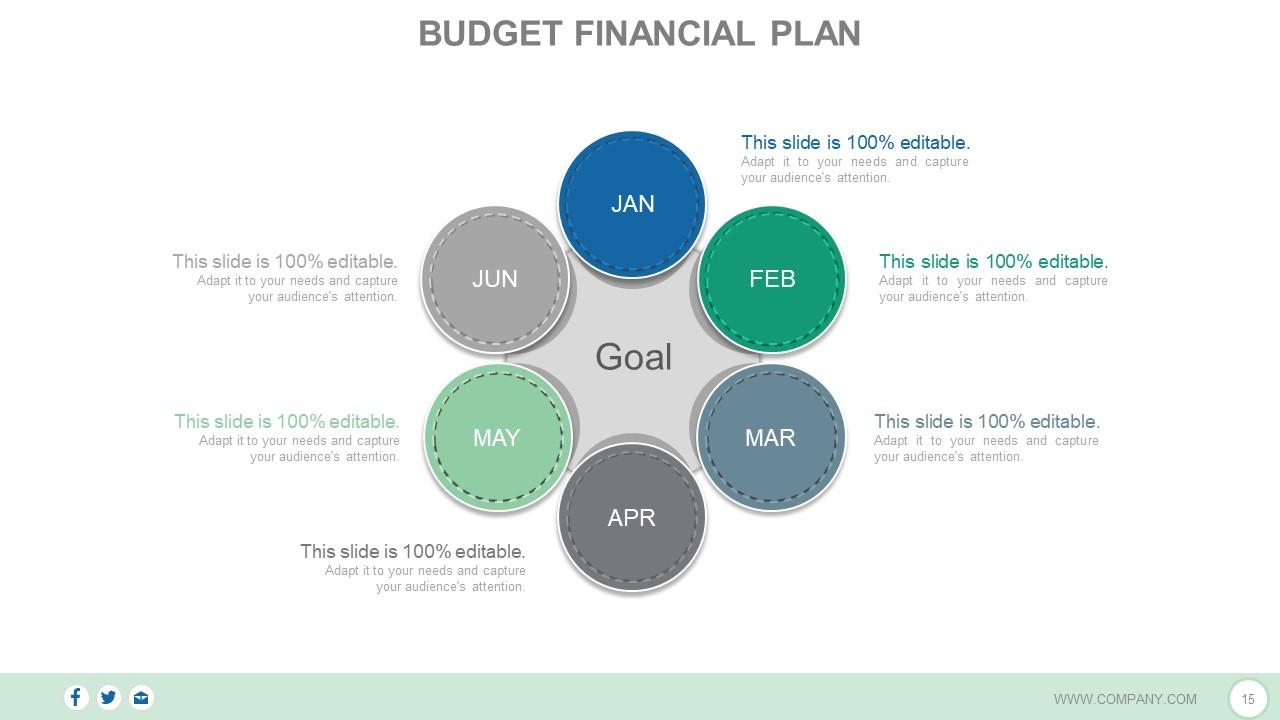
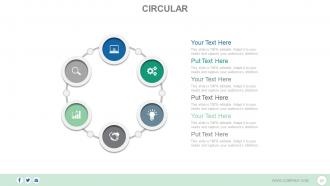
Slide 15: This slide shows Budget Financial Plan in a circular form.
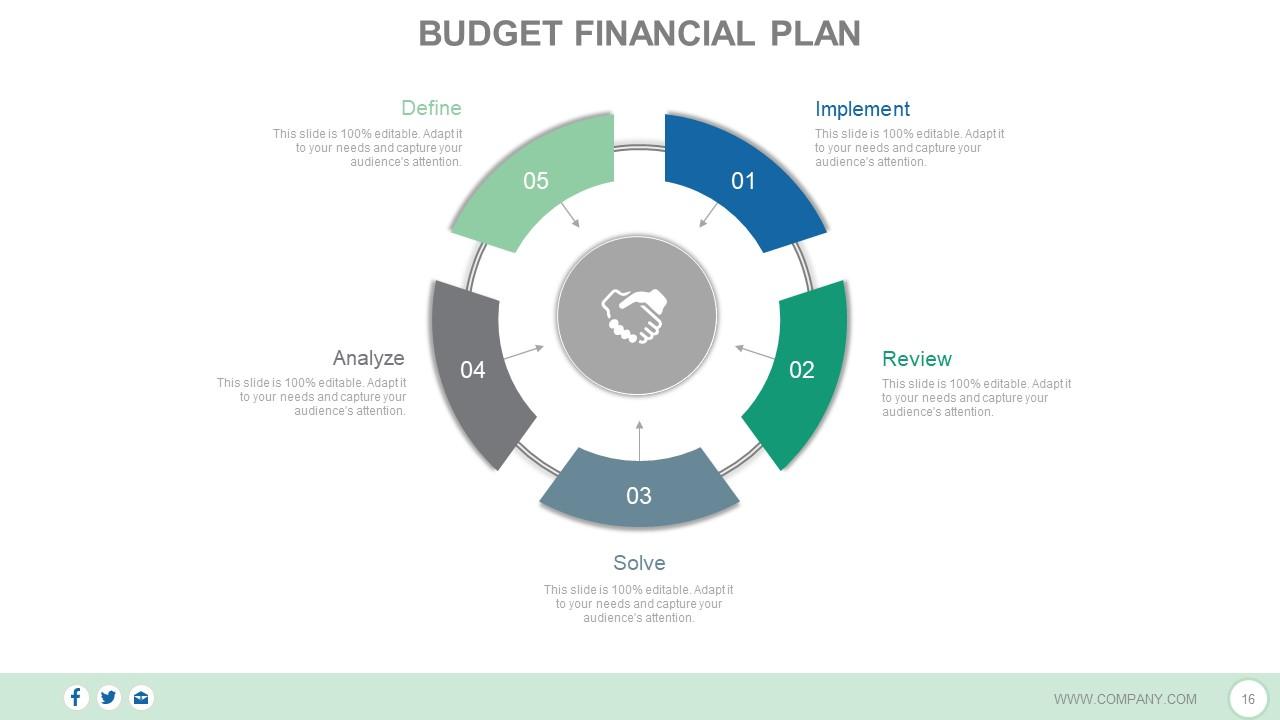
Slide 16: This slide also shows Budget Financial Plan with the following 5 steps- Implement, Review, Solve, Analyze, Define.
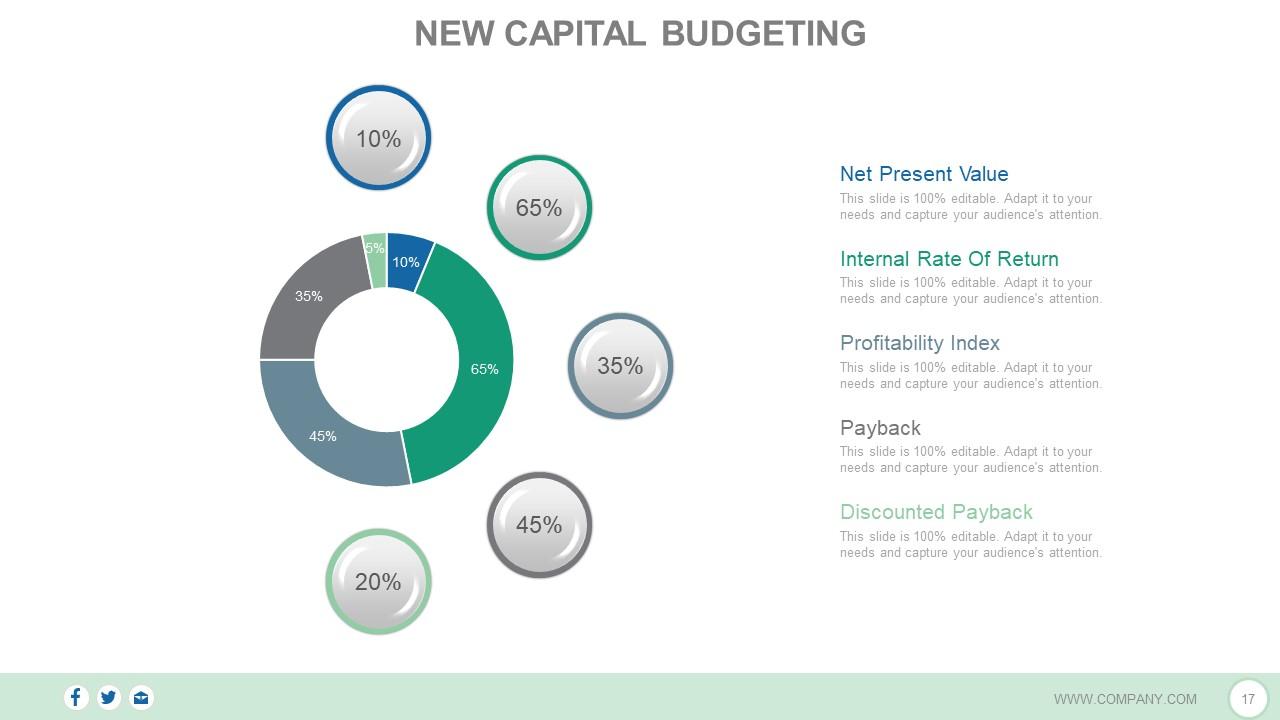
Slide 17: This is New Capital Budgeting slide showing- Net Present Value, Internal Rate Of Return, Profitability Index, Payback, Discounted Payback.
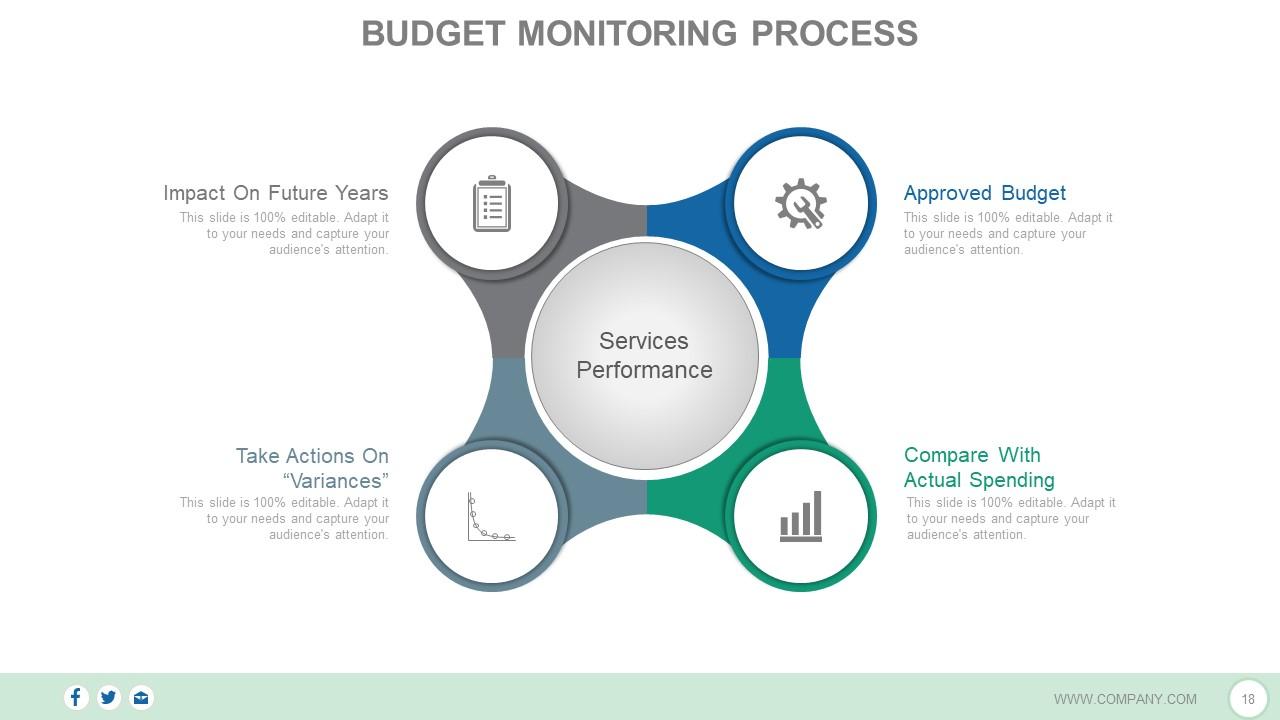
Slide 18: This is Budget Monitoring Process slide showing the following four characteristics of Services Performance- Compare With Actual Spending, Take Actions On “Variances”, Approved Budget, Impact On Future Years.
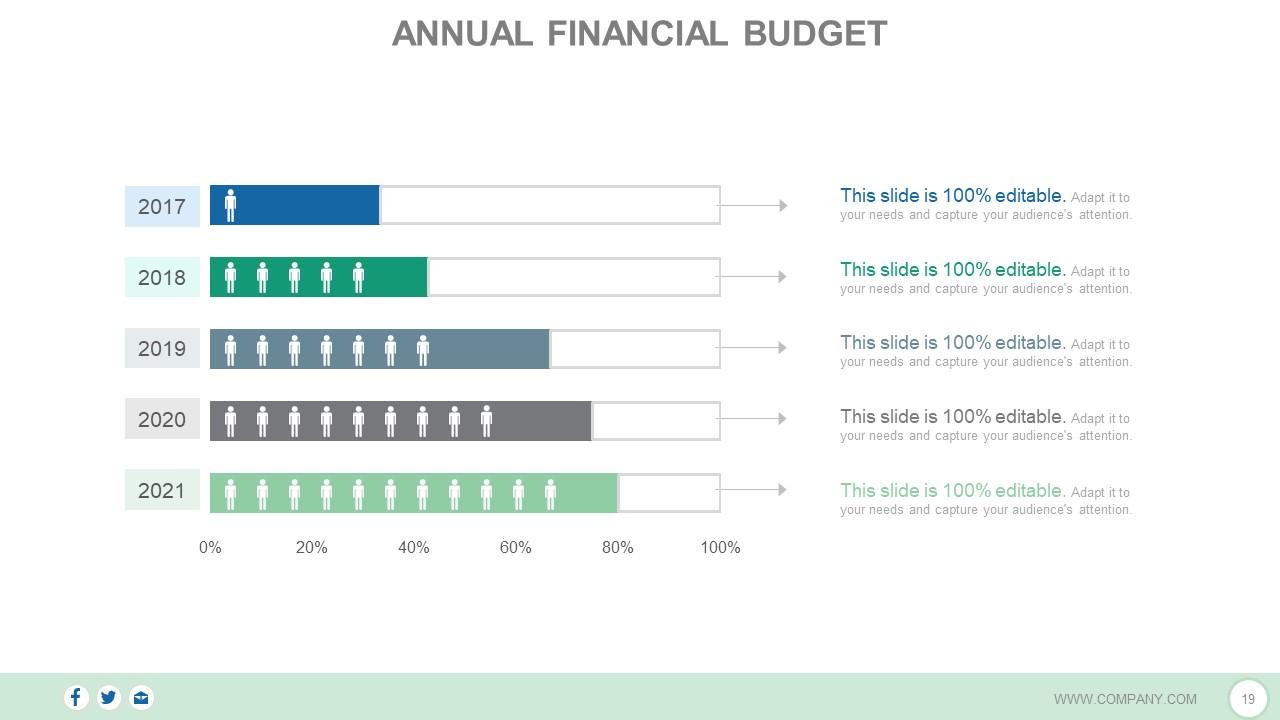
Slide 19: This slide presents Annual Financial Budget graphically.
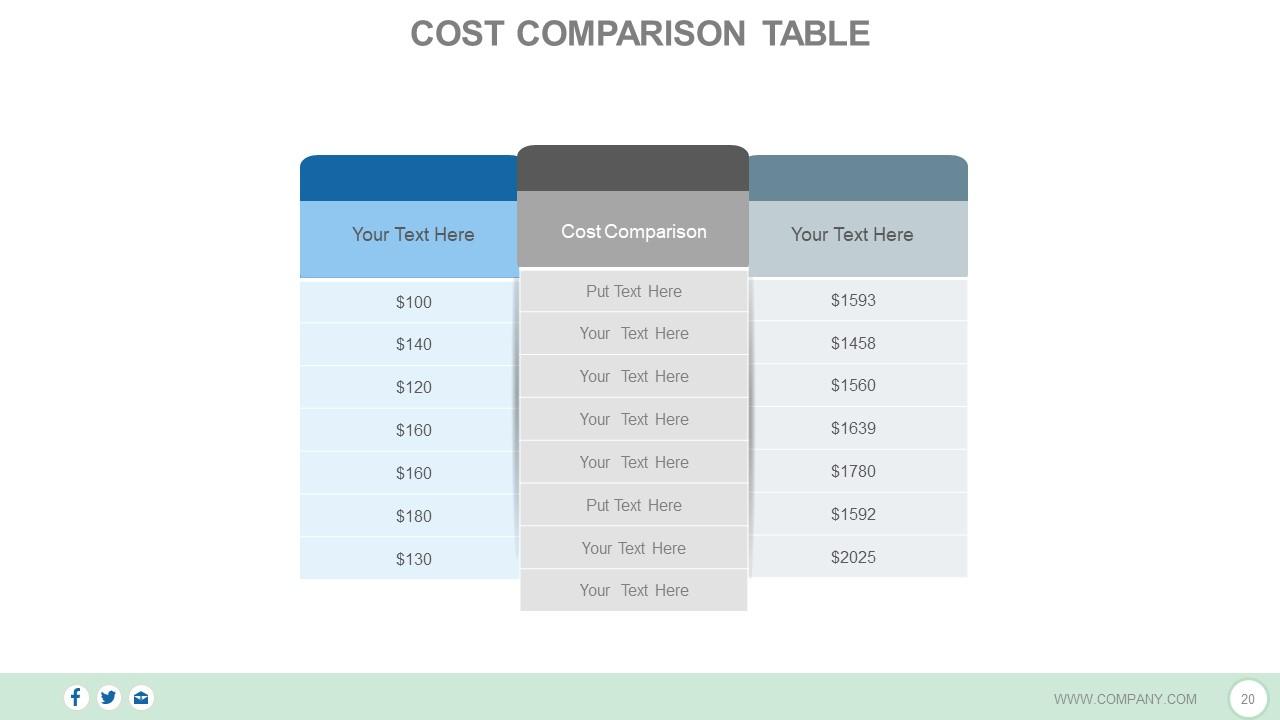
Slide 20: This slide shows Cost Comparison Table. Use this table to compare your own costs.
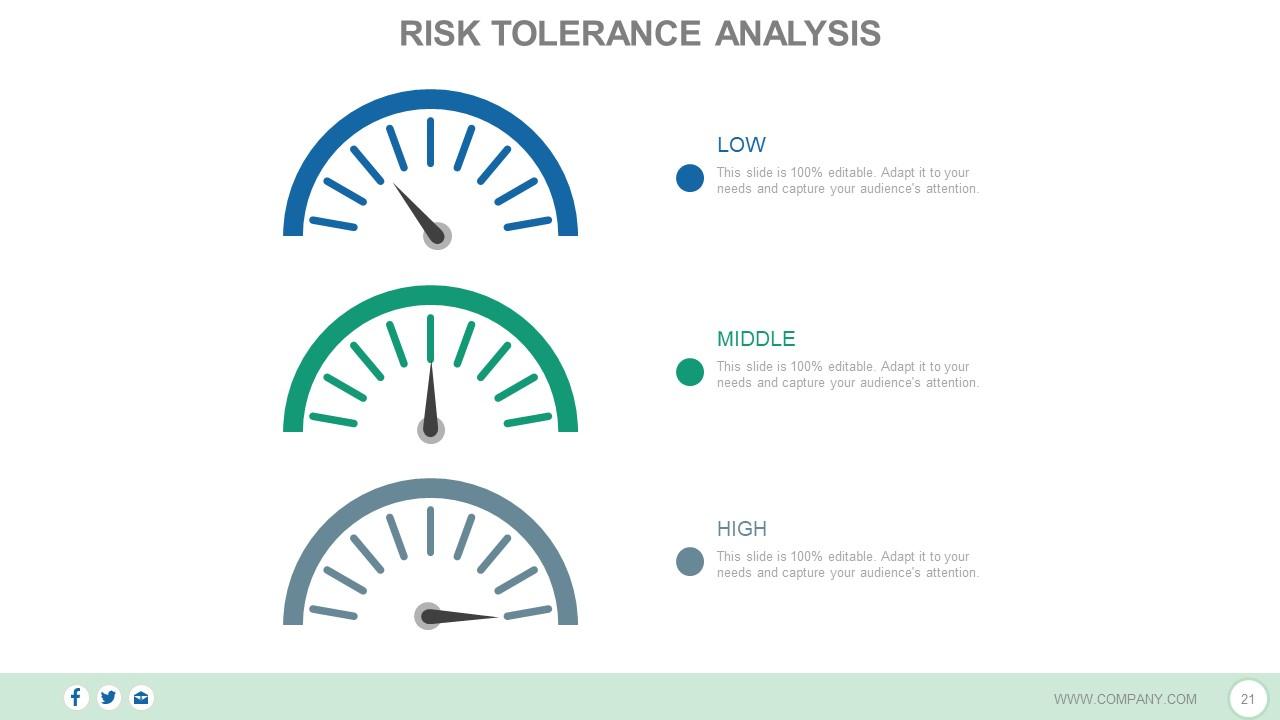
Slide 21: This slide shows Risk Tolerance Analysis slide with metric imagery.
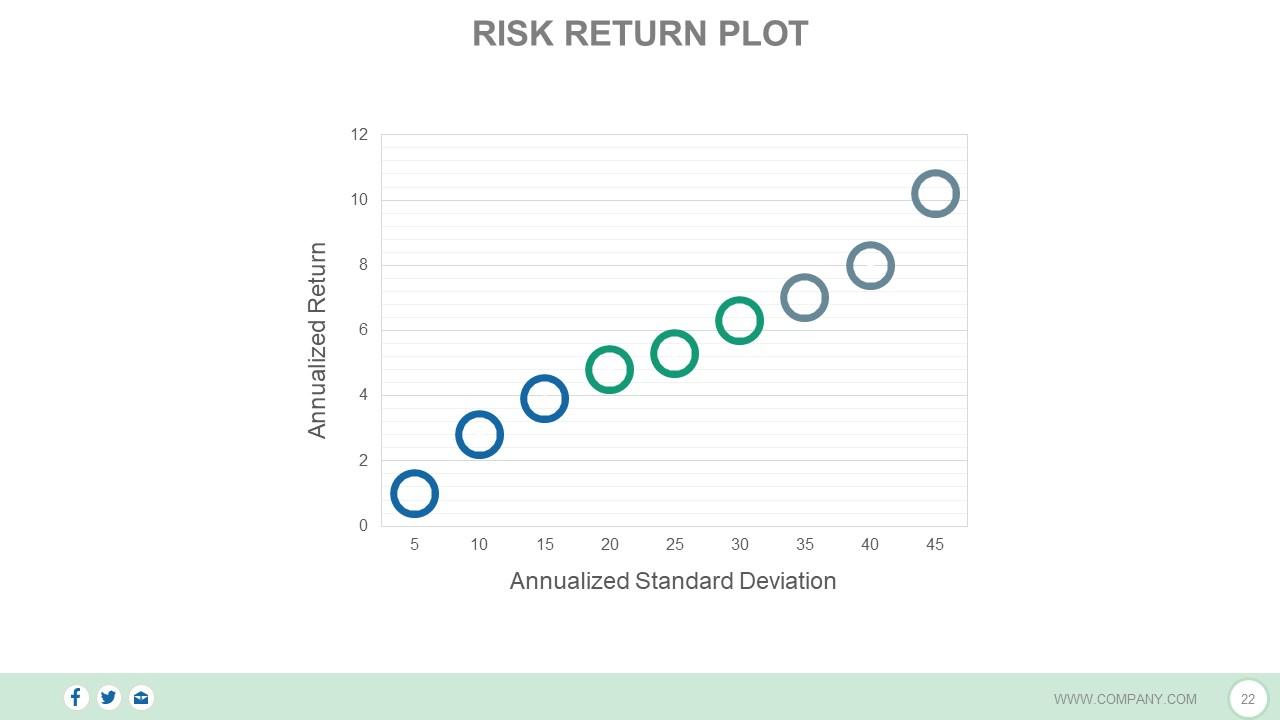
Slide 22: This slide shows Risk Return Plot.
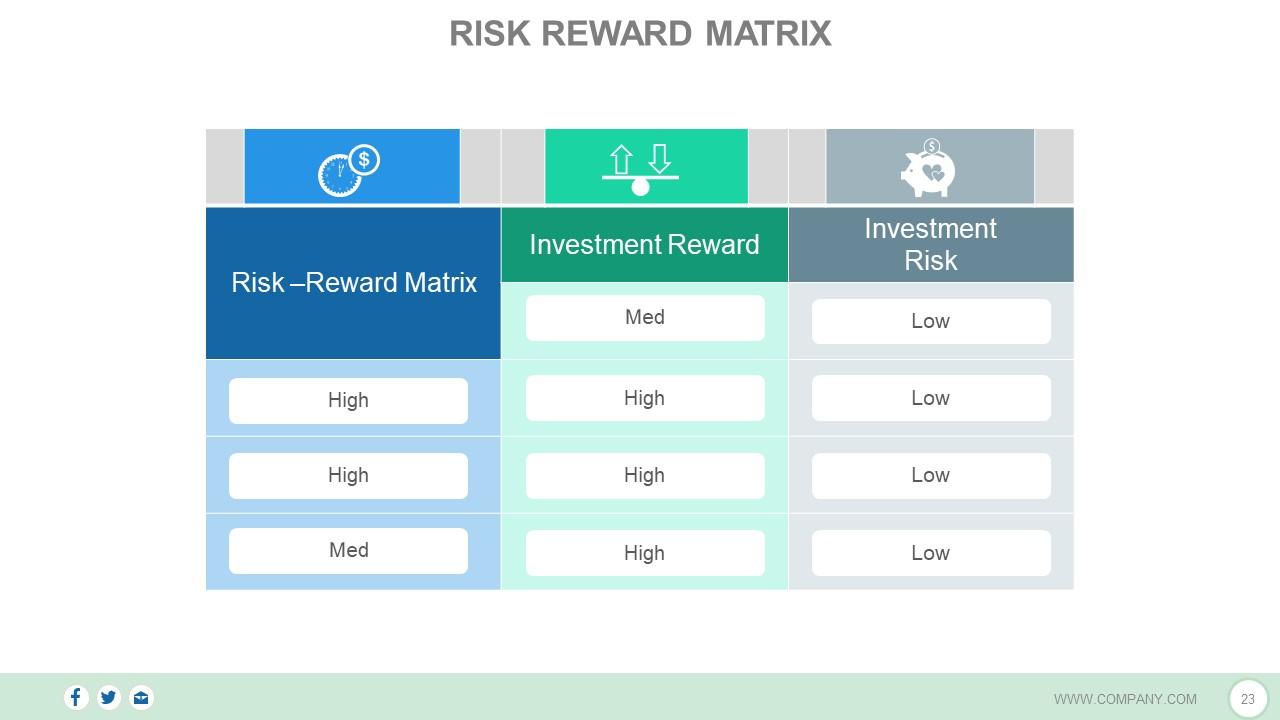
Slide 23: This slide shows RISK REWARD MATRIX with three parameters- High Low Med
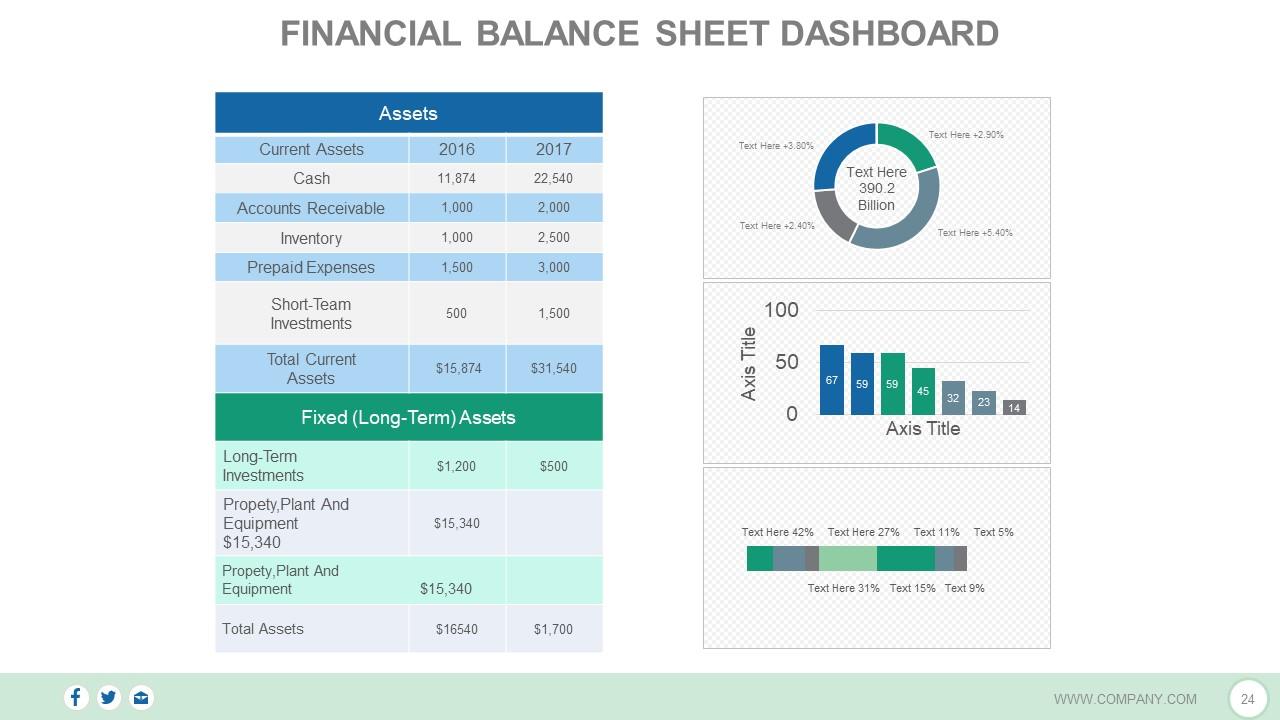
Slide 24: This slide displays Financial Balance Sheet Dashboard in charts and graphs form.
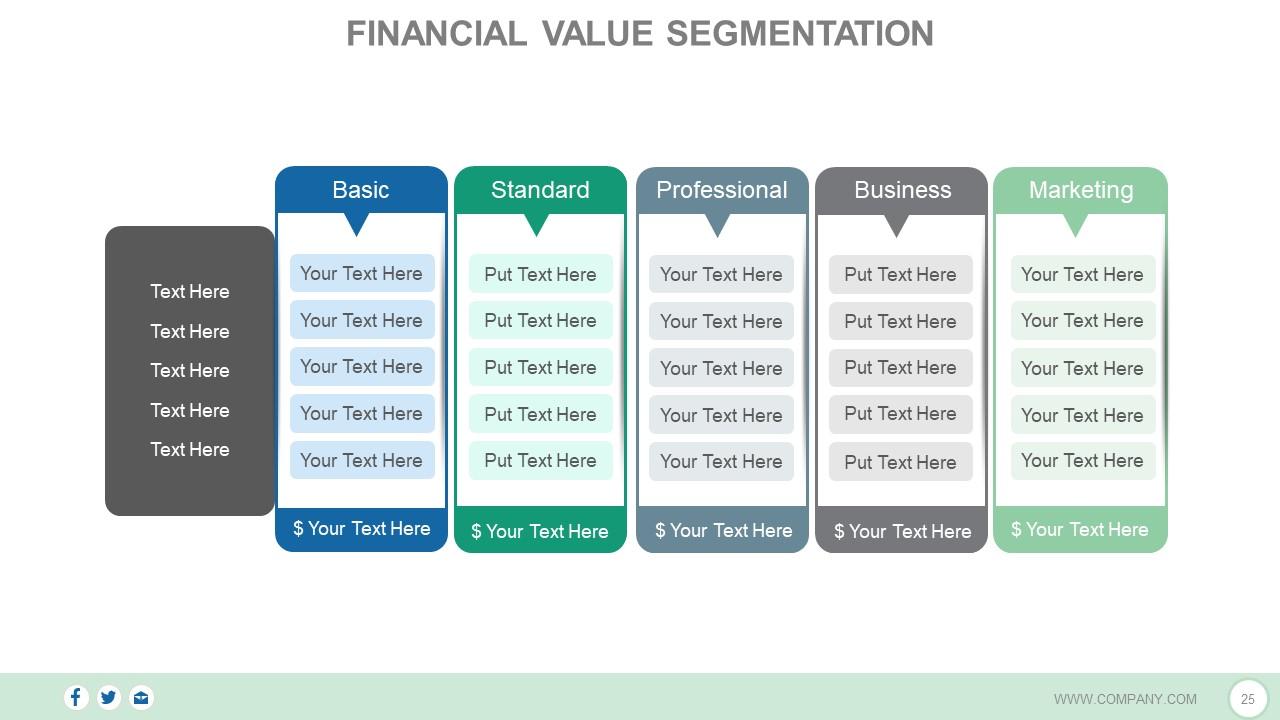
Slide 25: This slide shows Financial Value Segmentation with five major categories listed as- Basic, Standard, Business, Professional, Marketing.
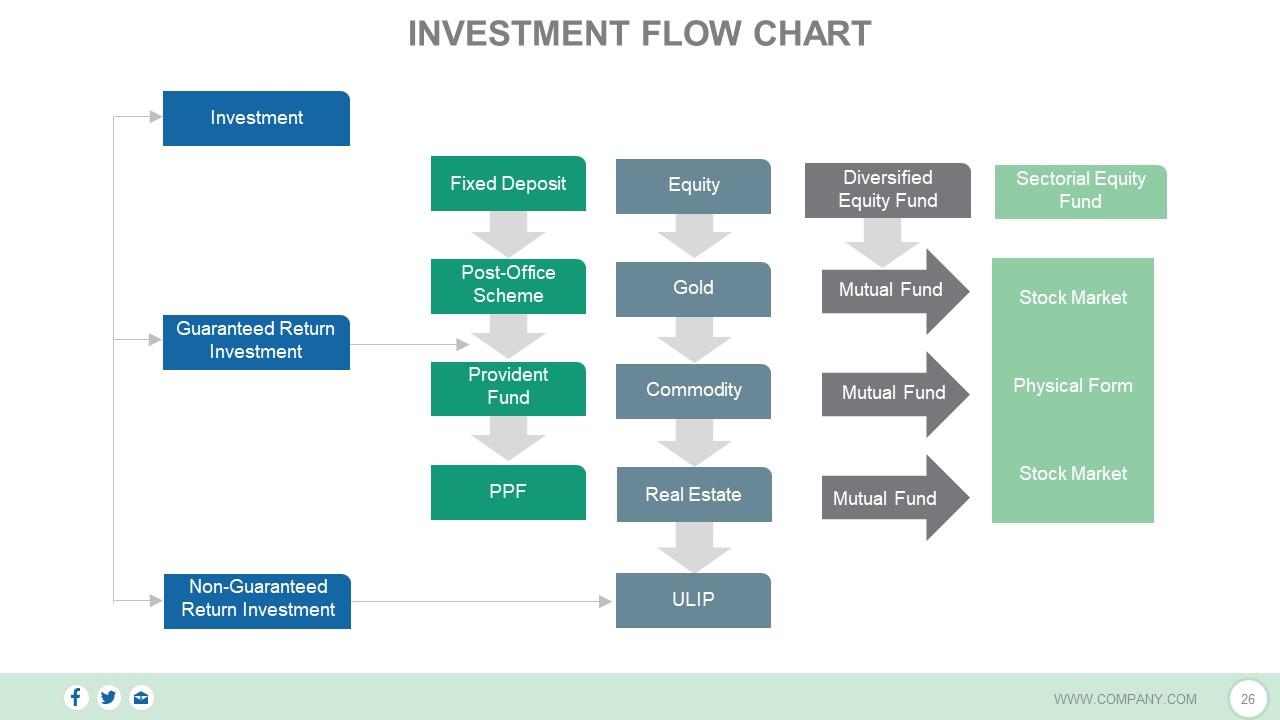
Slide 26: This slide shows Investment Flow Chart further divided into three main categories- Investment, Non-Guaranteed Return Investment, Guaranteed Return Investment.
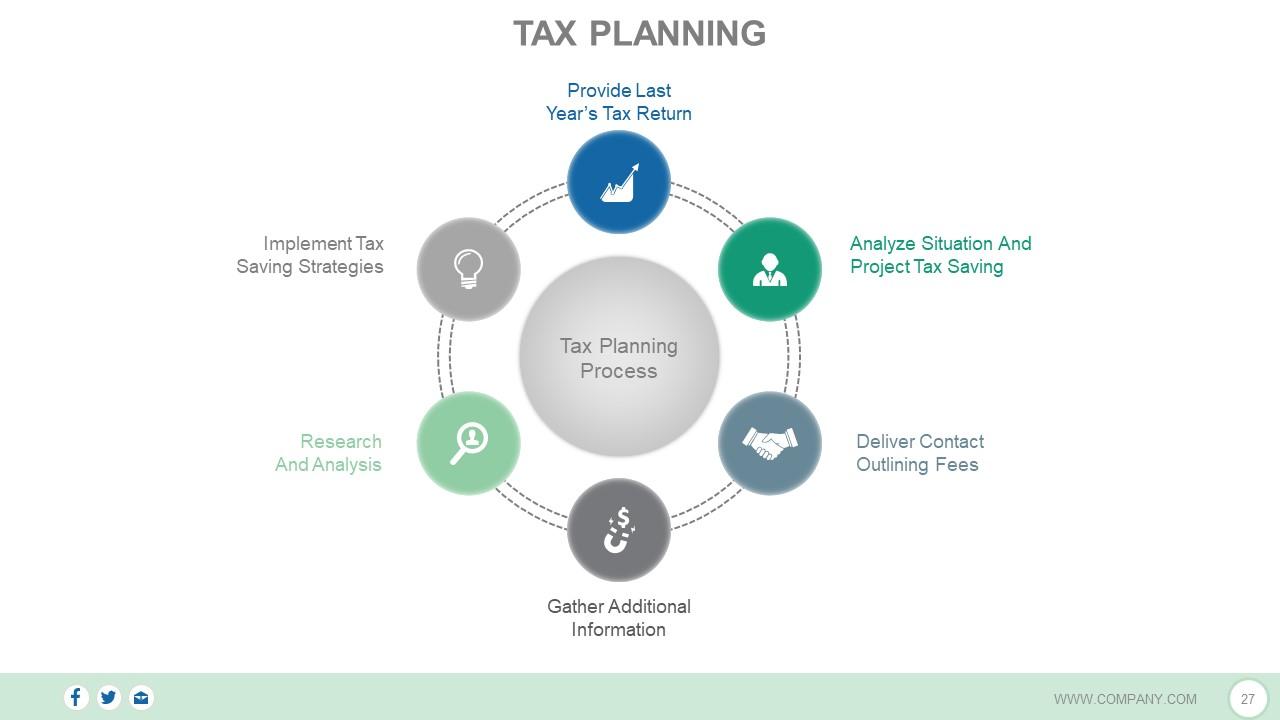
Slide 27: This slide shows Tax Planning with the following steps- Deliver Contact Outlining Fees, Research And Analysis, Analyze Situation And Project Tax Saving, Implement Tax Saving Strategies, Provide Last Year’s Tax Return, Gather Additional Information,
Slide 28: This slide is titled Additional Slides to move forward. You can change the slide content as per need.
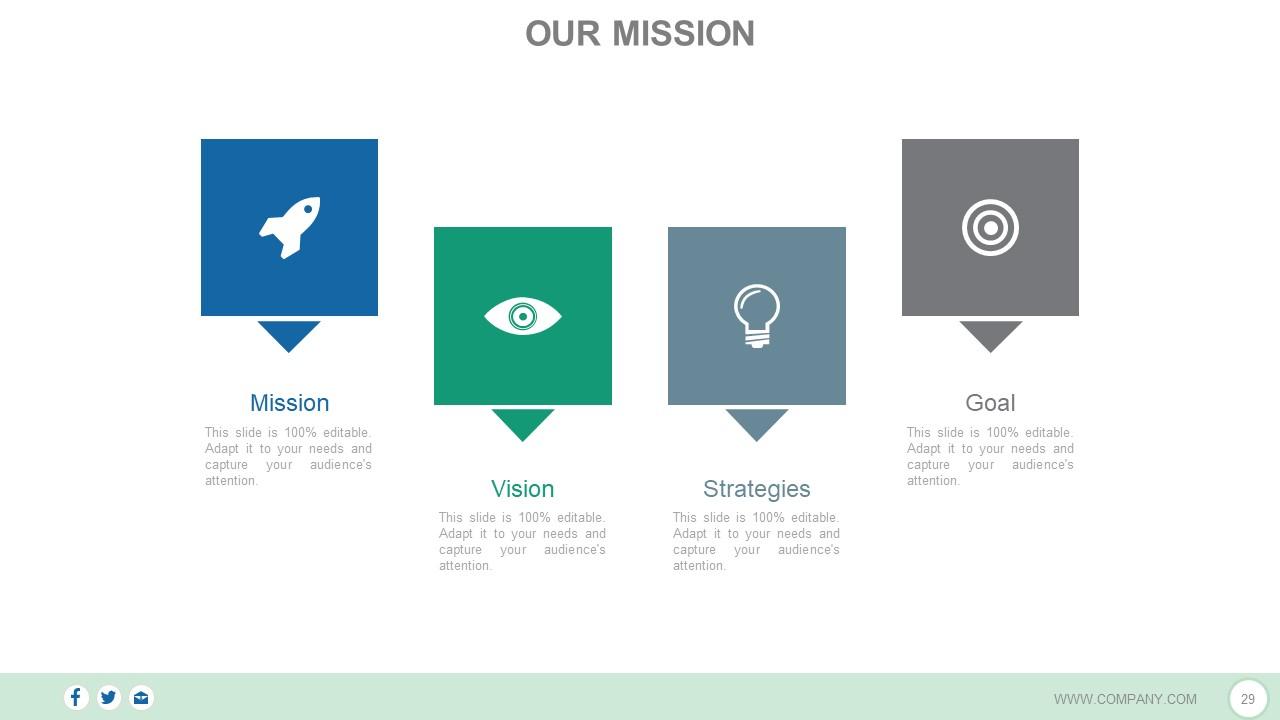
Slide 29: This is OUR MISSION slide. State your Vision, Goal, Strategies, Mission here.
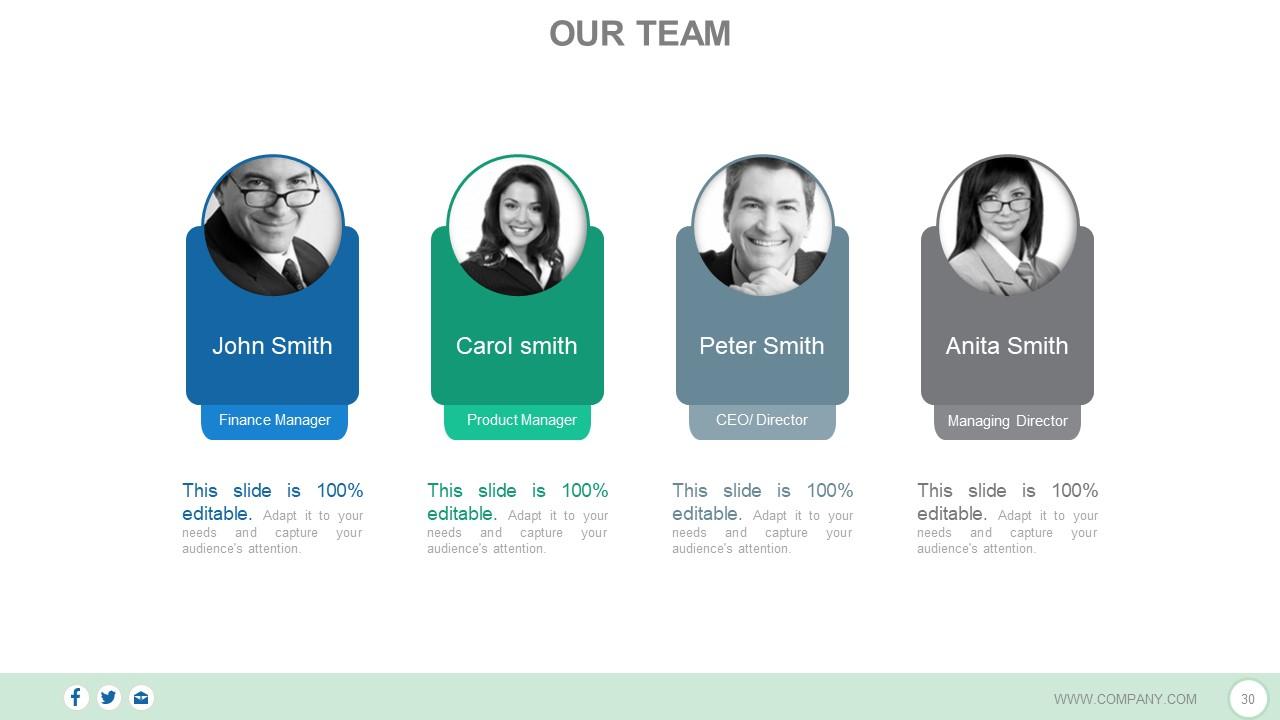
Slide 30: This is an Our Team slide with name, image and text boxes to put the required information.
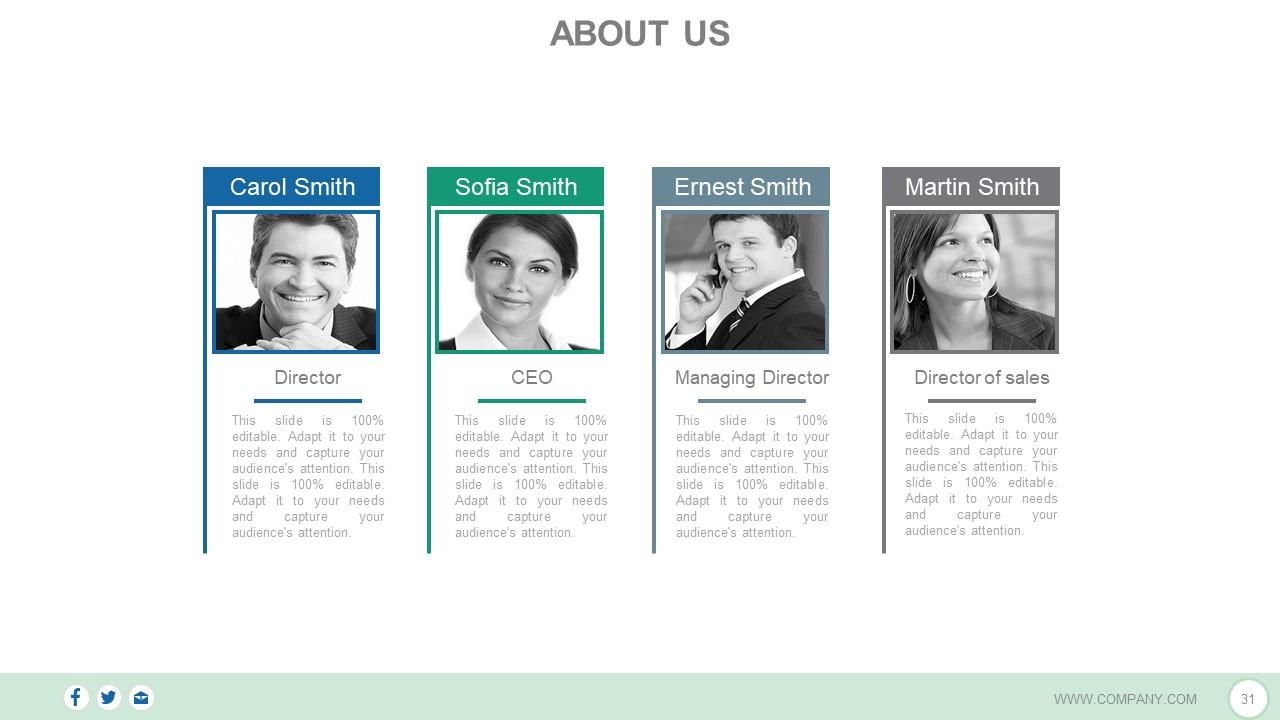
Slide 31: This is an About Us slide. State team/ company specifications here.
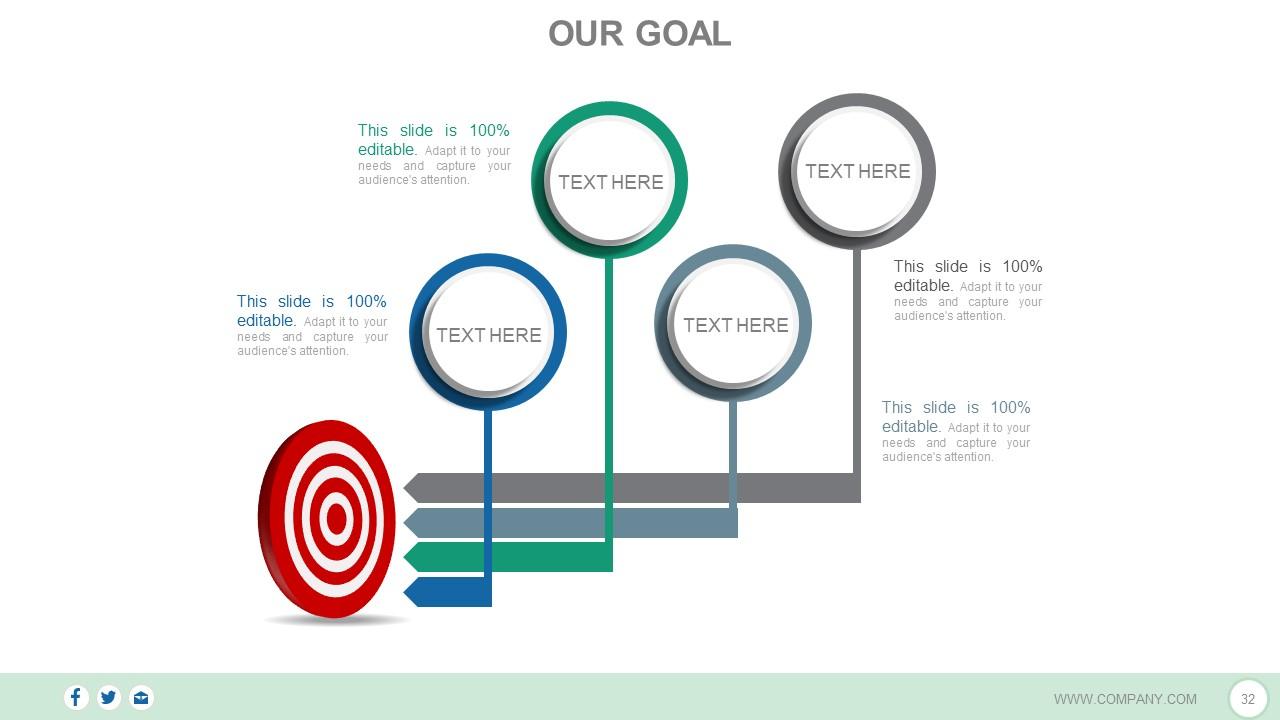
Slide 32: This slide shows OUR GOAL with target and arrow imagery.
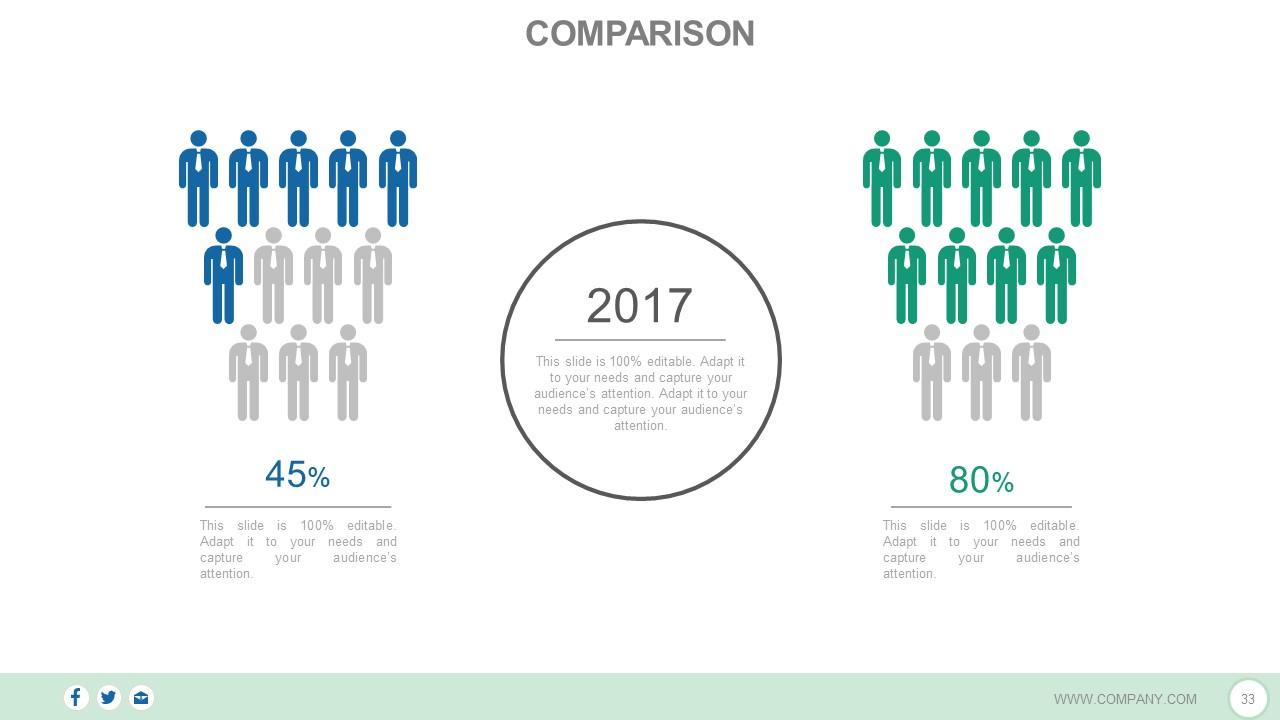
Slide 33: This slide displays Comparison between two entities in percentage.
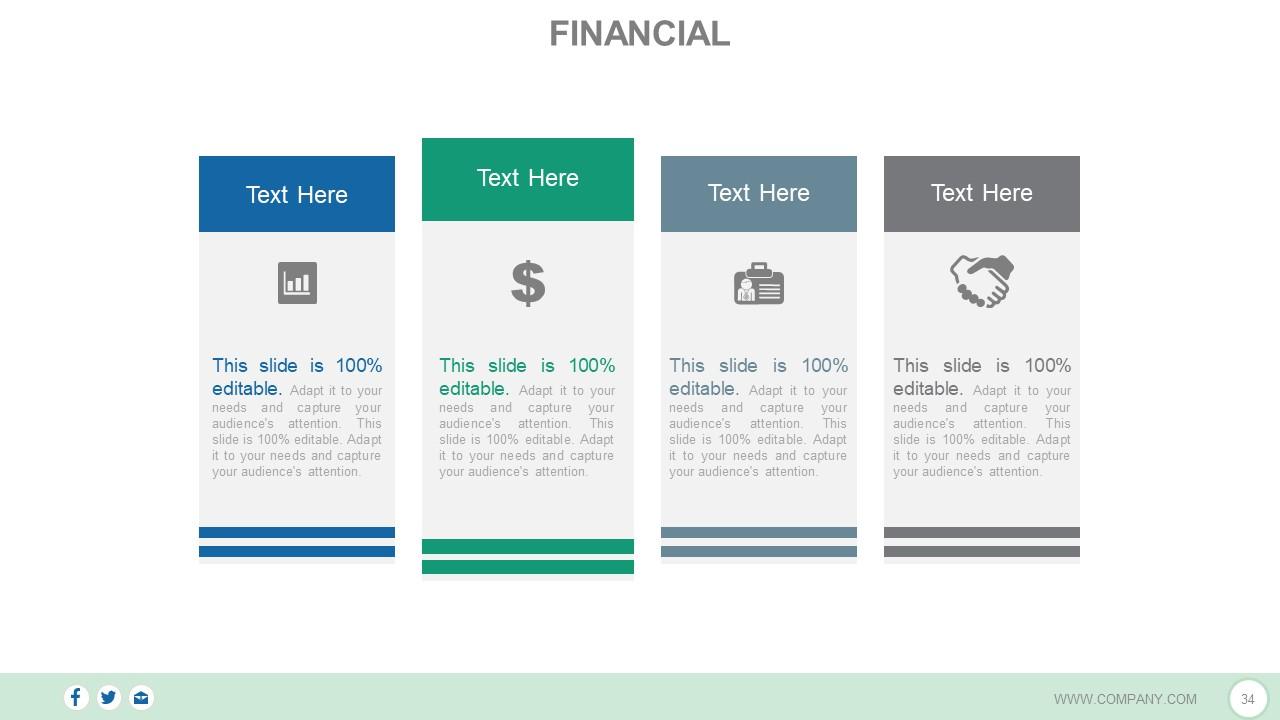
Slide 34: This is a Financial score slide. State financial aspects, information etc. here.
Slide 35: This is a Quotes slide to convey company/ organization message, beliefs etc. You may change the slide content as per need.
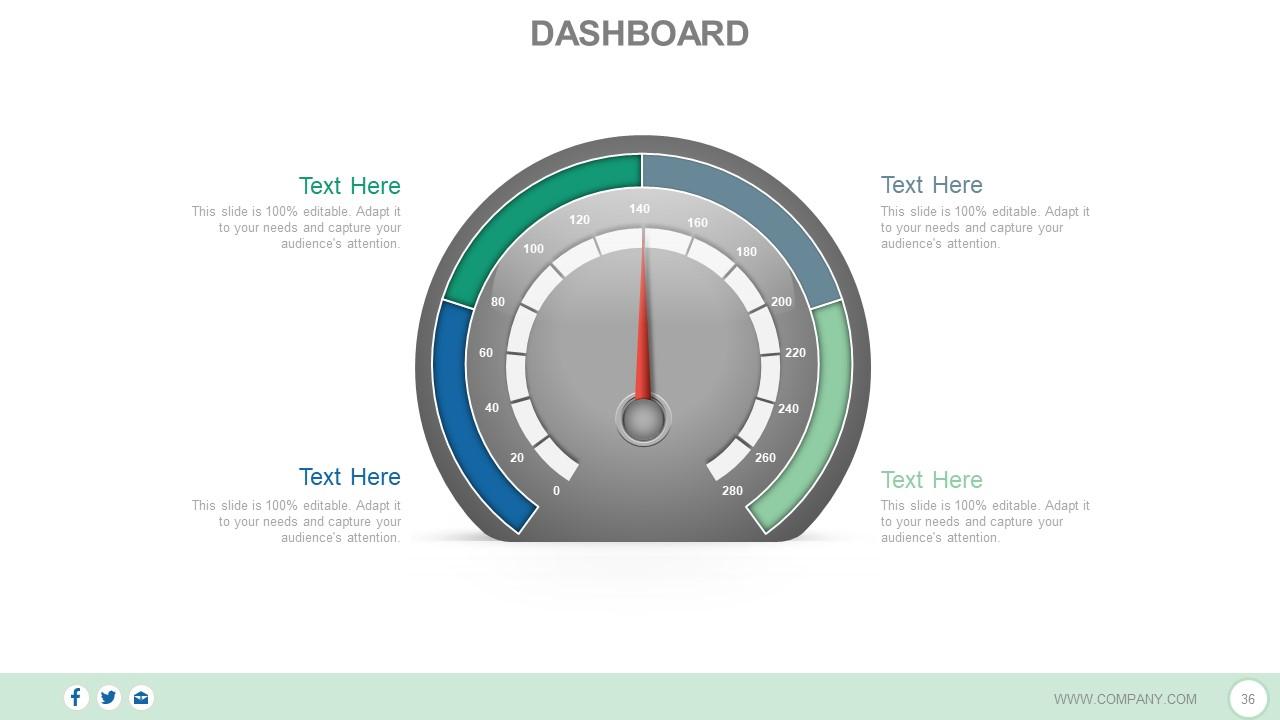
Slide 36: This is a Dashboard slide to show information in percentages etc.
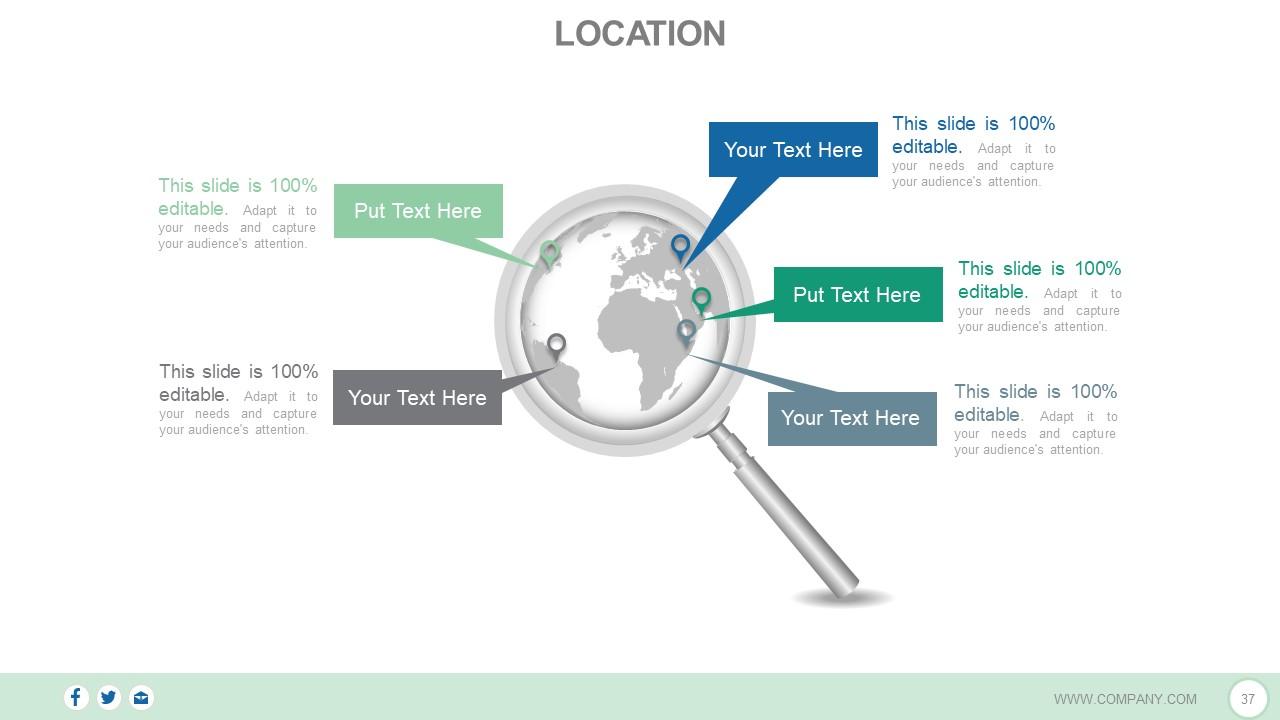
Slide 37: This is a Location slide to show global growth, presence etc. on a world map image.
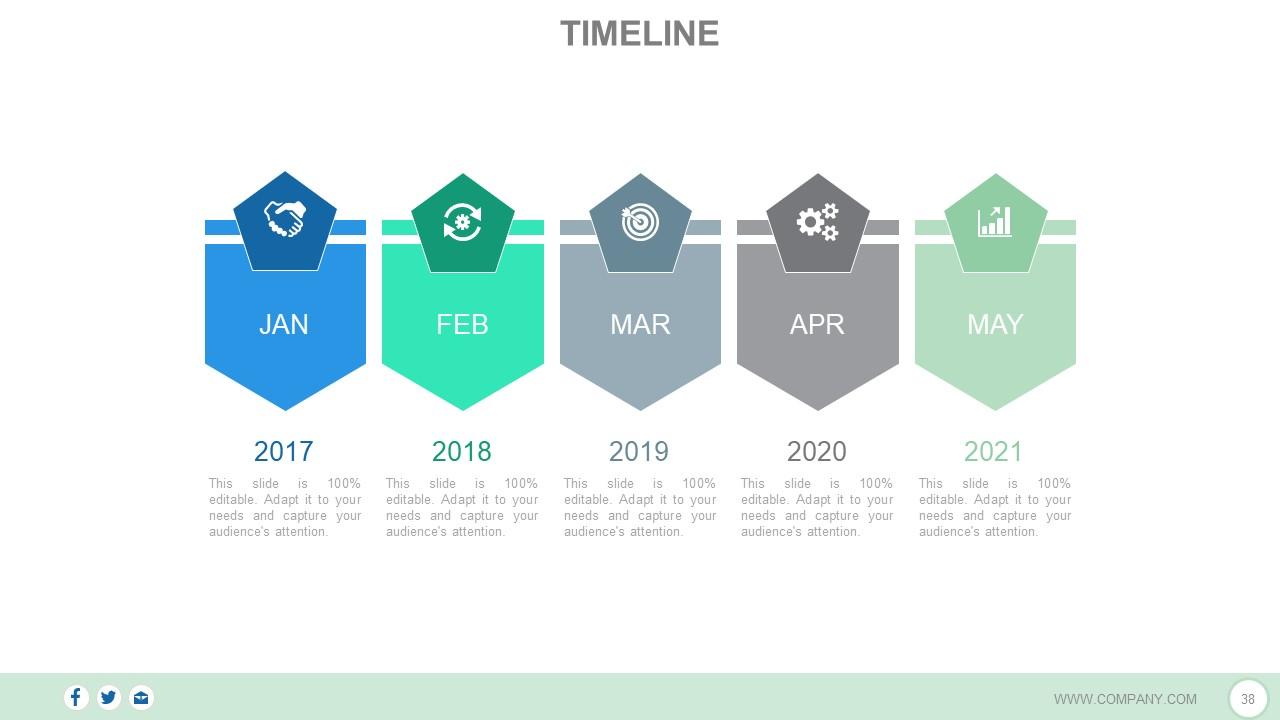
Slide 38: This is a Timeline slide to present important dates, journey, evolution, milestones etc.
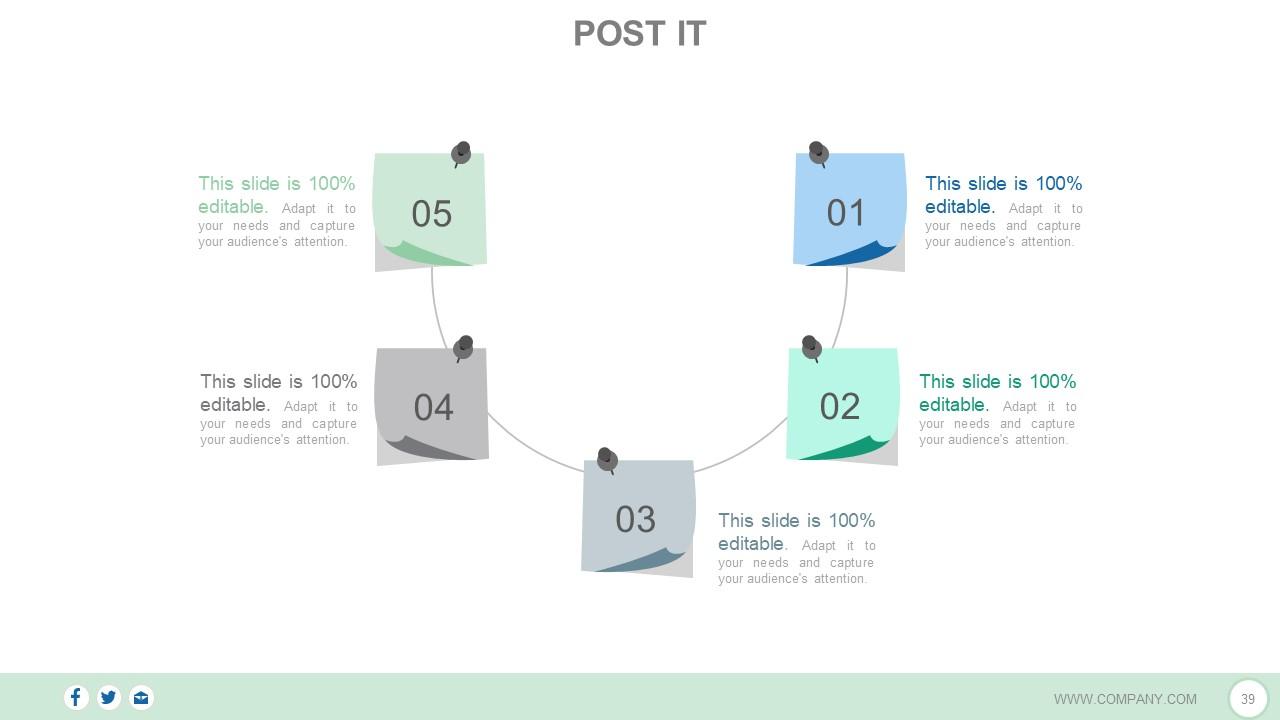
Slide 39: This is a Post It slide to mark events, important information etc.
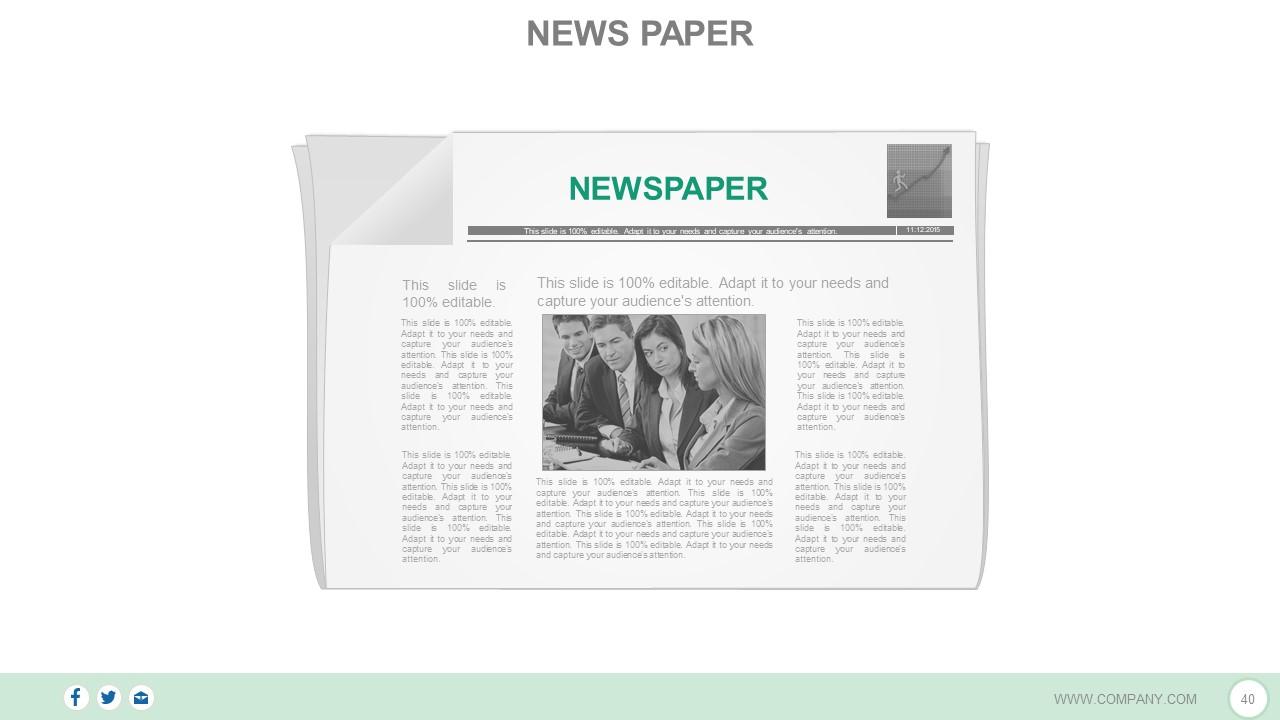
Slide 40: This is a News Paper slide to flash company event, news or anything to highlight.
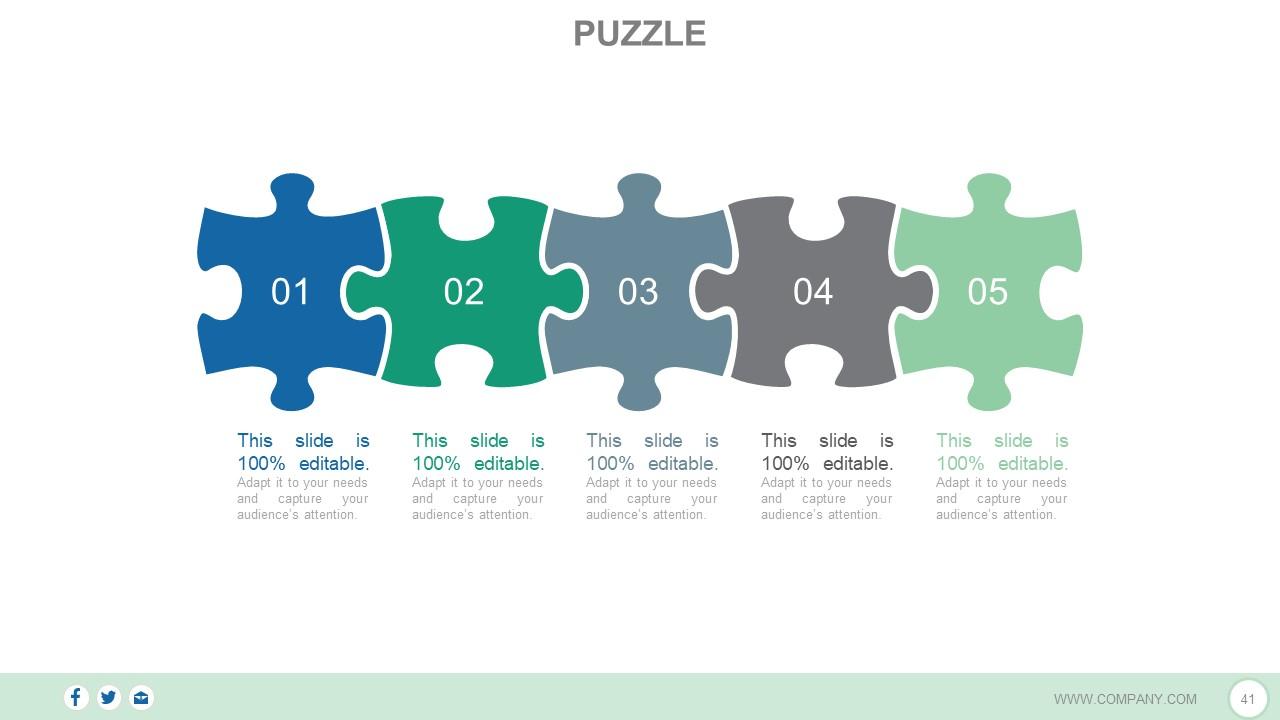
Slide 41: This is a Puzzle pieces image slide to show information, specifications etc.
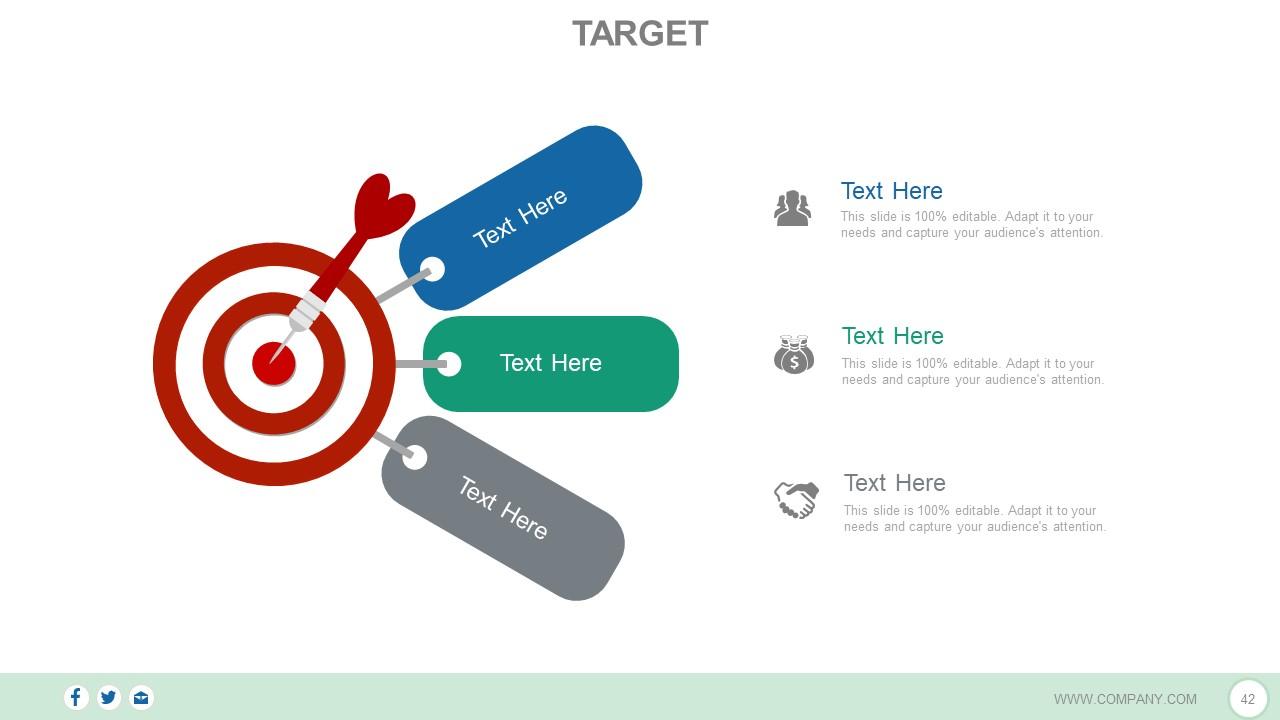
Slide 42: This is a Target image slide. State targets, etc. here.
Slide 43: This is a Circular image slide. State specifications, information here.
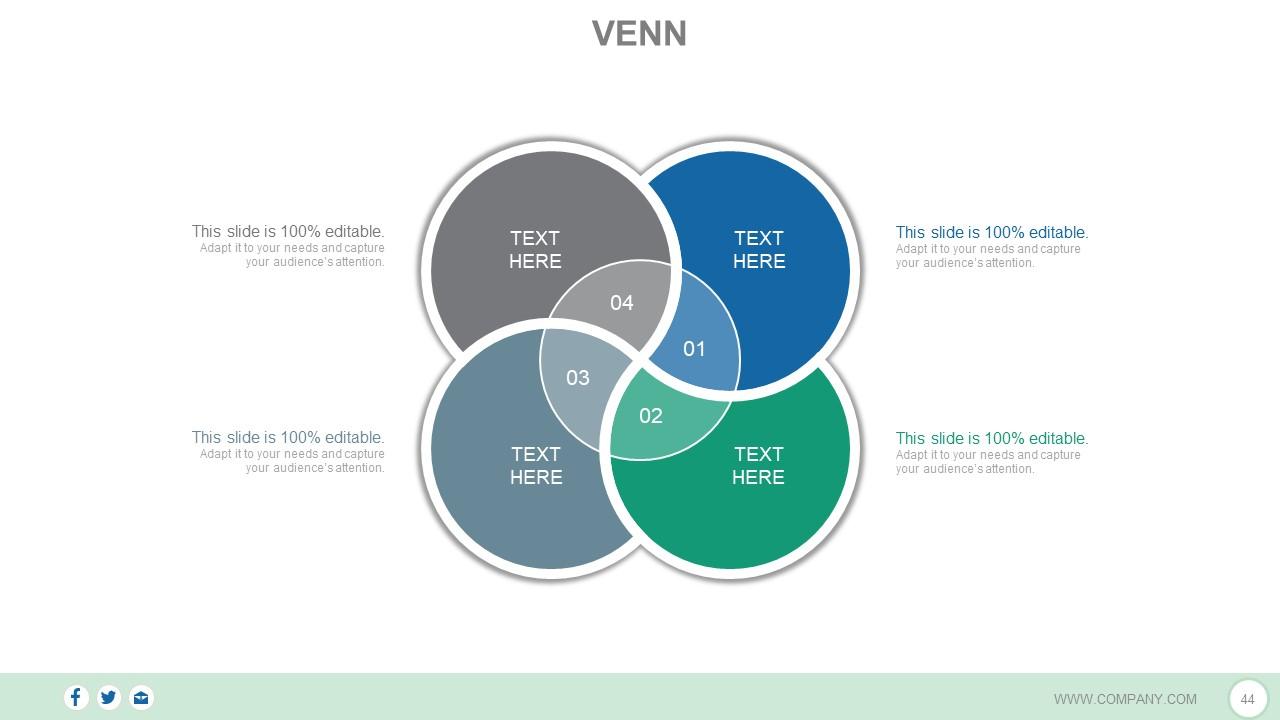
Slide 44: This is a Venn diagram image slide to show information, specifications etc.
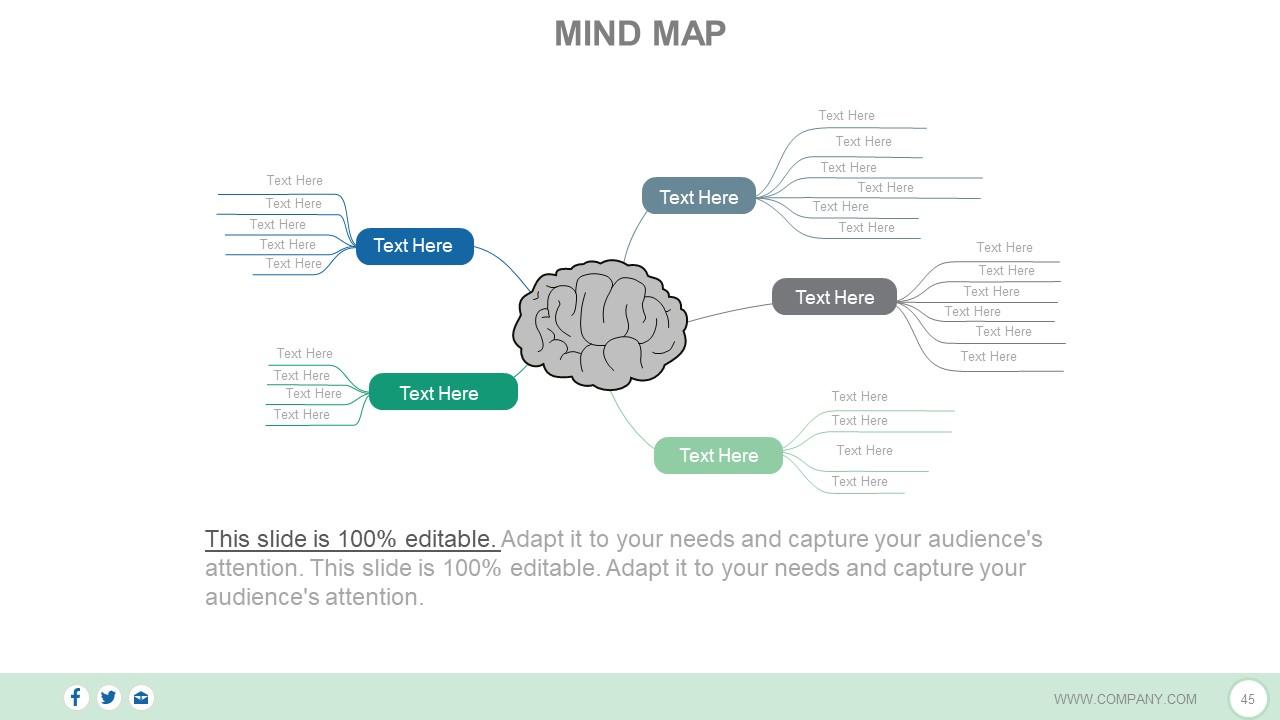
Slide 45: This is a Mind map image slide to show information, specifications etc.
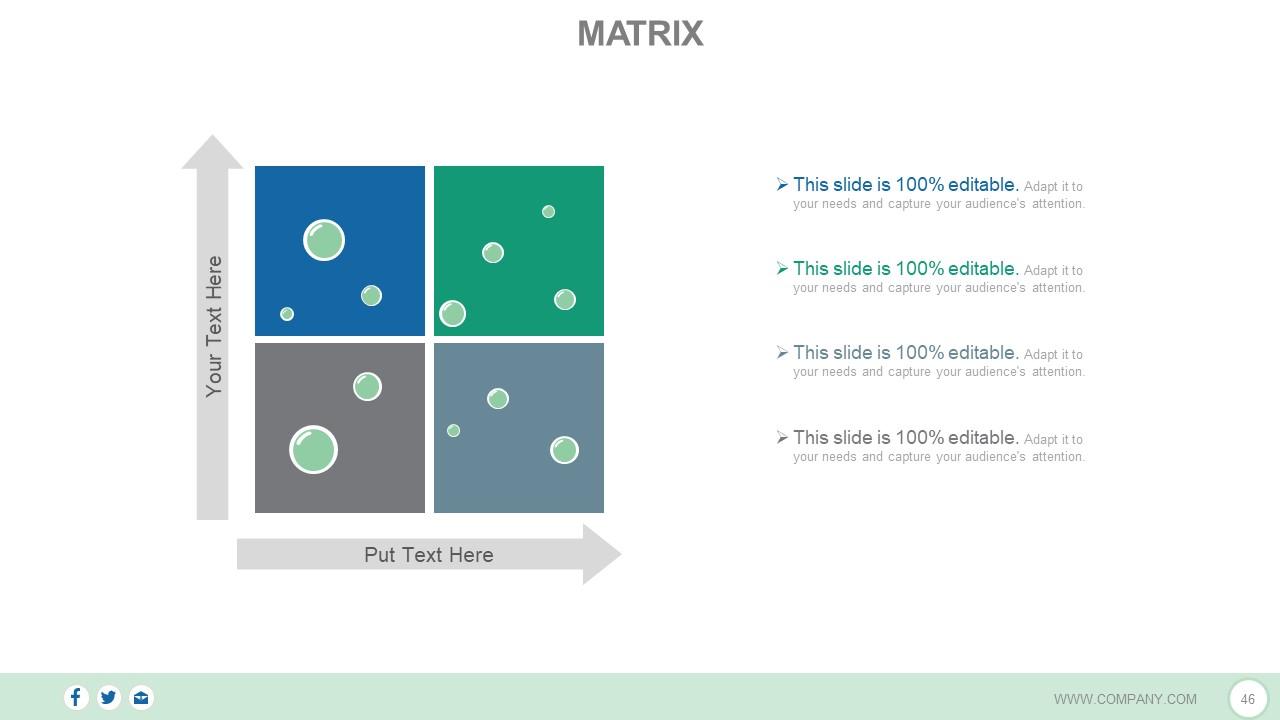
Slide 46: This is a MATRIX slide. Put relevant comparing data here.
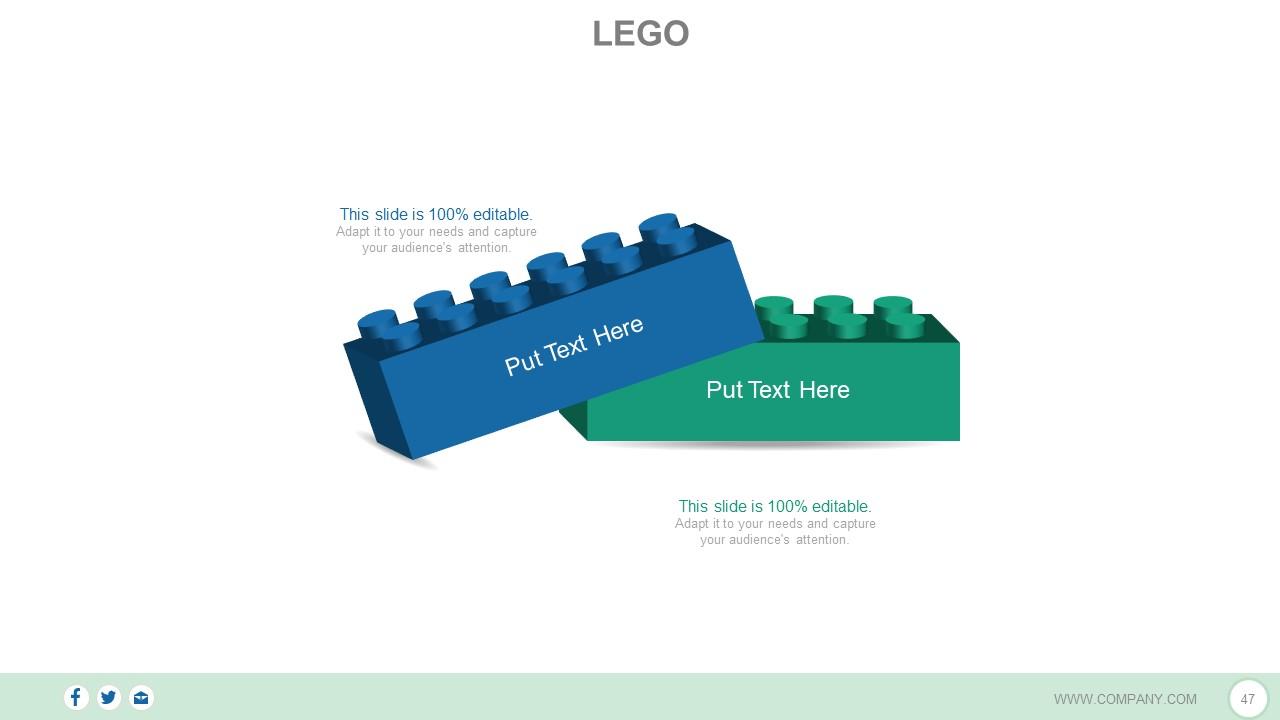
Slide 47: This is a LEGO slide with text boxes to show information.
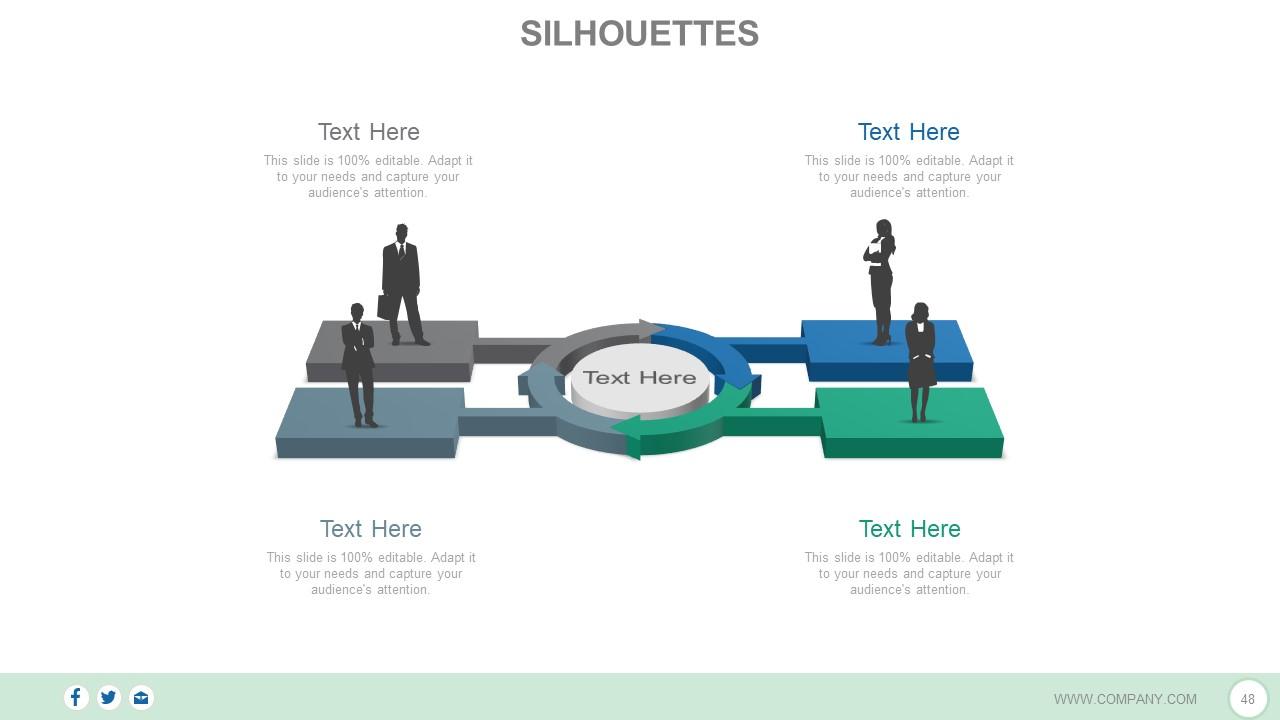
Slide 48: This is a Silhouettes infographic slide to show information, specifications etc.
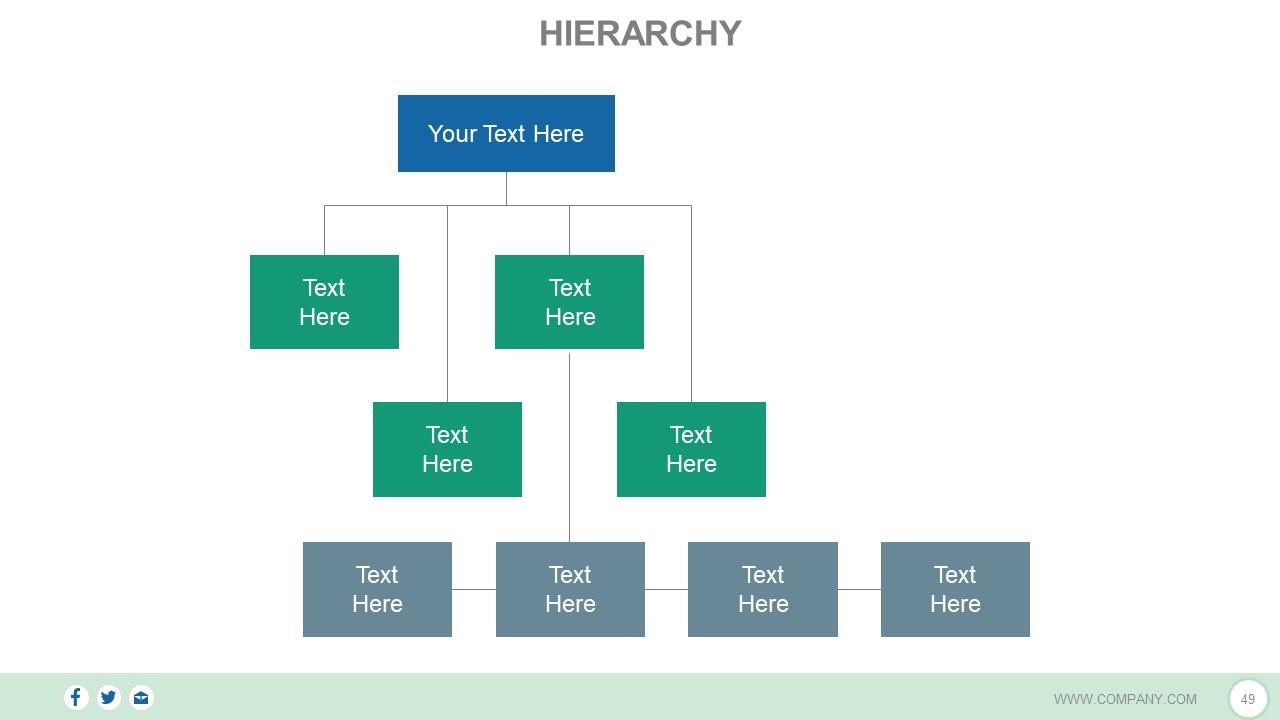
Slide 49: This is a Hierarchy slide to show information, organization/ team structure, specifications etc.
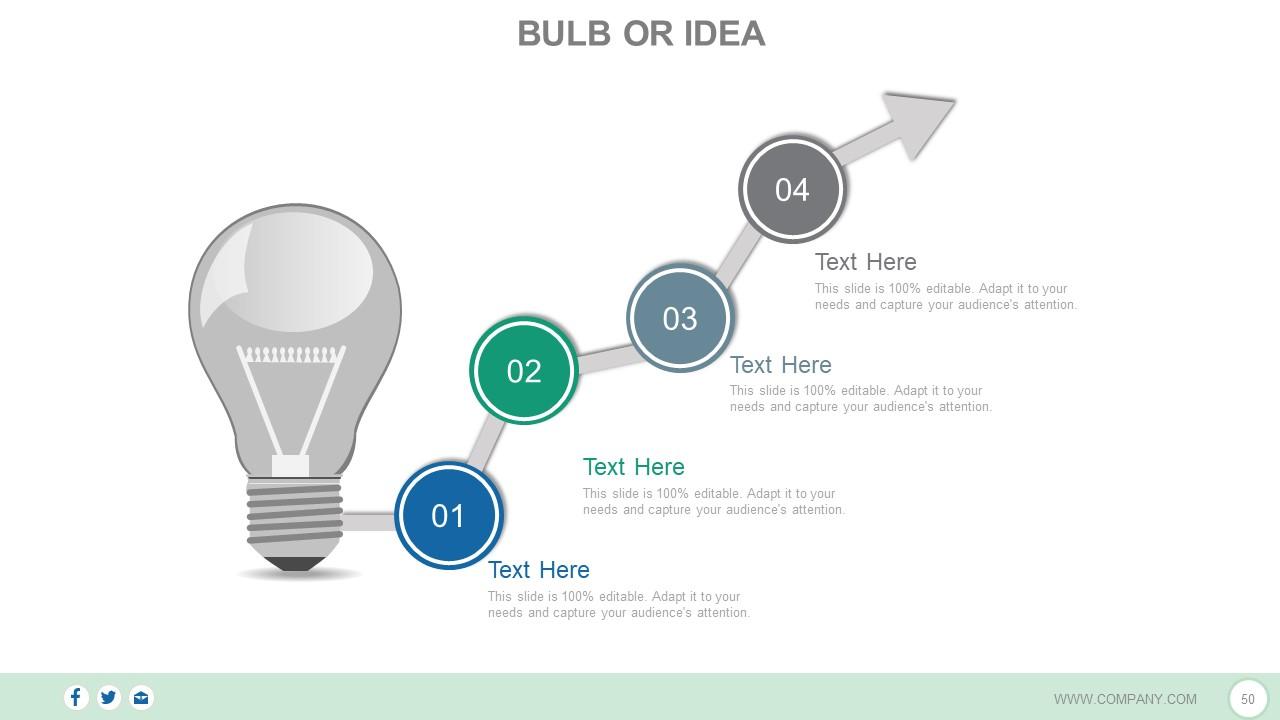
Slide 50: This is a Bulb or Idea image slide to show ideas, innovative information etc.
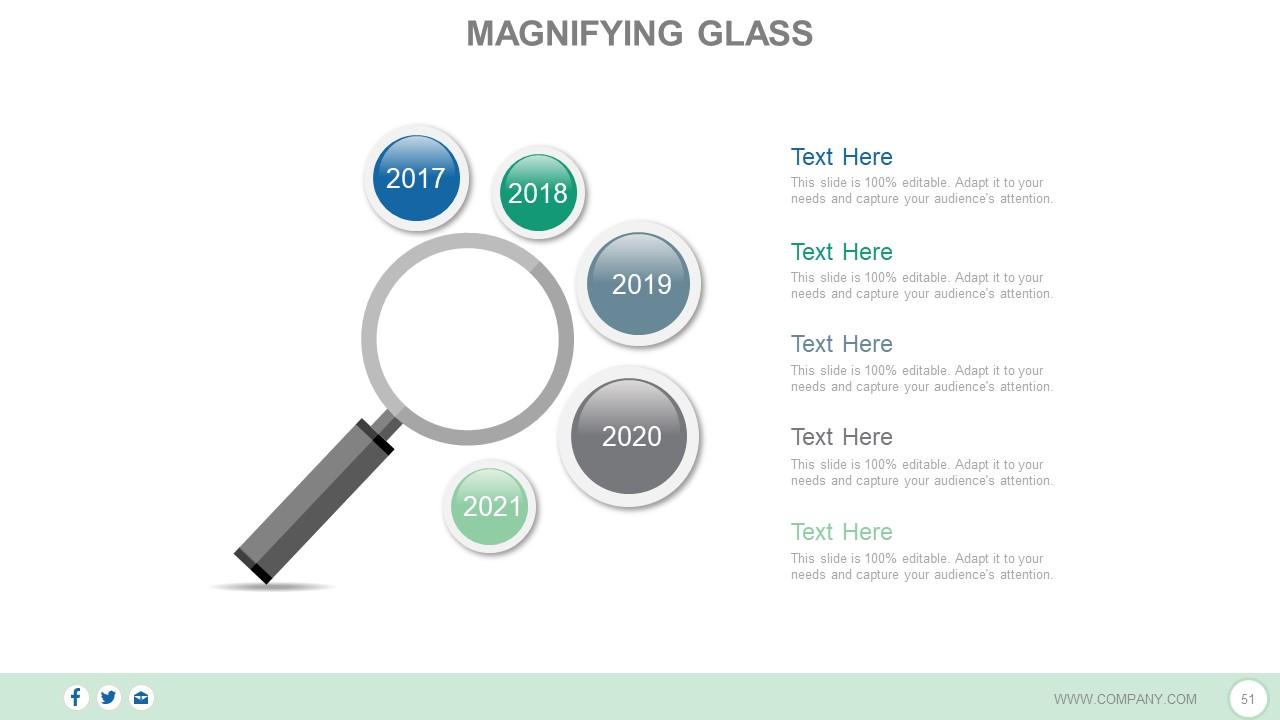
Slide 51: This is a Magnifying Glass image slide to show information, specifications etc.
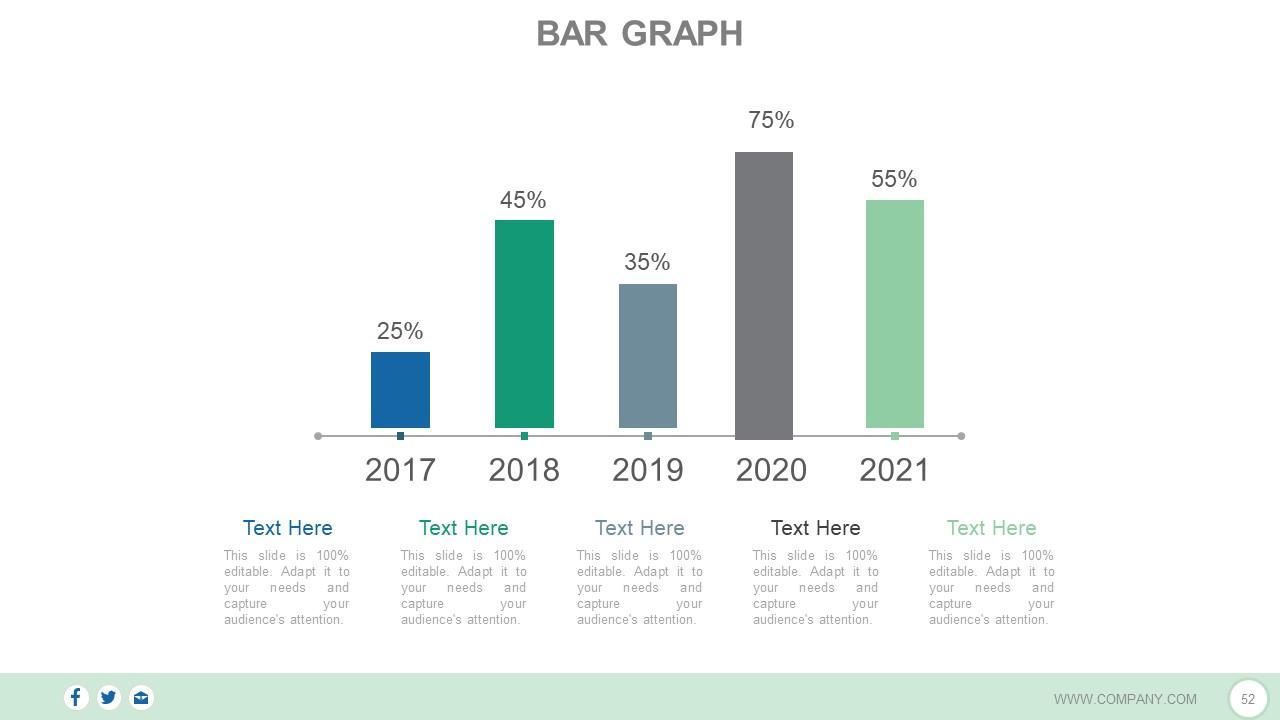
Slide 52: This is a Bar Graph slide to show product/ entity comparison, specifications etc.
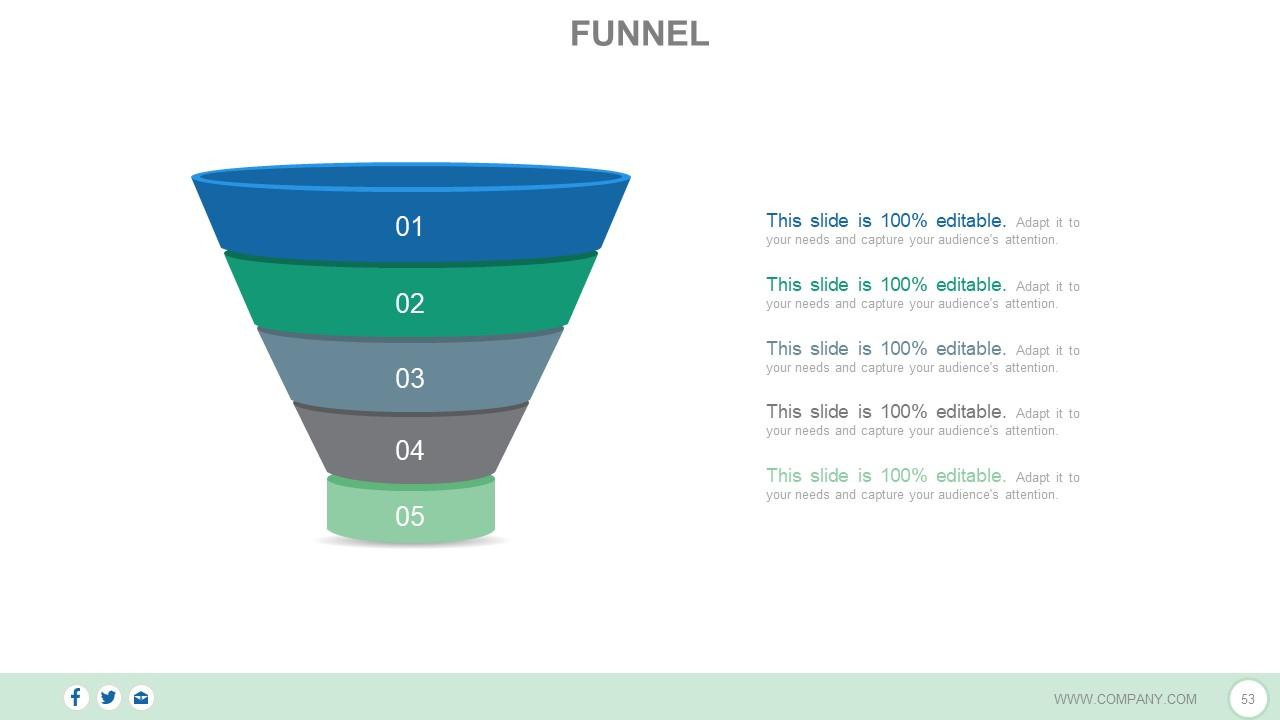
Slide 53: This is a Funnel image slide to show information, funneling aspects, specifications etc.
Slide 54: This is a Thank You image slide with Address, Email and Contact number.
Client centric financial planning process powerpoint presentation slides with all 54 slides:
Convey your ideas with elan. Use our Client Centric Financial Planning Process Complete Powerpoint Deck With Slides as the medium.
-
Perfect template with attractive color combination.
-
Great designs, Easily Editable.
-
Really like the color and design of the presentation.
-
Professional and unique presentations.


