- Sub Categories
-
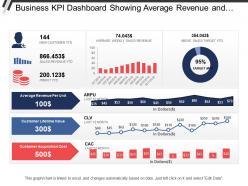 Business Kpi Dashboard Showing Average Revenue And Clv
Presenting this set of slides with name - Business Kpi Dashboard Showing Average Revenue And Clv. This is a three stage process. The stages in this process are Business Dashboard, Business Kpi, Business Performance.
-
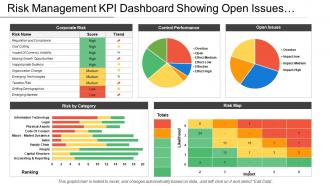 Risk Management Kpi Dashboard Showing Open Issues And Control Performance
Presenting this set of slides with name - Risk Management Kpi Dashboard Showing Open Issues And Control Performance. This is a five stage process. The stages in this process are Risk Management, Risk Assessment, Project Risk.
-
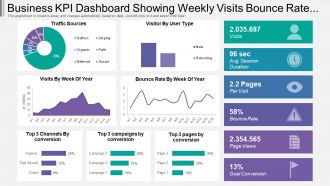 Business Kpi Dashboard Snapshot Showing Weekly Visits Bounce Rate And Traffic Source
Presentation graphic is totally compatible with Google slides. Multiple display options i.e. standard and widescreen. 100 percent editable designs to show your creativity. Similar designs available with different nodes and stages. Easy to download and convert into JPEG or PDF format. Alteration can be done in color, text and shape. Pre-designed PPT slide just download and insert it in the presentation. Quick download with easy to save. Choice to add company logo and replace text as required. High resolution quality ensures no pixilation.
-
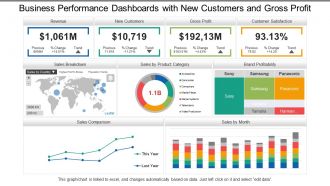 Business Performance Dashboards Snapshot With New Customers And Gross Profit
Presenting, business performance dashboards Snapshot with new customers and gross profit PowerPoint ideas for your ease. Information based slides, creating an impact on the viewer, can be used by specialists from any background, entrepreneurs, and scholars. Engaging and editable font style, type, text design and the content of the icons or the PPT slides. Full-screen view choice available and can be transformed into the desired format. Compatible with Google Slides. Open in widescreen size 16:9 after downloading.
-
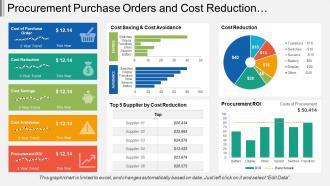 Procurement Purchase Orders And Cost Reduction Dashboard
Presenting this set of slides with name - Procurement Purchase Orders And Cost Reduction Dashboard. This is a five stage process. The stages in this process are Purchase, Procurement, Buy.
-
 Key metrics powerpoint slide
Presenting key metrics powerpoint slide. This is a key metrics powerpoint slide. This is a five stage process. The stages in this process are new customers per month, customer satisfaction, customer retention rate, on time delivery.
-
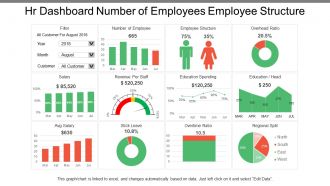 Hr Dashboard Number Of Employees Employee Structure
Presenting this set of slides with name - Hr Dashboard Number Of Employees Employee Structure. This is a four stage process. The stages in this process are Hr Dashboard, Human Resource Dashboard, Hr Kpi.
-
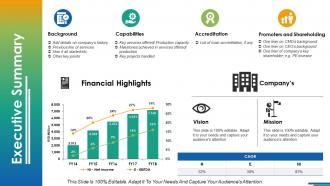 Executive summary ppt infographics example introduction
This is a four stage process. The stages in this process are Background, Capabilities, Accreditation, Vision, Mission.
-
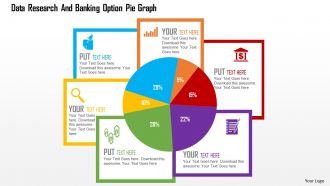 Data Research And Banking Option Pie Graph Flat Powerpoint Design
Exclusive patterns and graphics which are inspired by the current trends to impress the audience. Versatile and multipurpose PPT presentation diagram. Creates transparency of business processes. Enables better understanding and memorising the information displayed. Runs smoothly with all software’s. Compatible with Google framework. 100% amendable icons and images.
-
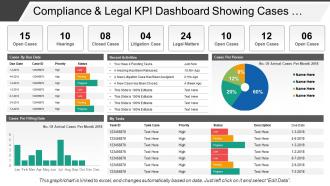 Compliance And Legal Kpi Dashboard Showing Cases By Due Date
Presenting this set of slides with name - Compliance And Legal Kpi Dashboard Showing Cases By Due Date. This is a four stage process. The stages in this process are Compliance And Legal, Legal Governance, Risk Management.
-
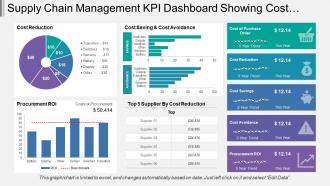 Supply Chain Management Kpi Dashboard Showing Cost Reduction And Procurement Roi
Presenting this set of slides with name - Supply Chain Management Kpi Dashboard Showing Cost Reduction And Procurement Roi. This is a five stage process. The stages in this process are Demand Forecasting, Predicting Future Demand, Supply Chain Management.
-
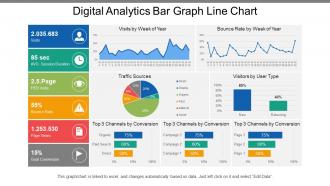 Digital analytics bar graph line chart
Presenting this set of slides with name - Digital Analytics Bar Graph Line Chart. This is a five stage process. The stages in this process are Digital Analytics, Digital Dashboard, Digital Kpis.
-
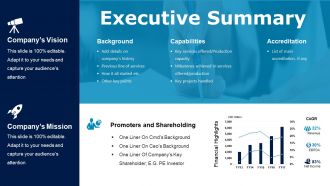 Executive summary powerpoint slide deck
Presenting executive summary powerpoint slide deck. Presenting executive summary powerpoint slide deck. Presenting executive summary powerpoint slide deck. This is a executive summary powerpoint slide deck. This is a two stage process. The stages in this process are background, capabilities, accreditation, promoters and shareholding.
-
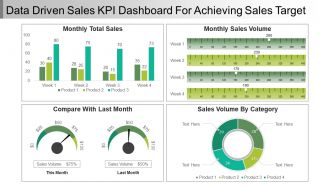 Data Driven Sales Kpi Dashboard Snapshot For Achieving Sales Target Ppt Samples
This PPT can be downloaded very conveniently on a click of a button. Your business presentation looks very professional with its use. The images used in this PPT template are 100% editable. The color, size and orientation of any icon can easily be changed in this presentation as you wish. The excel-linked chart can be edited as the shapes automatically adjusts according to your data. You can select from thousands of editable icons on each and every topic. Personalize the presentation with individual company name and logo. It can be viewed and saved in JPG or PDF format. It is fully compatible with Google slides as well.
-
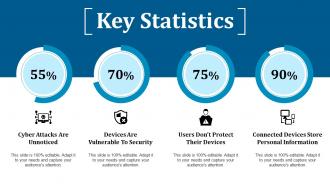 Key statistics ppt show deck
Presenting this set of slides with name - Key Statistics Ppt Show Deck. This is a four stage process. The stages in this process are Devices Are Vulnerable To Security, Users Dont Protect Their Devices, Cyber Attacks Are Unnoticed.
-
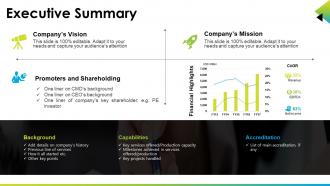 Executive summary ppt presentation examples
High resolution Presentation design is easy to portray and share with audience. PPT diagram is easy to amend as elements like font, colors and shape are editable. Download is hasty which saves time as well as effort. Tailor it by injecting corporation trade name and design. Display in both Standard and Widescreen format. Presentation design is totally responsive with Google slides. PPT PowerPoint slide comes with creative and professional approach.
-
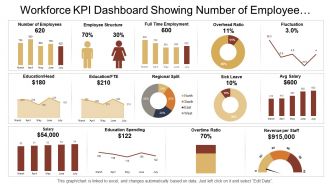 Workforce kpi dashboard showing number of employee overhead ratio and salary
Presenting this set of slides with name - Workforce Kpi Dashboard Showing Number Of Employee Overhead Ratio And Salary. This is a three stage process. The stages in this process are Staff, Personnel, Workforce.
-
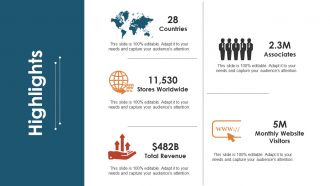 Highlights ppt graphics
Presenting this set of slides with name - Highlights Ppt Graphics. This is a five stage process. The stages in this process are Stores Worldwide, Total Revenue, Monthly Website Visitors, Associates, Countries.
-
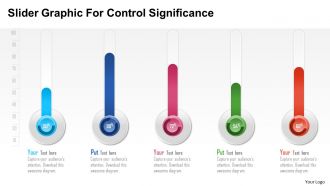 Slider graphic for control significance powerpoint template
We are proud to present our slider graphic for control significance powerpoint template. Graphic of slider has been used to craft this power point template. This PPT diagram contains the concept of control. Use this PPT diagram for business and marketing related presentations.
-
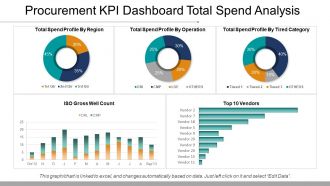 Procurement Kpi Dashboard Total Spend Analysis Ppt Samples
Presenting procurement kpi dashboard total spend analysis ppt samples. This is a procurement kpi dashboard total spend analysis ppt samples. This is a five stage process. The stages in this process are business, strategy, growth, finance, chart and graph.
-
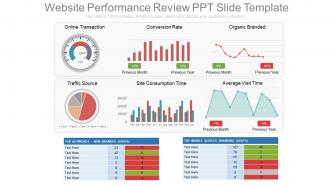 Website performance review ppt slide template
These are exclusively codified PPT design schemes which are quite suitable for online business managers, process experts etc. These PPT graphics can be acclimating with divergent software’s and Google slides. These are wonderfully conceived pictorial Presentation templates which can be customizable in to other file formats like PDF or JPG. They have an alterable designs, forms, colors, contents etc. These Website performance PPT design can also provide a space to add the title or subtitle as per your need.
-
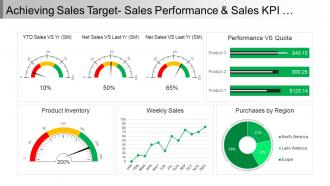 Achieving Sales Target Sales Performance And Sales Kpi Dashboard Snapshot Ppt Icon
Presenting Achieving Sales Target Sales Performance and Sales KPI Dashboard Snapshot PPT Icon. This presentation includes five stage processes with all the instructions to customize as per your needs and preferences. The stages in this process are sales objectives, sales goal, achieving sales target. You can add your brand’s name, logo or label for that extra impact. The Complete information and Enhanced Visuals are the strongest points of this Sales KPI Dashboard PPT.
-
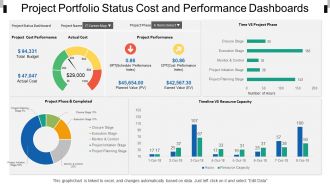 Project portfolio status cost and performance dashboards snapshot
Presenting, project portfolio status cost and performance dashboards snapshot. This is an appealing design for project portfolio status cost and performance focused PowerPoint presentation. This PPT template can be used by experts from various backgrounds to present their ideas in a contemporary way. This slide is cooperative with google slides and after downloading you can use it in full version and insert your company's logo for your best practice. Unique thinking to mesmerize your audience. Fully editable PowerPoint colors, orientation, text, and graphics.
-
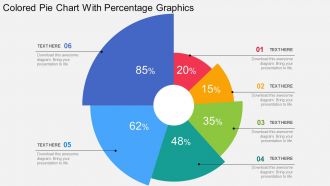 Colored pie chart with percentage graphics flat powerpoint design
We are proud to present our colored pie chart with percentage graphics flat powerpoint design. Graphic of colored pie chart has been used to craft this power point template diagram. This PPT diagram contains the concept of financial analysis. Use this PPT diagram for business and finance related presentations.
-
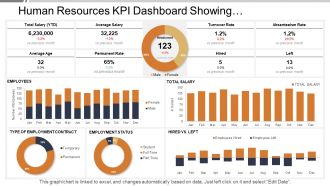 Human resources kpi dashboard showing employment status turnover rate
SlideTeam presents the Human Resources Kpi Dashboard Showing Employment Status Turnover Rate PPT which will help you keep a track of the human capital working under you. All the slides in the slideshow are 100 percent editable and you can make all the desired changes in the presentation. You can also add or delete the slides All the slides are fully compatible with Google slides as well. Your audience will be amazed by Google slides. You can even view the document in 16:9 widescreen size.
-
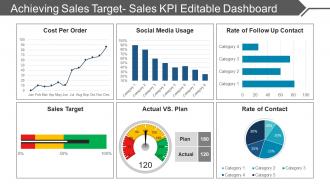 Achieving Sales Target Sales Kpi Editable Dashboard Snapshot Ppt Diagrams
Presenting achieving sales target sales kpi editable dashboard PPT diagrams. Simple data input like company logo, name or trademark. This PowerPoint theme is fully supported by Google slides. Picture quality of these slides does not change even when projected on large screen. Fast downloading speed and formats can be easily changed to JPEG and PDF applications. This template is suitable for marketing, sales persons, business managers and entrepreneurs. Adjust PPT layout, font, text and color as per your necessity.
-
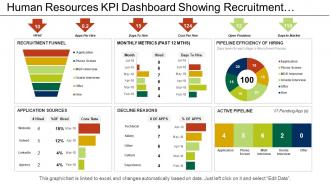 Human resources kpi dashboard showing recruitment funnel application sources
Presenting this set of slides with name - Human Resources Kpi Dashboard Showing Recruitment Funnel Application Sources. This is a six stage process. The stages in this process are Human Resource, Hrm, Human Capital.
-
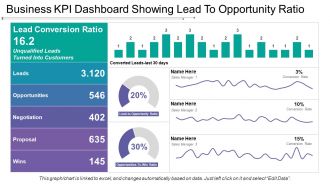 Business kpi dashboard showing lead to opportunity ratio
Presenting this set of slides with name - Business Kpi Dashboard Showing Lead To Opportunity Ratio. This is a three stage process. The stages in this process are Business Dashboard, Business Kpi, Business Performance.
-
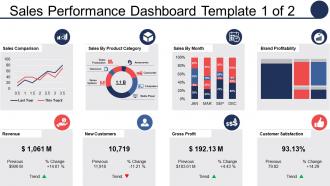 Sales performance dashboard sales comparison sales by product category
Introducing sales performance dashboard sales comparison sales by product category PPT design. Tailor the design with trade name, icon and even tagline. Fast download and easy to convert into JPG and PDF. Alternative to share presentation diagram in standard and widescreen display view. High quality PowerPoint slide comes with editable options as color, text and font can be edited at any stage. PowerPoint graphic is available with different nodes and stages.
-
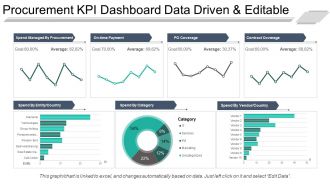 Procurement kpi dashboard snapshot data driven and editable ppt sample file
Presenting procurement kpi dashboard snapshot data driven and editable ppt sample file. This is a procurement kpi dashboard data driven and editable ppt sample file. This is a seven stage process. The stages in this process are business, strategy, growth, finance, chart and graph.
-
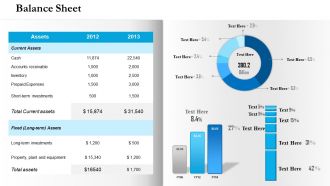 0314 presentation of financial statements
High-quality PowerPoint presentation backgrounds. Adaptable PPT slides as fully compatible with Google slides. Does not interfere with the speed and consistency of the system. Beneficial for industry professionals, managers, executives, researchers, etc. The presentation template can be downloaded and saved in any desired format. Privilege of insertion of logo and trademarks for more personalization. Runs effortlessly with all the software’s without generating any errors.
-
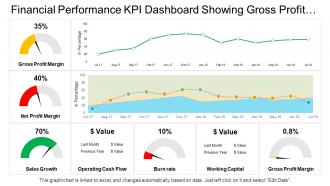 Financial performance kpi dashboard showing gross profit margin sales growth operating cash flow
Presenting this set of slides with name - Financial Performance Kpi Dashboard Showing Gross Profit Margin Sales Growth Operating Cash Flow. This is a three stage process. The stages in this process are Financial Performance, Financial Report, Financial Review.
-
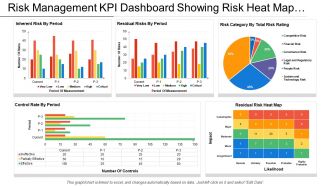 Risk Management Kpi Dashboard Showing Risk Heat Map And Control Rate By
Presenting this set of slides with name - Risk Management Kpi Dashboard Showing Risk Heat Map And Control Rate By Period. This is a five stage process. The stages in this process are Risk Management, Risk Assessment, Project Risk.
-
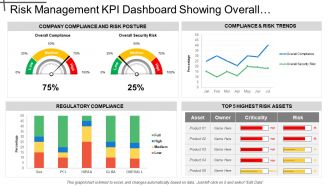 Risk Management Kpi Dashboard Showing Overall Security Risk And Regulatory
Presenting this set of slides with name - Risk Management Kpi Dashboard Showing Overall Security Risk And Regulatory Compliance. This is a four stage process. The stages in this process are Risk Management, Risk Assessment, Project Risk.
-
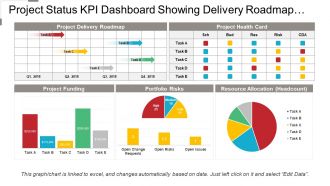 Project status kpi dashboard snapshot showing delivery roadmap and resource allocation
Presenting project status KPI dashboard snapshot showing delivery roadmap and resource allocation. Simple data input with linked Excel chart, just right click to input values. This PowerPoint theme is fully supported by Google slides. Picture quality of these slides does not change even when project on large screen. Fast downloading speed and formats can be easily changed to JPEG and PDF applications. This template is suitable for marketing, sales persons, business managers and entrepreneurs. Adjust PPT layout, font, text and color as per your necessity.
-
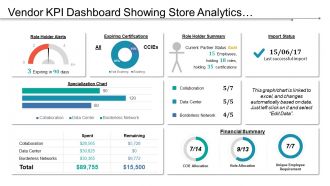 Vendor kpi dashboard showing role holder alerts and specialization chart
Presenting Vendor KPI Dashboard Showing Role Holder Alerts And Specialization Chart Pictures PPT slide. This presentation design has been professionally designed, is fully editable in PowerPoint and is compatible with Google slides as well. The font type, font size, colors of the diagrams, background color are customizable and the company logo can be added too. High quality graphs, charts, tables and icons ensure that there is no deteriorating in quality on enlarging their size. Fast download at click of a button.
-
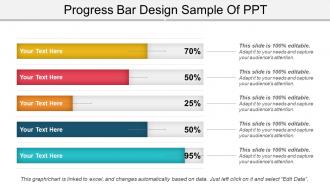 Progress bar design sample of ppt
Presenting a PowerPoint slide named Progress Bar Design Sample of PPT. Use this completely customizable and easy-to-edit PPT slide to communicate your ideas in the presentation. You can format the font size, color and style of the slide. Add your desired content anywhere in the slide. Its compatibility with Google Slides makes it readily accessible. You can save it in PDF, JPEG or JPG formats. This PPT slide is Excel-linked. You can avail it in a widescreen size as well a standard size screen.
-
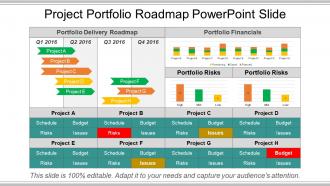 Project portfolio roadmap powerpoint slide
Presenting project portfolio roadmap PowerPoint slide. This is professional developed Presentation graphic. The PPT layout also provides the high resolution quality levels which remains unaffected even when projected on to the wider screens. This PPT slide is also simple to use and download. All the features diagram, chart, design, pattern, size, color, and PowerPoint image etc. are totally modifiable. This is also well conversant with the Google Slides and other operating software. Can be used with the different file formats such as PDF or JPG.
-
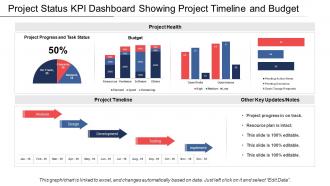 Project status kpi dashboard showing project timeline and budget
Presenting this set of slides with name - Project Status Kpi Dashboard Showing Project Timeline And Budget. This is a five stage process. The stages in this process are Project Health Card, Project Performance, Project Status.
-
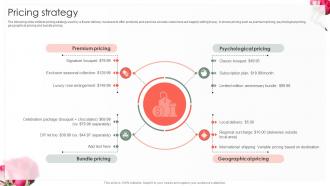 Pricing Strategy Flower Delivery Retail Business Startup Go To Market Strategy GTM SS V
The following slide outlines pricing strategy used by a flower delivery business to offer products and services at costs customers are happily willing to pay. It shows pricing such as premium pricing, psychological pricing, geographical pricing and bundle pricing. Introducing Pricing Strategy Flower Delivery Retail Business Startup Go To Market Strategy GTM SS V to increase your presentation threshold. Encompassed with four stages, this template is a great option to educate and entice your audience. Dispence information on Premium Pricing, Bundle Pricing, Psychological Pricing, Geographical Pricing, using this template. Grab it now to reap its full benefits.
-
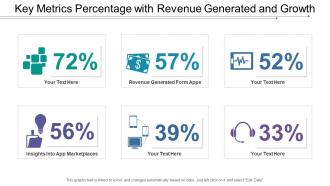 Key metrics percentage with revenue generated and growth
This key metrics percentage with revenue generated and growth PowerPoint presentation can be downloaded for free from the SlideTeam webpage. This presentation is 100% editable in aspects like font, font size, font color, etc. It contains shapes like squares, triangles, circles, pentagons, etc. which can be varied by size. Any of the shapes can be resized and their color can be edited as well. You can use your own icons in this PPT as well and they can be edited as well. Selection can be made out of thousands of available icons in this PPT and can be edited as well. It can be viewed and saved in JPG or PDF format. It is fully compatible with Google slides as well.
-
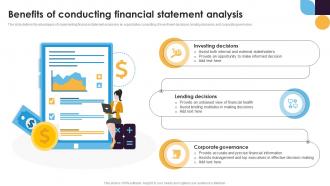 Benefits Of Conducting Financial Statement Analysis For Improving Business Fin SS
This slide defines the advantages of implementing financial statement analysis in an organization consisting of investment decisions, lending decisions, and corporate governance. Increase audience engagement and knowledge by dispensing information using Benefits Of Conducting Financial Statement Analysis For Improving Business Fin SS. This template helps you present information on three stages. You can also present information on Investing Decisions, Lending Decisions, Corporate Governance using this PPT design. This layout is completely editable so personaize it now to meet your audiences expectations.
-
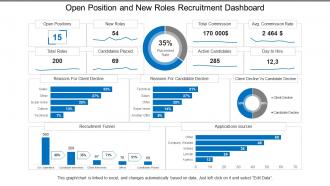 Open position and new roles recruitment dashboard
Presenting this set of slides with name - Open Position And New Roles Recruitment Dashboard. This is a three stage process. The stages in this process are Staffing Plan, Recruitment, Staff Management.
-
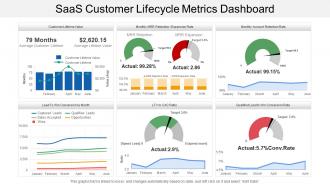 Saas customer lifecycle metrics dashboard
Presenting this set of slides with name - Saas Customer Lifecycle Metrics Dashboard. Highlighting Saas customer lifecycle metrics dashboard PowerPoint presentation. Offer 100% access to change the size and style of the slides once downloaded and saved in the desired format. Beneficial for the business managers, marketing professionals and the strategy designers. Access to convert the presentation design into JPG and PDF. High quality images and visuals used in the designing process. Choice to get presentation slide in standard or in widescreen view. Easy to convert in JPEG and PDF document.
-
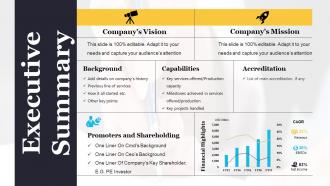 Executive summary example of ppt presentation
Presenting executive summary example PowerPoint Presentation. Elegant and simple visuals help you present your research in easy to understand, visual style. Presentation is downloaded in both widescreen (16:9) and standard screen (4:3) aspect ratio. Presentation template is compatible with Google slides. Fully editable in PowerPoint slideshow. Customize the font size, font color, graphic colors, and slide background without any hassle. The slides have text placeholders to enter your presentation content. PPT images with unaffected high resolution after editing any number of times.
-
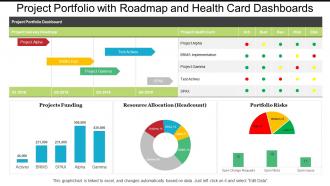 Project portfolio with roadmap and health card dashboards
Presenting, project portfolio with roadmap and health card dashboards. This Design possesses a construction that not only has a high market need but also displays clear judgment about the details and concept of the organization. It is obvious that there are various risks involved in a new business process so selecting an active medium to propose the message and other learning is very vital. These PPT designs have an addition to the advantage that these are pre-designed which makes it even more convenient for the new business.
-
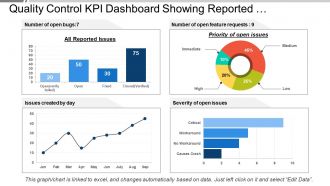 Quality control kpi dashboard showing reported issues and priority
Presenting this set of slides with name - Quality Control Kpi Dashboard Showing Reported Issues And Priority. This is a four stage process. The stages in this process are Quality Management, Quality Control, Quality Assurance.
-
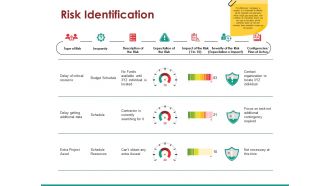 Risk identification ppt examples
Presenting this set of slides with name - Risk Identification Ppt Examples. This is a three stage process. The stages in this process are Type Of Risk, Jeopardy, Description Of The Risk, Expectation Of The Risk.
-
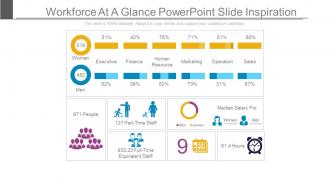 Workforce at a glance powerpoint slide inspiration
Presenting workforce at a glance powerpoint slide inspiration. This is a workforce at a glance powerpoint slide inspiration. This is a two stage process. The stages in this process are women, executive, finance, human resource, marketing, operation, sales, median salary for,part time staff,full time equivalent staff.
-
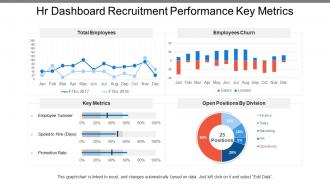 Hr dashboard snapshot recruitment performance key metrics
Presenting this set of slides with name - Hr Dashboard Snapshot Recruitment Performance Key Metrics. This is a four stage process. The stages in this process are Hr Dashboard, Human Resource Dashboard, Hr Kpi.
-
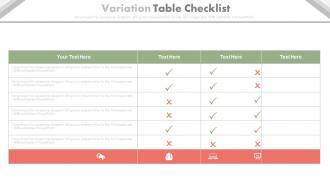 Three staged variation table checklist powerpoint slides
Presenting three staged variation table checklist powerpoint slides. This Power Point template diagram slide has been crafted with graphic of three staged table and checklist diagram. This PPT diagram slide contains the concept of our services representation. Use this PPT slide for finance and business related presentations.
-
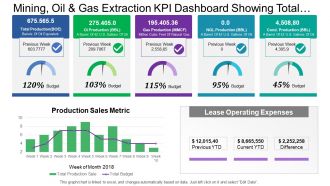 Mining oil and gas extraction kpi dashboard showing total production and budget
Presenting this set of slides with name - Mining Oil And Gas Extraction Kpi Dashboard Showing Total Production And Budget. This is a three stage process. The stages in this process are Mining, Oil And Gas Extraction, Refinery, Natural Gas.
-
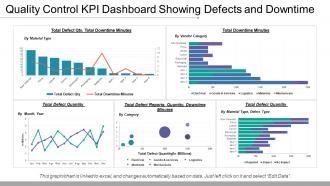 Quality control kpi dashboard showing defects and downtime
Presenting this set of slides with name - Quality Control Kpi Dashboard Showing Defects And Downtime. This is a five stage process. The stages in this process are Quality Management, Quality Control, Quality Assurance.
-
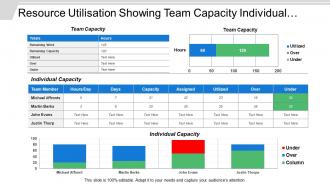 Resource utilisation showing team capacity individual capacity
Presenting this set of slides with name - Resource Utilisation Showing Team Capacity Individual Capacity. This is a four stage process. The stages in this process are Resource Management, Resource Utilization, Resource Allocation.
-
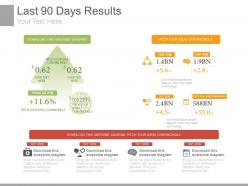 Last 90 days results ppt slides
100% editable outlines for down to earth showcasing to meet your introduction necessity. PowerPoint slides are perfect with Google slides. Standard and widescreen show choices. Simple to change over into JPEG or PDF design. Quick to download in your introduction. Valuable for each industry i.e. deals, showcasing, back and so on. Direction for executing the progressions has been accommodated help. Opportunity to redo it with organization name and logo. The stages in this process are finance, icons, business.
-
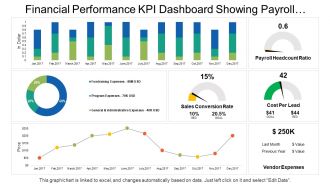 Financial performance kpi dashboard showing payroll headcount ratio cost per lead
Presenting this set of slides with name - Financial Performance Kpi Dashboard Showing Payroll Headcount Ratio Cost Per Lead. This is a seven stage process. The stages in this process are Financial Performance, Financial Report, Financial Review.
-
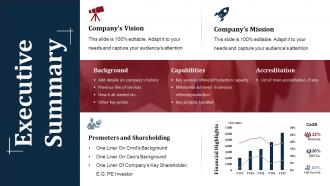 Executive summary powerpoint slide background image
Presenting executive summary powerpoint slide background image. • Tension free download possible. • Once downloaded, the presentation can be modified to any format like JPG, JPEG, PDF, etc • It’s also compatible with multiple software and Google slides. • The provided executive summary PPT presentation template can easily be used solely or as part your pre built presentation. • Be happy to customize and personalize the presentation with company specifications. • There is no hassle when any fact, figures or text is to be included or excluded in the presentation. • Picture quality compatible with wide screen exposure. • Much appreciated and used by business executives, professionals, students and teachers.
-
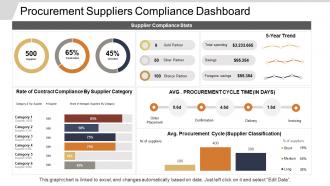 Procurement suppliers compliance dashboard
Presenting this set of slides with name - Procurement Suppliers Compliance Dashboard. This is a four stage process. The stages in this process are Purchase, Procurement, Buy.
-
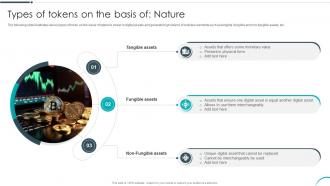 Types Of Tokens On The Basis Of Nature Revolutionizing Investments With Asset BCT SS
The following slide illustrates various types of token on the basis of nature to invest in digital assets and generate high returns. It includes elements such as tangible, fungible and non-fungible assets, etc. Introducing Types Of Tokens On The Basis Of Nature Revolutionizing Investments With Asset BCT SS to increase your presentation threshold. Encompassed with three stages, this template is a great option to educate and entice your audience. Dispence information on Tangible Assets, Fungible Assets, Non-Fungible Assets, using this template. Grab it now to reap its full benefits.
-
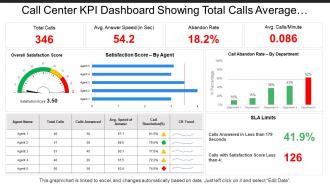 Call center kpi dashboard showing total calls average answer speed abandon rate
Presenting this set of slides with name - Call Center Kpi Dashboard Showing Total Calls Average Answer Speed Abandon Rate. This is a five stage process. The stages in this process are Call Center Agent, Customer Care, Client Support.


