Private Company Liquidity Options Powerpoint Presentation Slides
Outline the exit strategy for startup by employing Private Company Liquidity Options PowerPoint Presentation Slides. The presentation gives an overview of the company with a brief description of top management, organization chart, milestones achieved, ownership pattern of shareholders, and the firm’s financial performance. Showcase various stages that the firm has gone through to raise funds with the help of exit strategy PPT layouts. The slides also depict the importance of having an exit strategy for the firm, such as lesser time to exit, risks getting reduced, and increased IRR. It also highlights the ideal time for investors to exit the firm to secure an optimal internal rate of return. Take the assistance of contingency plan PowerPoint templates and showcase different ways to leave the firm. The slides further present information about the IPO process. Provide insights into the IPO market by taking advantage of firm exit strategy PPT slideshow. Thus, download our ready-to-use PowerPoint presentation without any further delay to give an edge to your competitors.
- Google Slides is a new FREE Presentation software from Google.
- All our content is 100% compatible with Google Slides.
- Just download our designs, and upload them to Google Slides and they will work automatically.
- Amaze your audience with SlideTeam and Google Slides.
-
Want Changes to This PPT Slide? Check out our Presentation Design Services
- WideScreen Aspect ratio is becoming a very popular format. When you download this product, the downloaded ZIP will contain this product in both standard and widescreen format.
-

- Some older products that we have may only be in standard format, but they can easily be converted to widescreen.
- To do this, please open the SlideTeam product in Powerpoint, and go to
- Design ( On the top bar) -> Page Setup -> and select "On-screen Show (16:9)” in the drop down for "Slides Sized for".
- The slide or theme will change to widescreen, and all graphics will adjust automatically. You can similarly convert our content to any other desired screen aspect ratio.
Compatible With Google Slides

Get This In WideScreen
You must be logged in to download this presentation.
PowerPoint presentation slides
It has PPT slides covering wide range of topics showcasing all the core areas of your business needs. This complete deck focuses on Private Company Liquidity Options Powerpoint Presentation Slides and consists of professionally designed templates with suitable graphics and appropriate content. This deck has total of sixty three slides. Our designers have created customizable templates for your convenience. You can make the required changes in the templates like colour, text and font size. Other than this, content can be added or deleted from the slide as per the requirement. Get access to this professionally designed complete deck PPT presentation by clicking the download button below.
People who downloaded this PowerPoint presentation also viewed the following :
Content of this Powerpoint Presentation
Slide 1: This slide introduces Private Company Liquidity Options. State Your Company Name and begin.
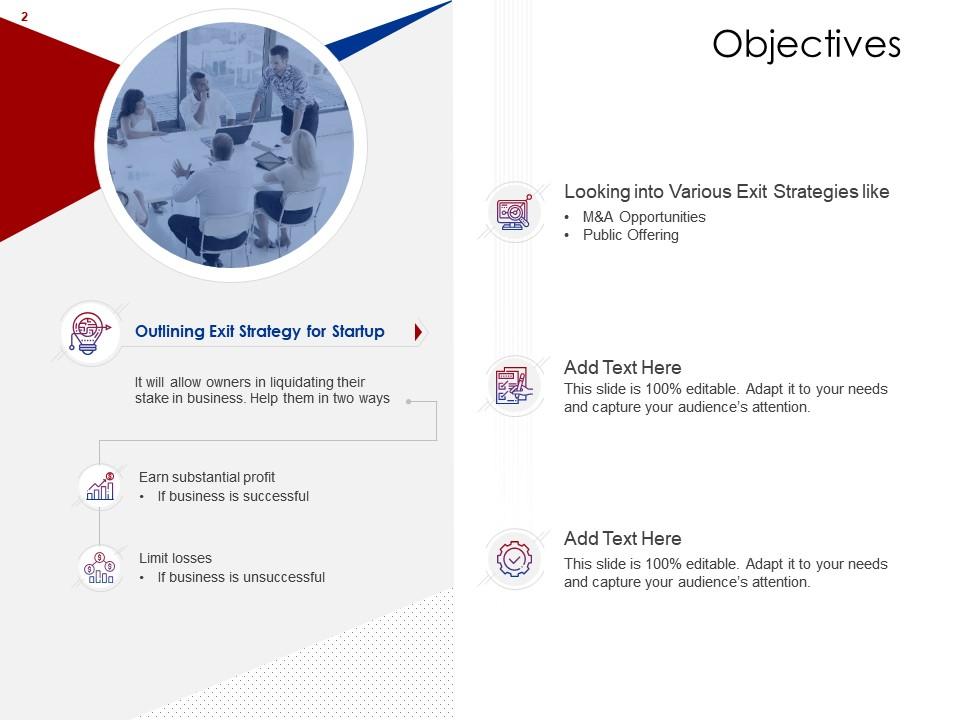
Slide 2: This slide shows Objectives with related imagery.
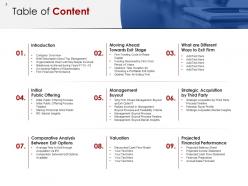
Slide 3: This slide presents Table of Content describing- Introduction, Company Overview, Initial Public Offering, etc.
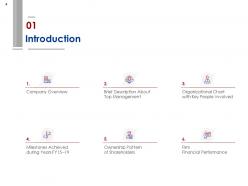
Slide 4: This slide displays Table of Content highlighting Introduction.
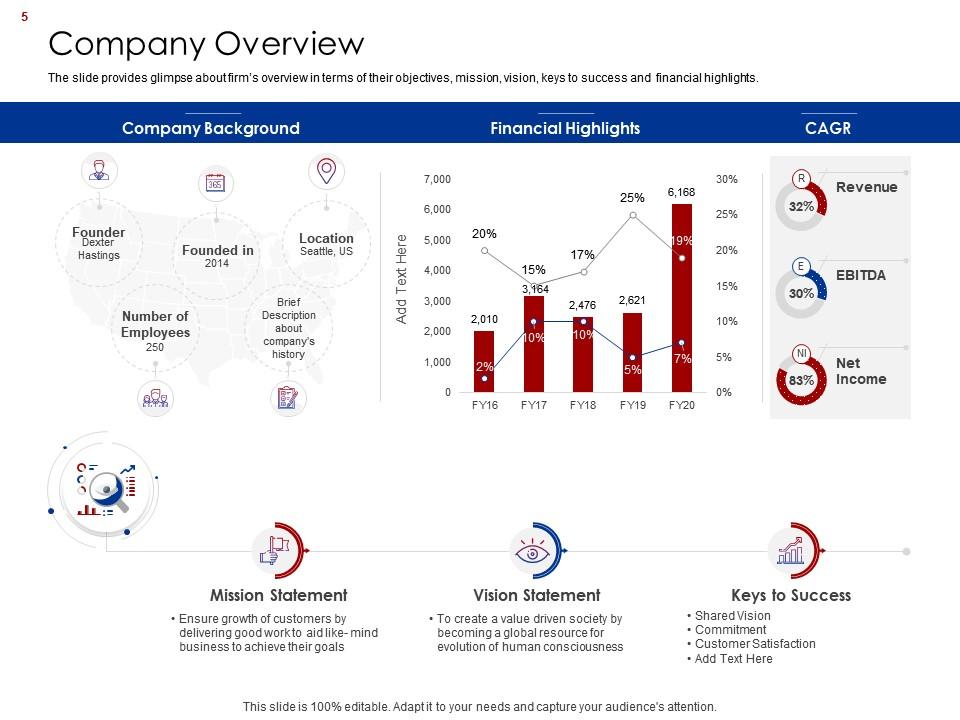
Slide 5: This slide represents glimpse about firm’s overview in terms of their objectives, mission, vision, keys to success and financial highlights.
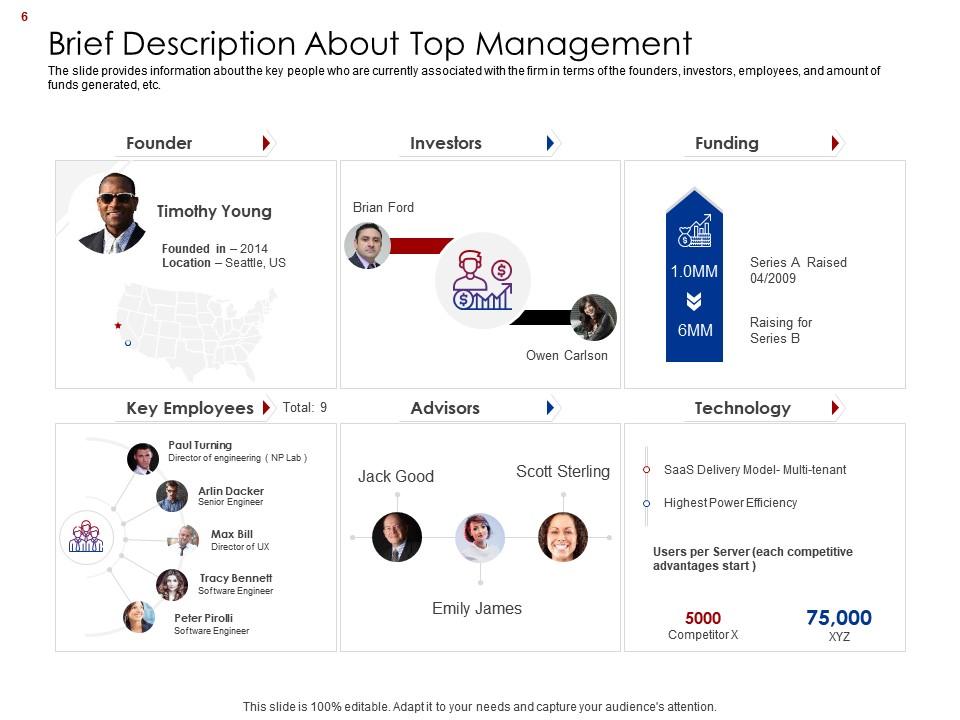
Slide 6: This slide showcases information about the key people who are currently associated with the firm in terms of the founders, investors, employees, and amount of funds generated, etc.
Slide 7: This slide shows Organizational Chart with Key People Involved.
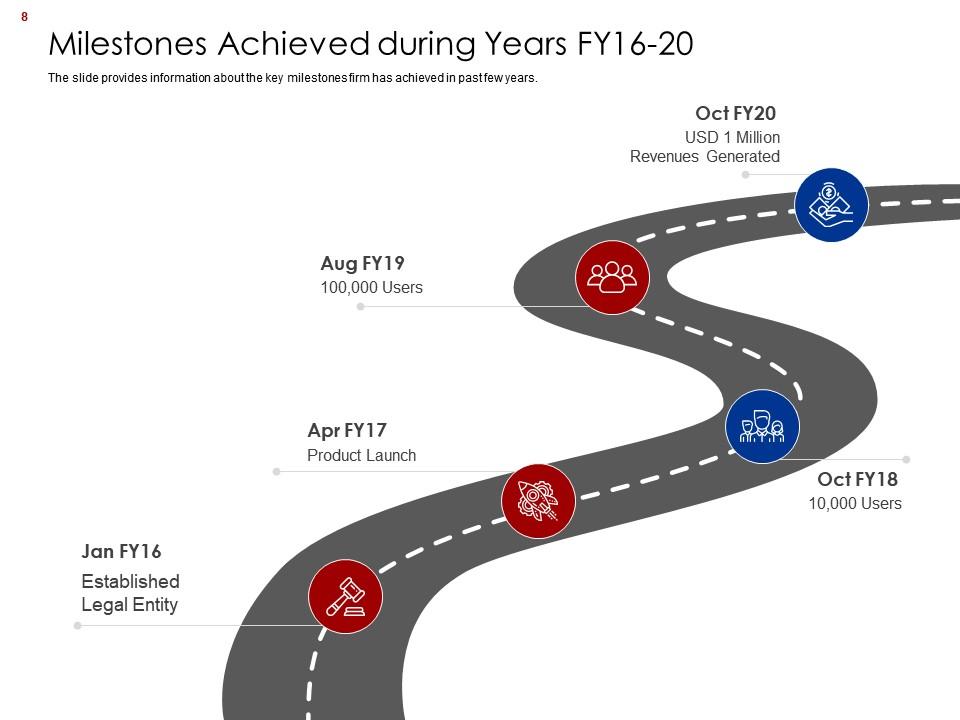
Slide 8: This slide presents information about the key milestones firm has achieved in past few years.
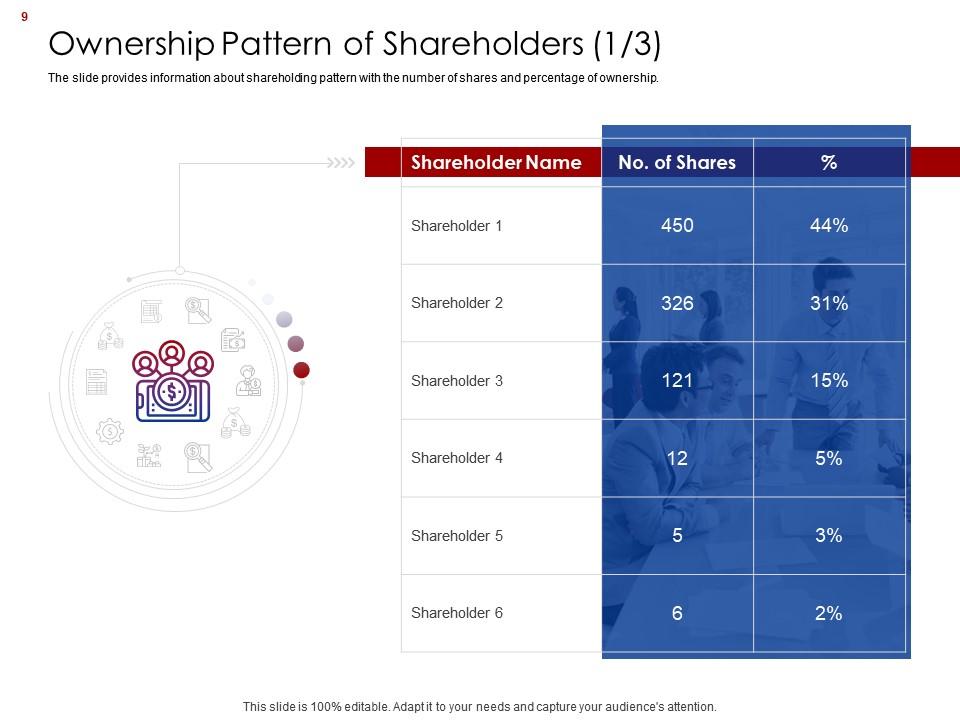
Slide 9: This slide displays Ownership Pattern of Shareholders.
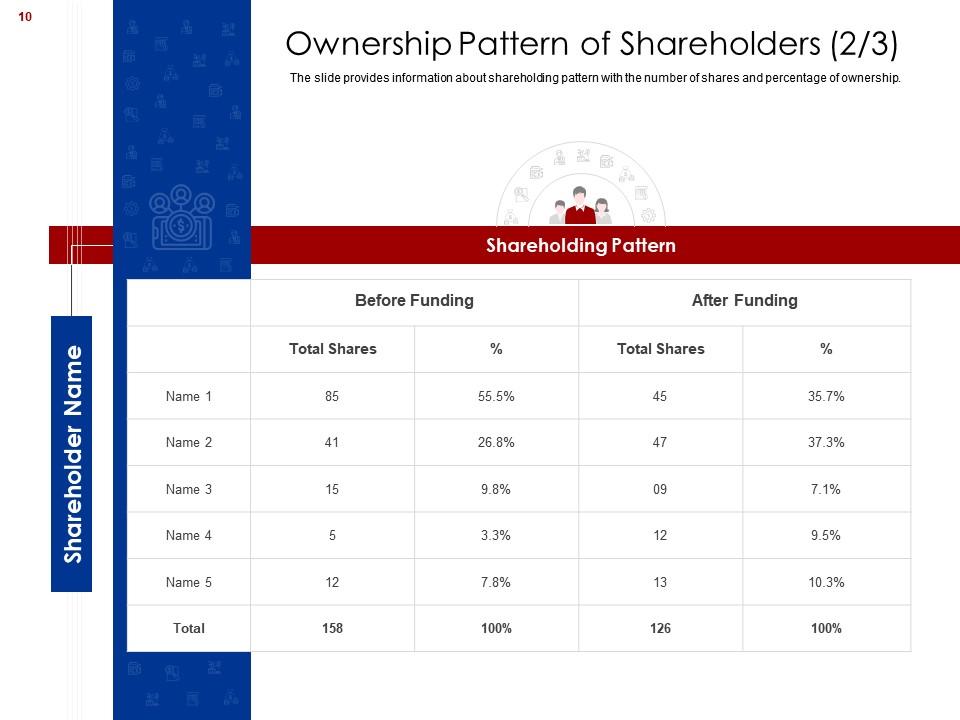
Slide 10: This slide represents information about shareholding pattern with the number of shares and percentage of ownership.
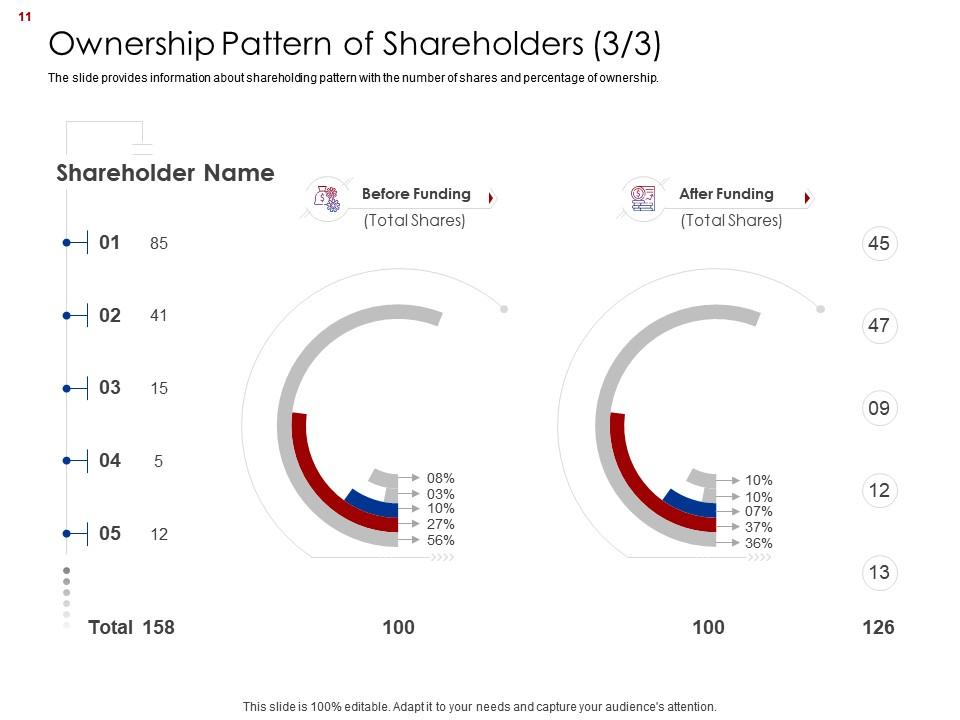
Slide 11: This is another slide showing Ownership Pattern of Shareholders (3/3)
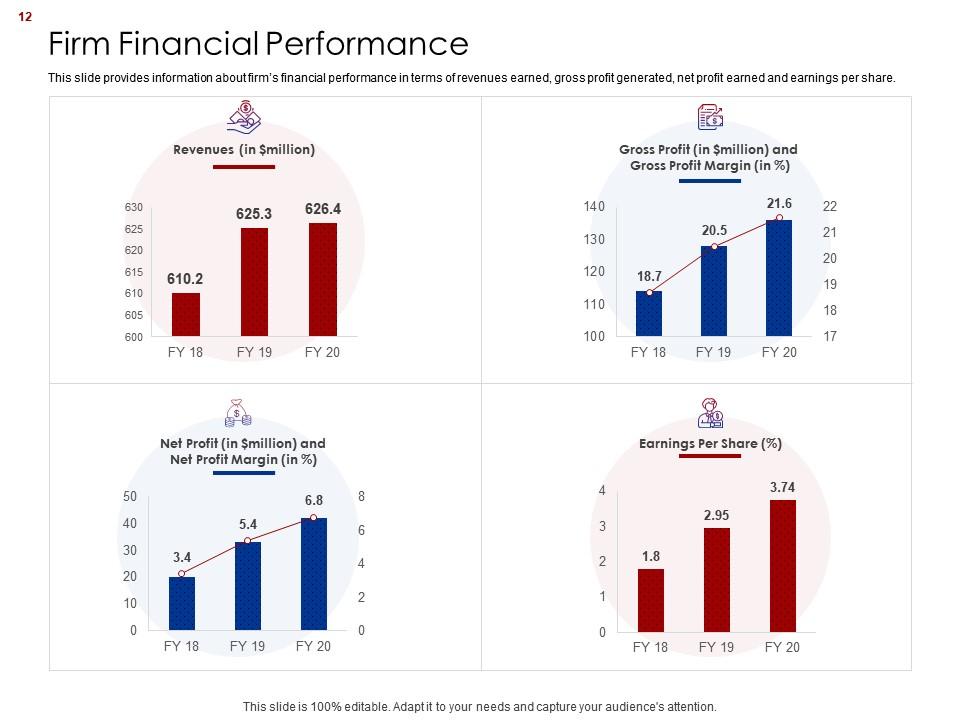
Slide 12: This slide showcases firm’s financial performance in terms of revenues earned, gross profit generated, net profit earned and earnings per share.
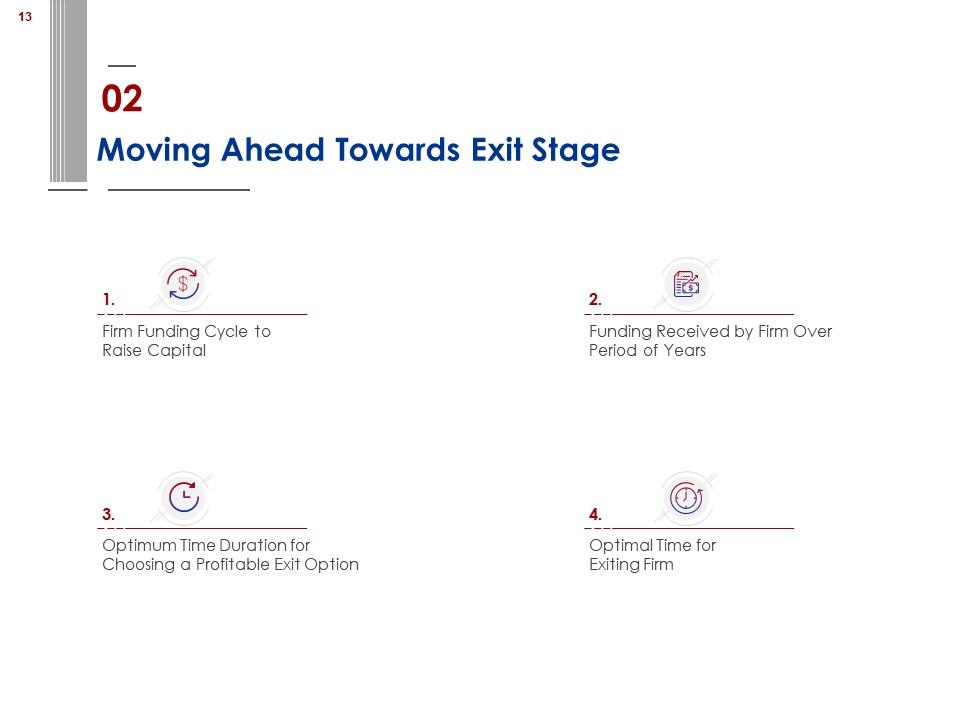
Slide 13: This slide shows Moving Ahead Towards Exit Stage.
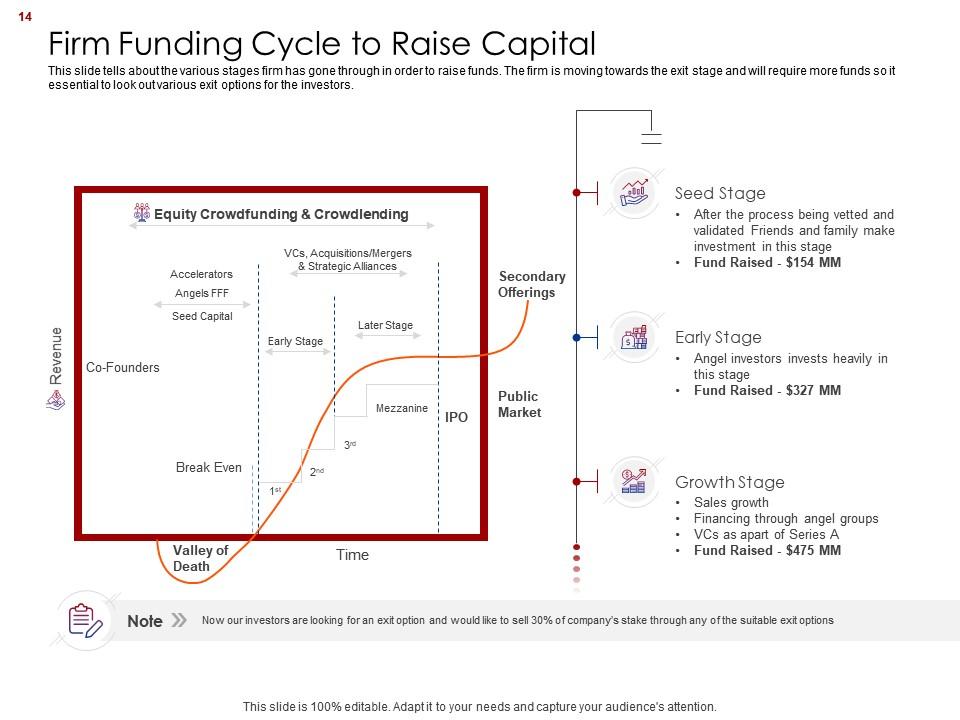
Slide 14: This slide presents Firm Funding Cycle to Raise Capital.
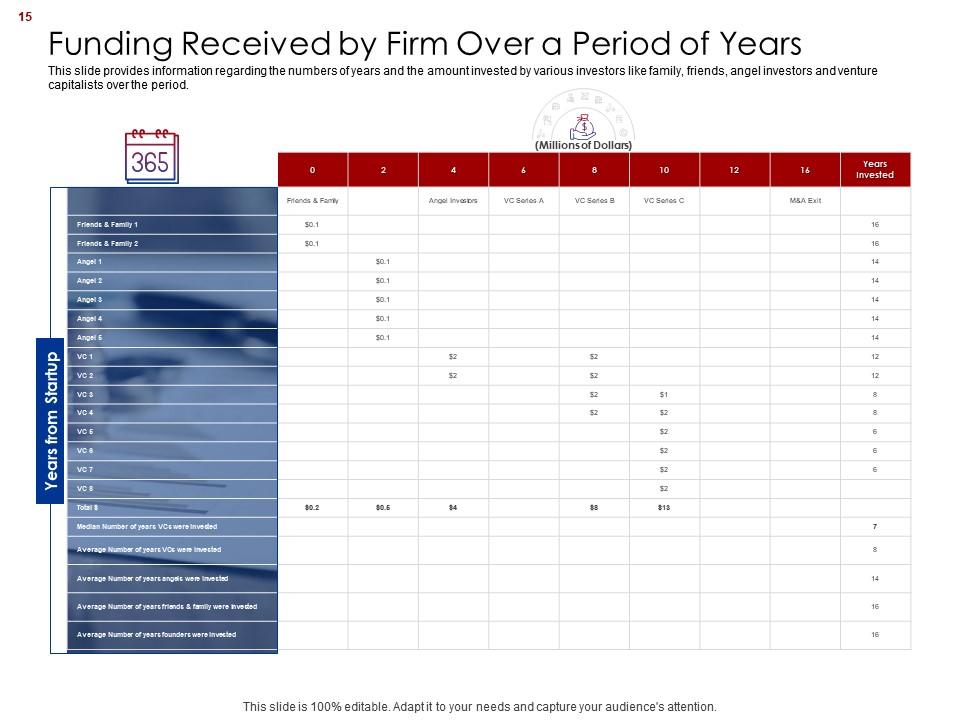
Slide 15: This slide displays Funding Received by Firm Over a Period of Years.
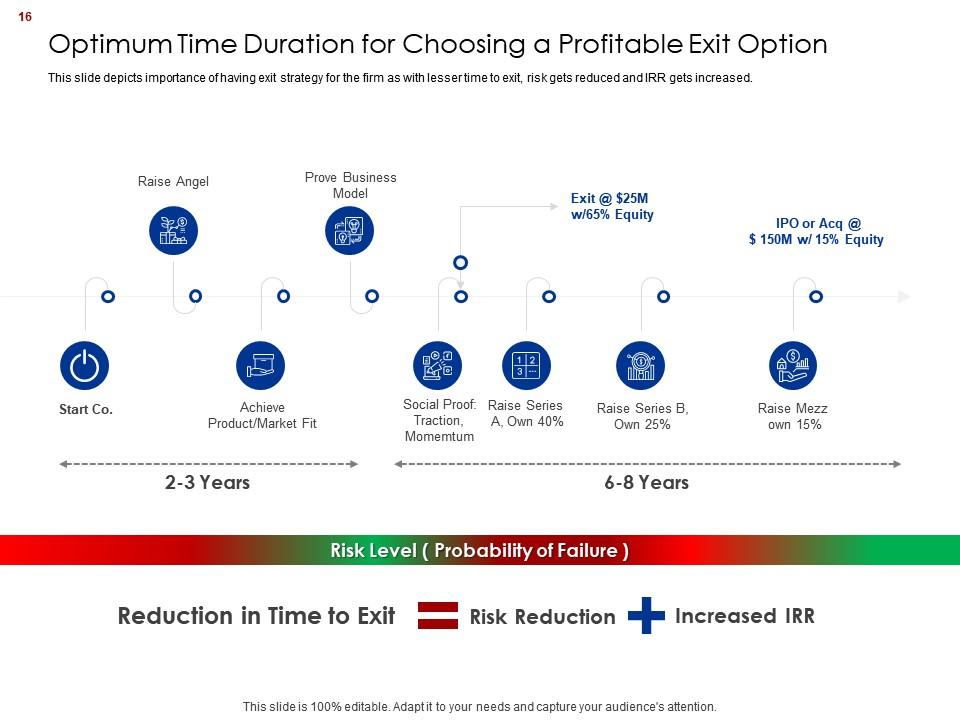
Slide 16: This slide represents Optimum Time Duration for Choosing a Profitable Exit Option.
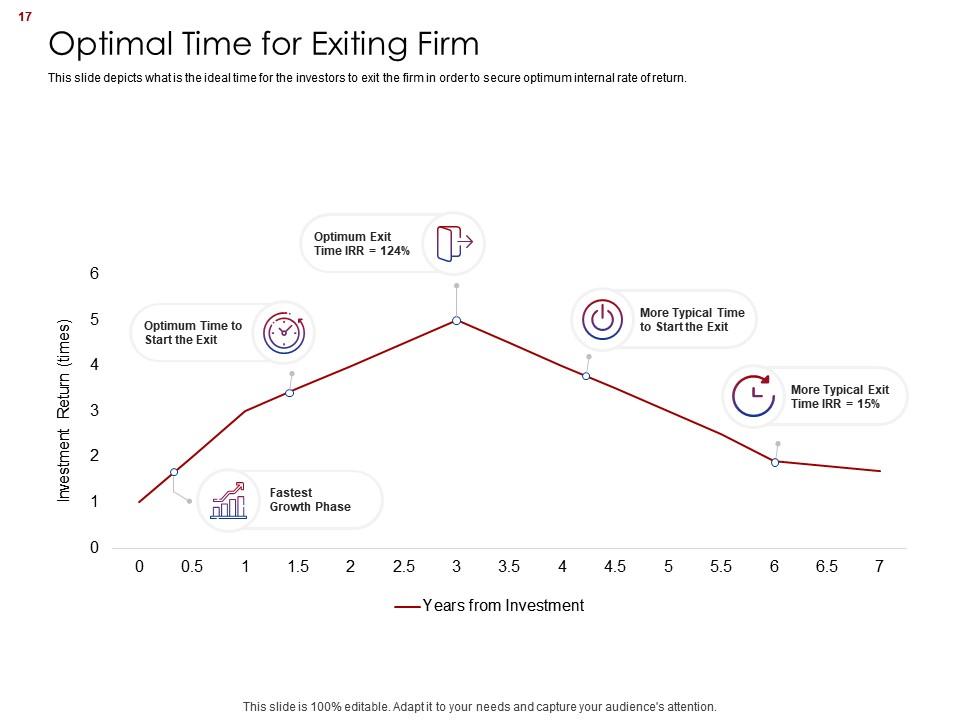
Slide 17: This slide showcases ideal time for the investors to exit the firm in order to secure optimum internal rate of return.
Slide 18: This slide shows What are Different Ways to Exit Firm.
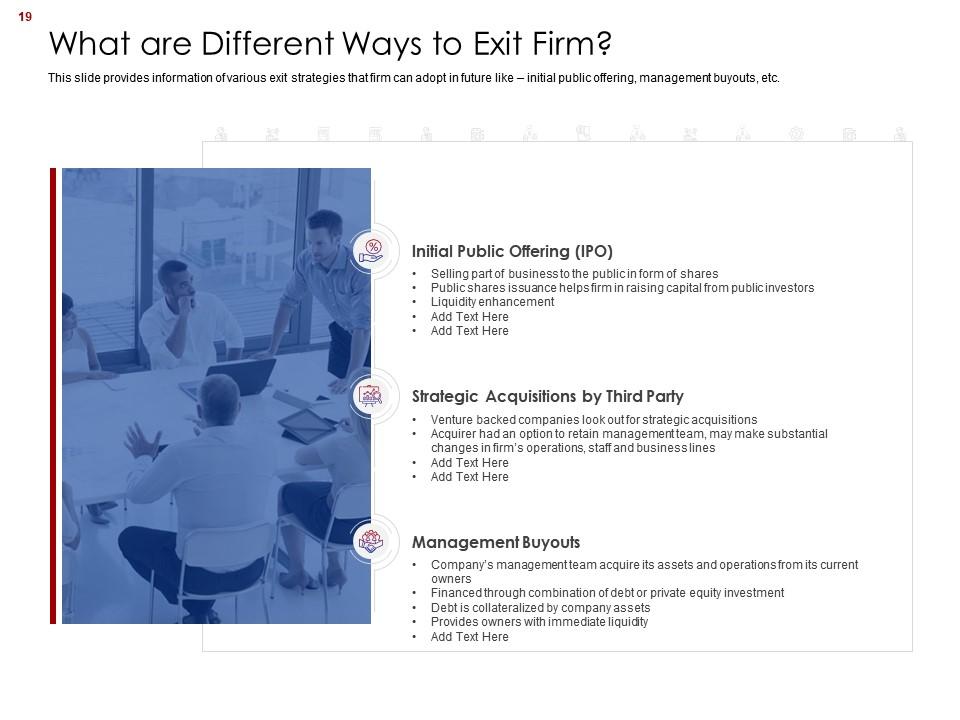
Slide 19: This slide presents various exit strategies that firm can adopt in future like – initial public offering, management buyouts, etc.
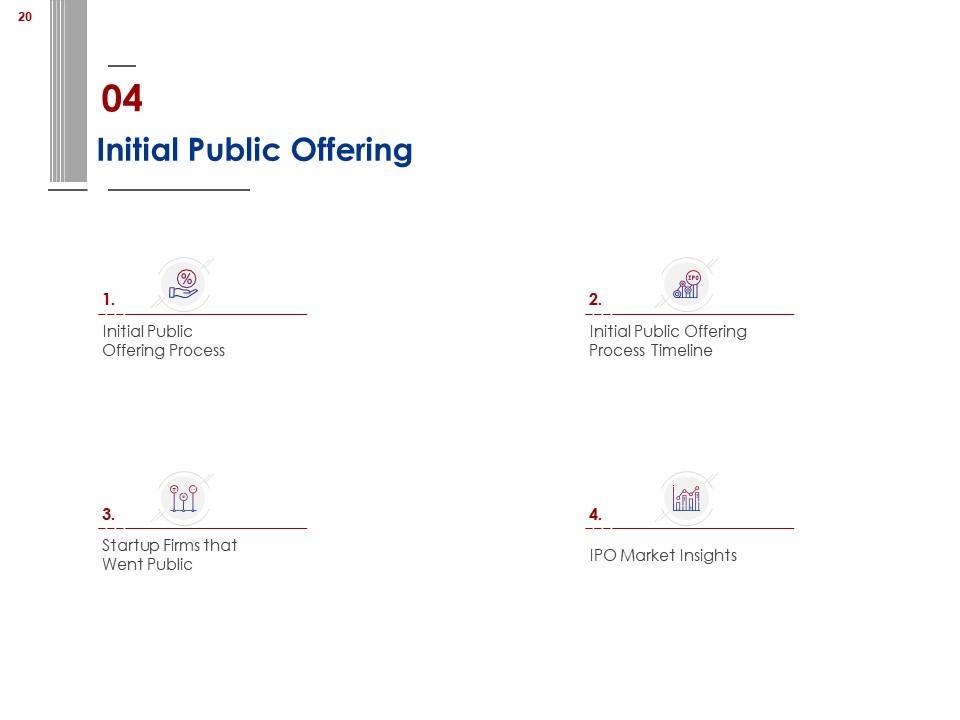
Slide 20: This slide displays Initial Public Offering with related imagery.
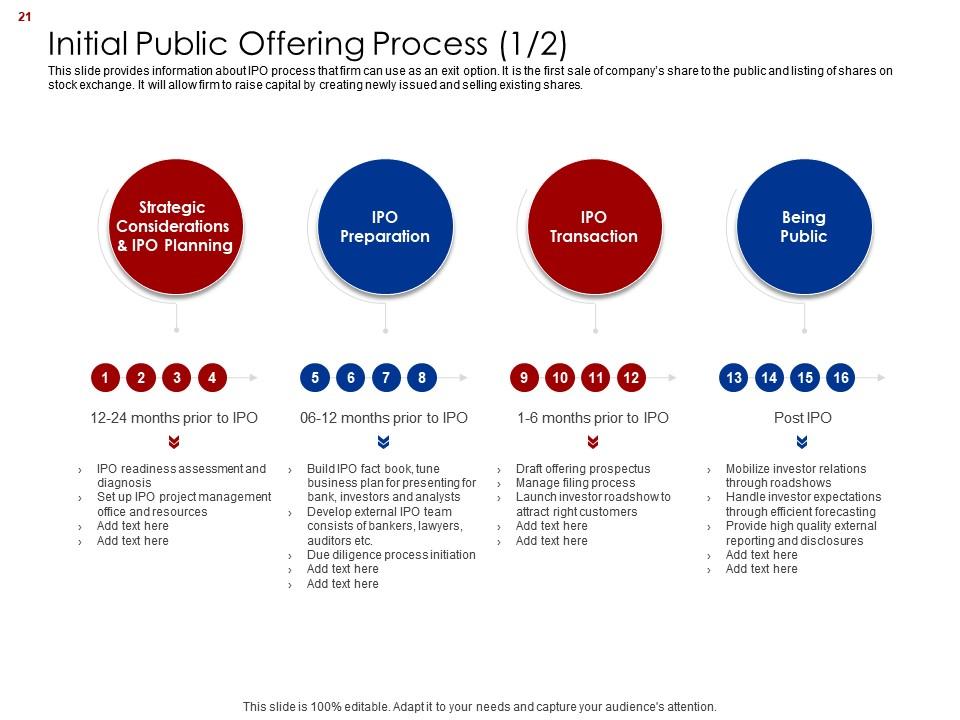
Slide 21: This slide represents IPO process that firm can use as an exit option.
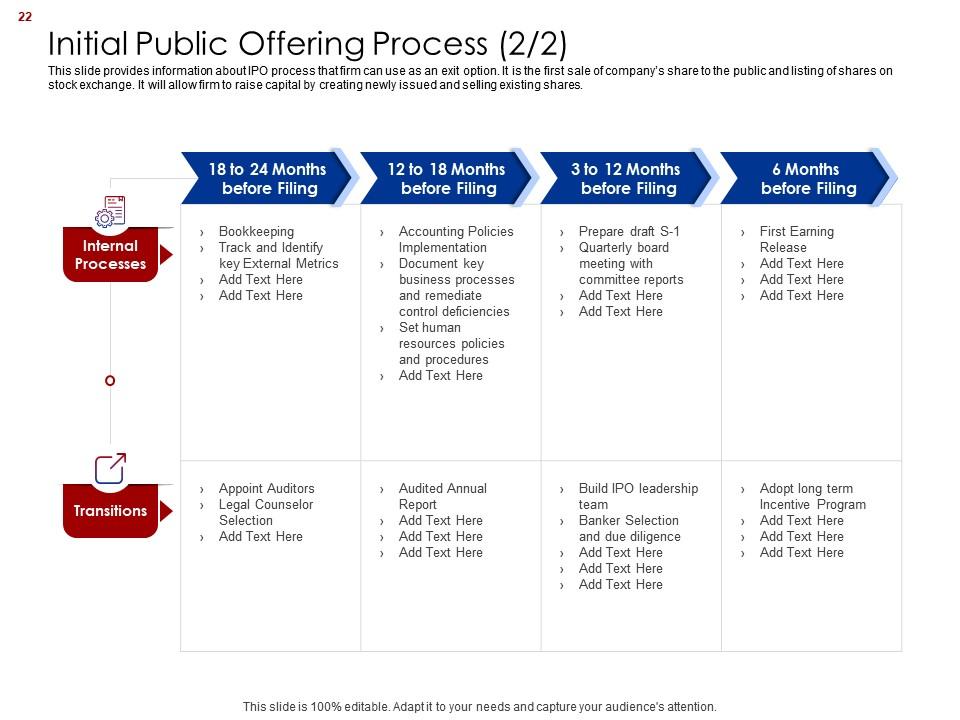
Slide 22: This slide showcases information about IPO process that firm can use as an exit option.
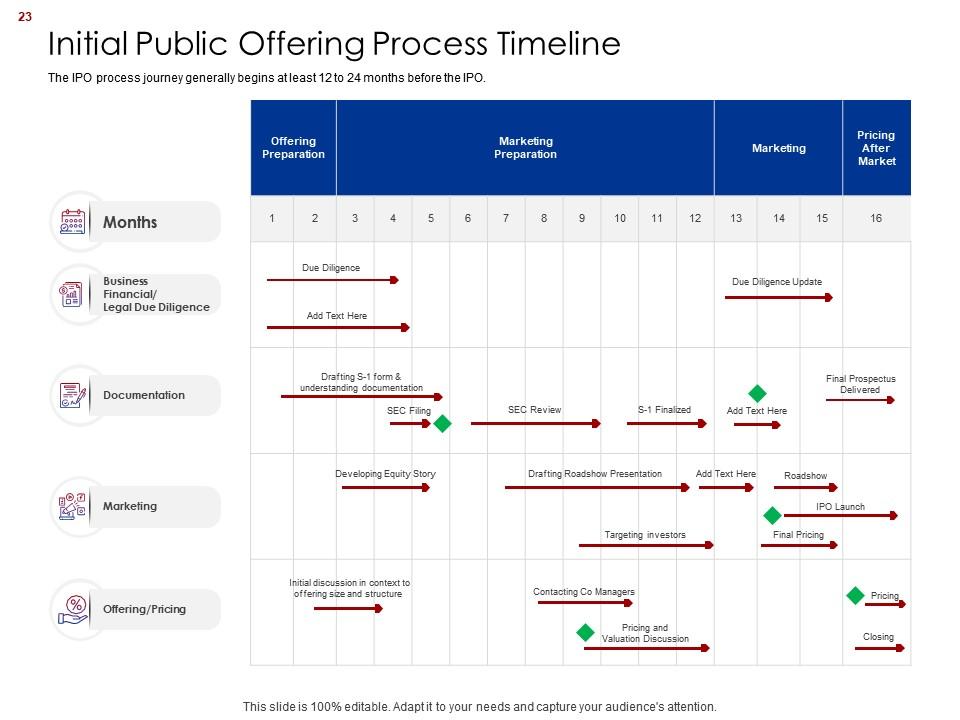
Slide 23: This slide shows Initial Public Offering Process Timeline.
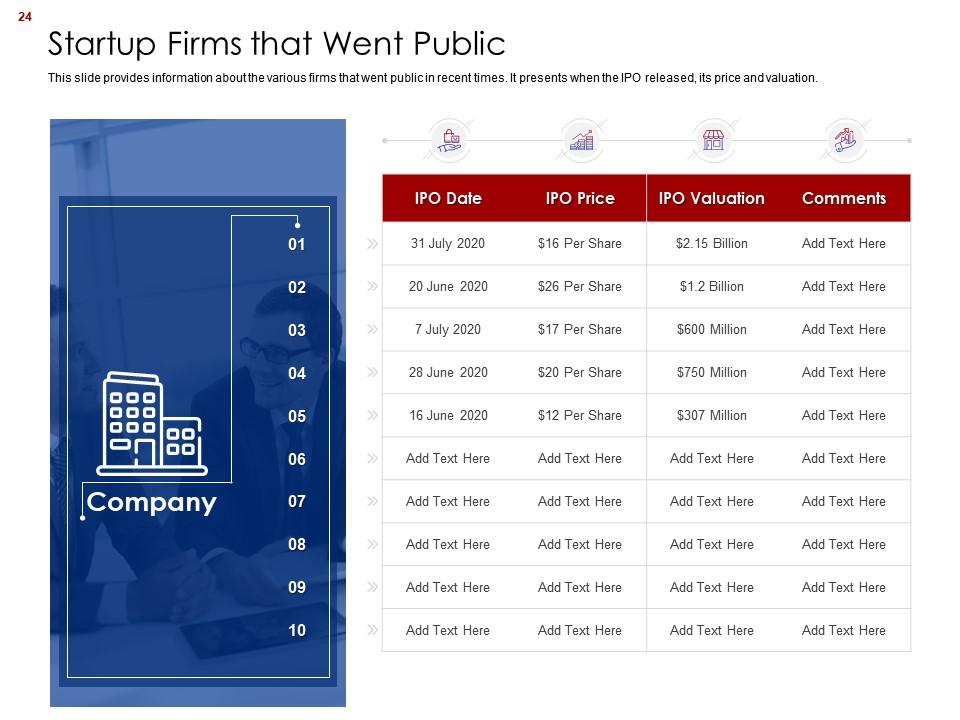
Slide 24: This slide presents Startup Firms that Went Public.
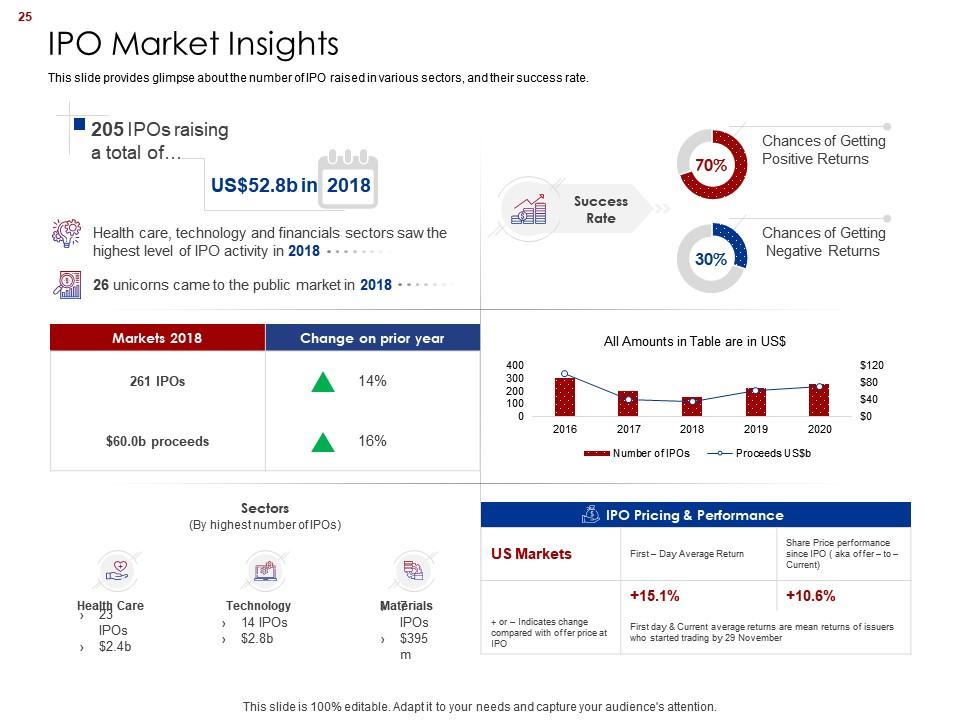
Slide 25: This slide displays number of IPO raised in various sectors, and their success rate.
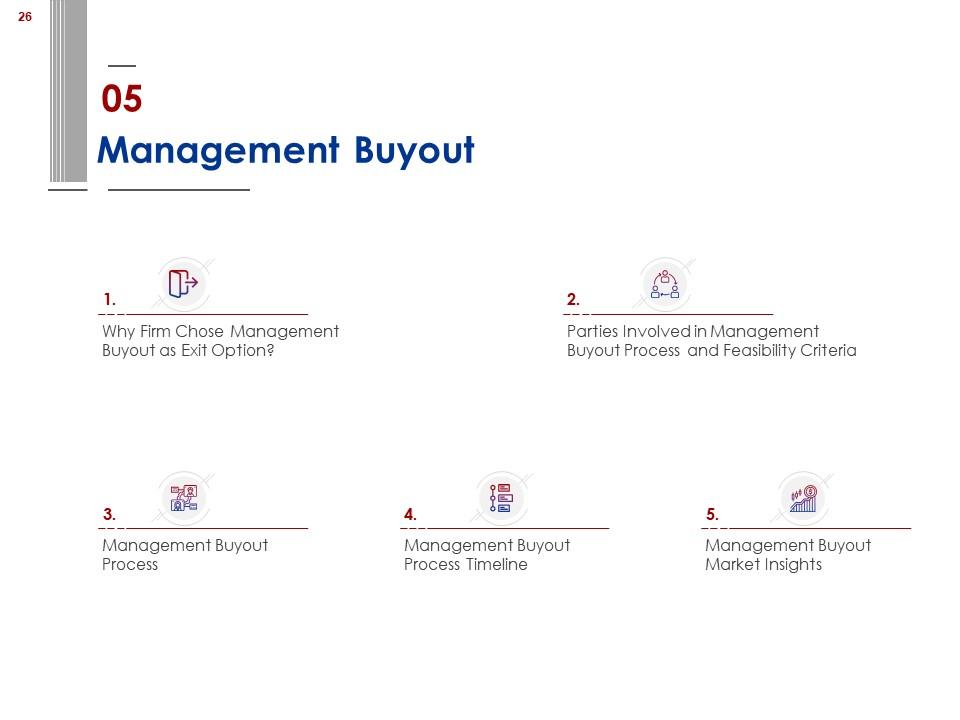
Slide 26: This slide represents Management Buyout describing- Management Buyout Process, Management Buyout Process Timeline, Management Buyout Market Insights, etc.
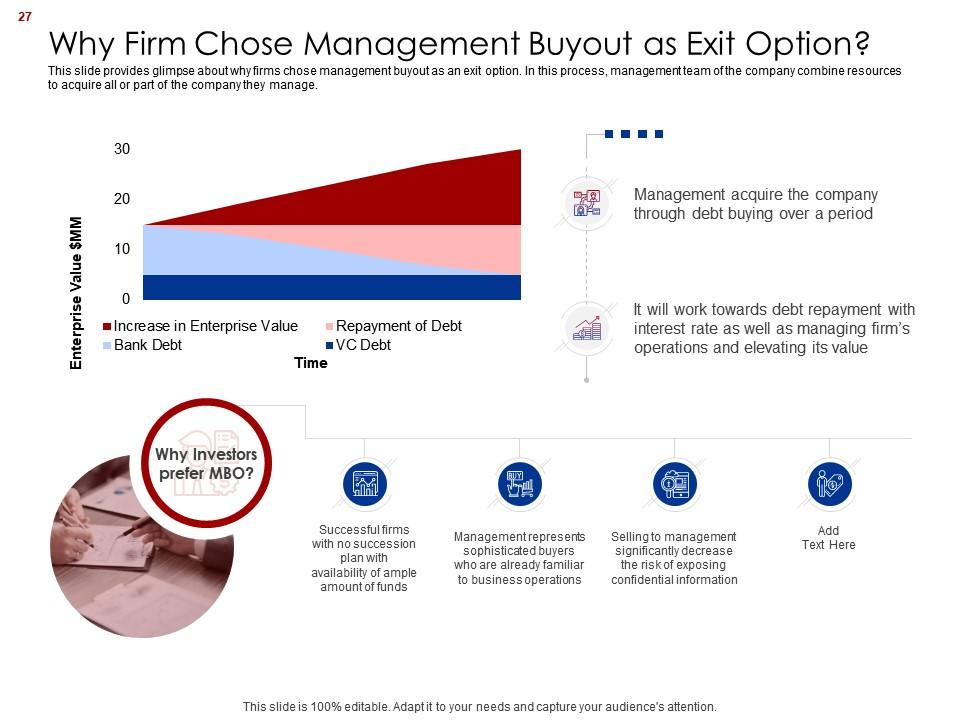
Slide 27: This slide showcases Why Firm Chose Management Buyout as Exit Option.
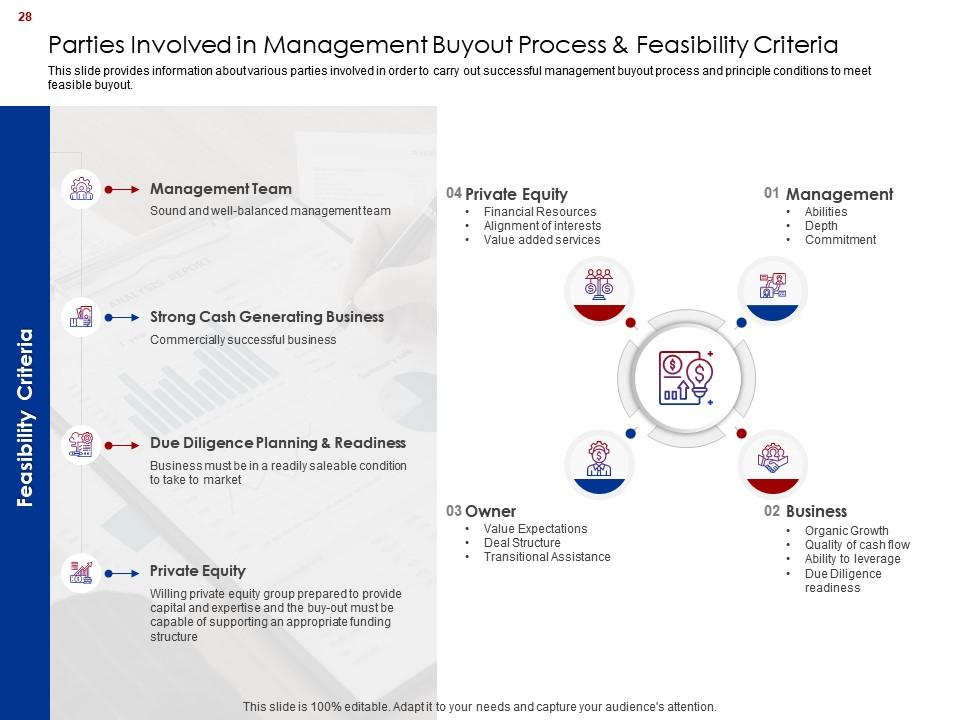
Slide 28: This slide shows Parties Involved in Management Buyout Process & Feasibility Criteria.
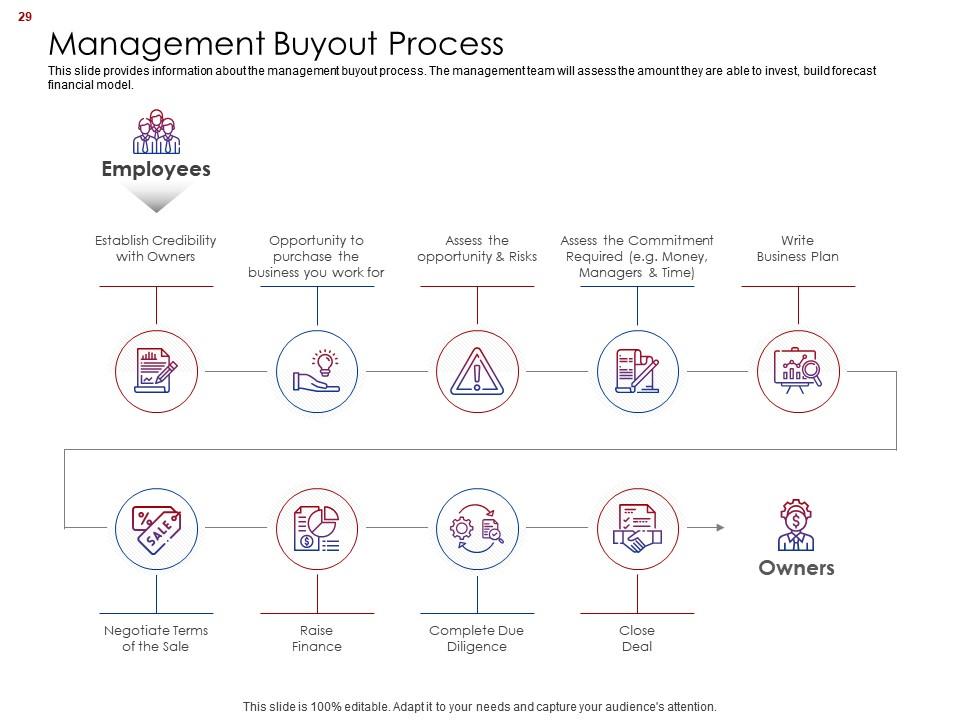
Slide 29: This slide presents information about the management buyout process.
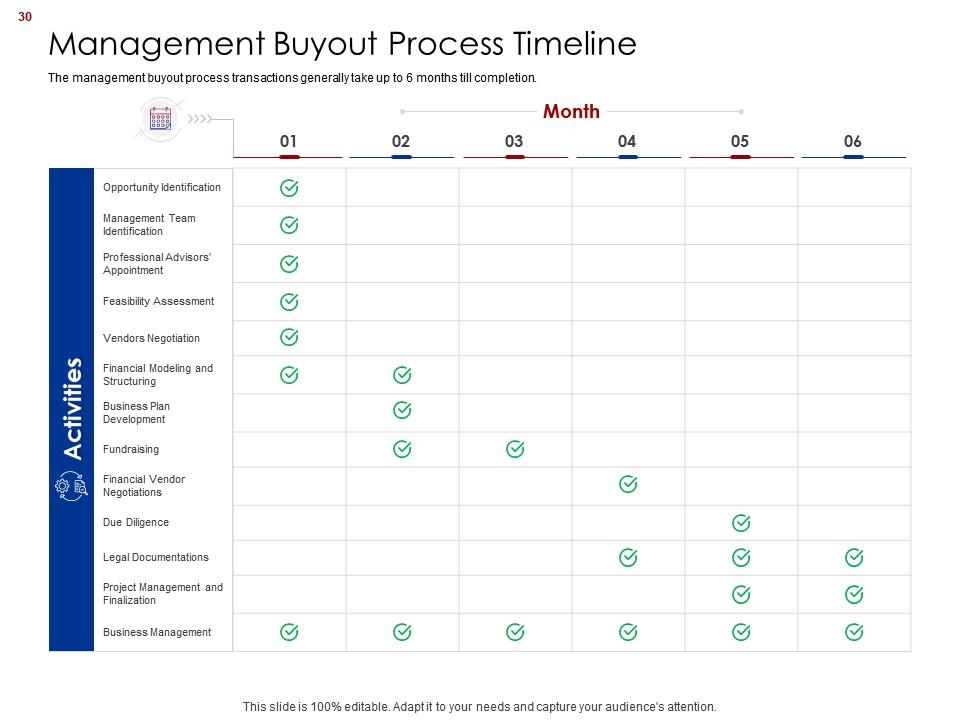
Slide 30: This slide displays Management Buyout Process Timeline.
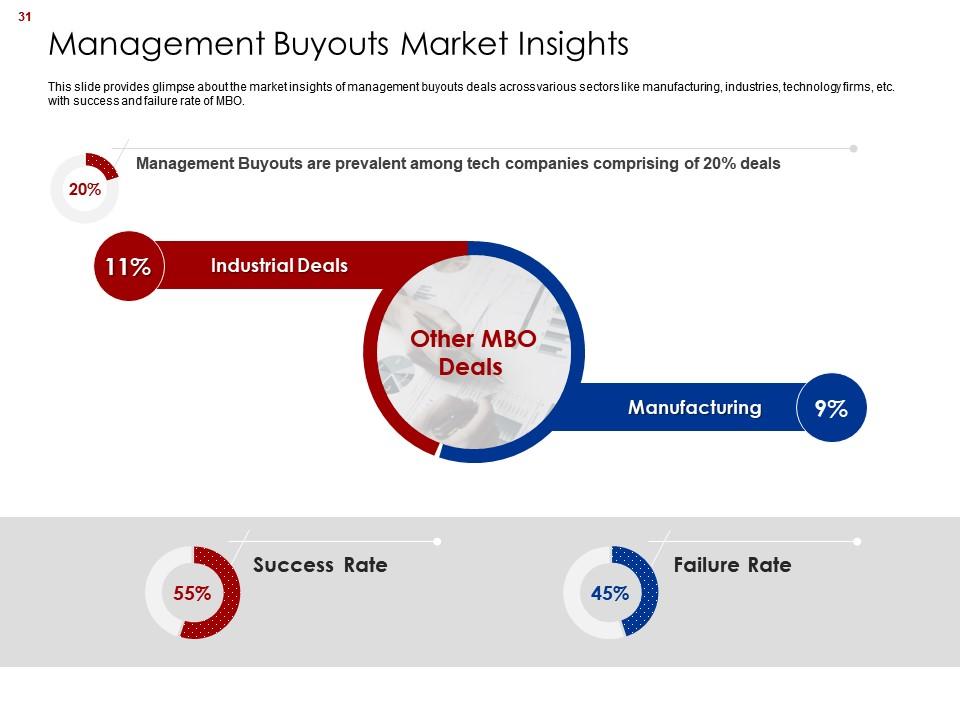
Slide 31: This slide represents glimpse about the market insights of management buyouts deals across various sectors like manufacturing, industries, technology firms, etc.
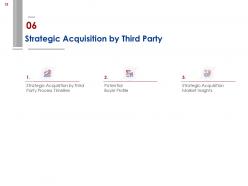
Slide 32: This slide showcases Table of Content highlighting Strategic Acquisition by Third Party Process Timeline.
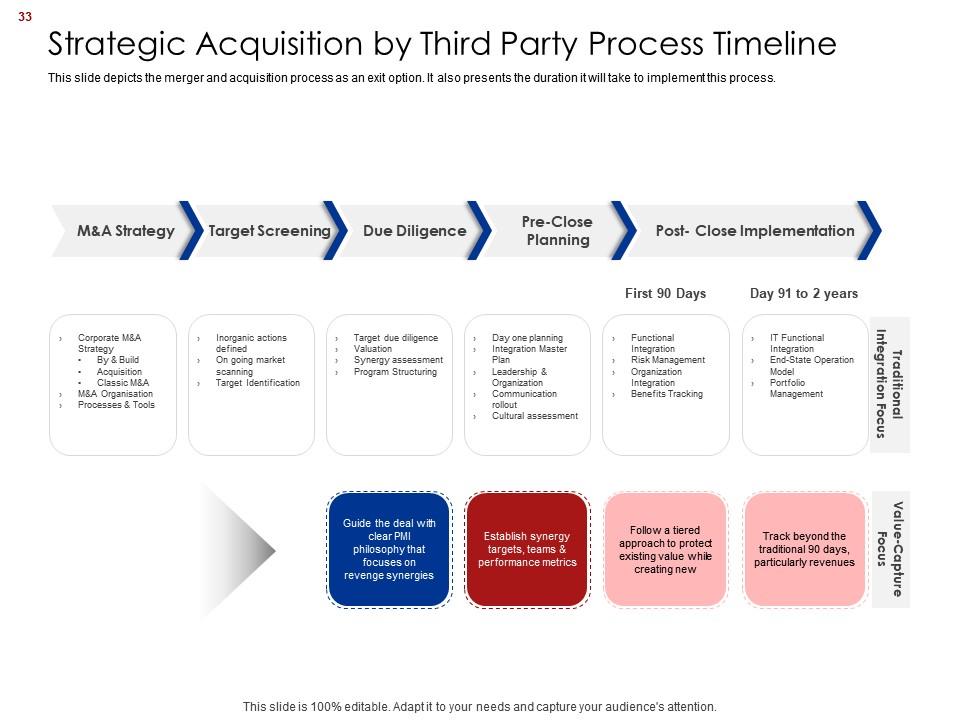
Slide 33: This slide shows Strategic Acquisition by Third Party Process Timeline.
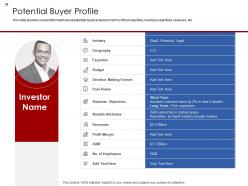
Slide 34: This slide presents potential buyer in terms of their expertise, business objectives, revenues. etc.
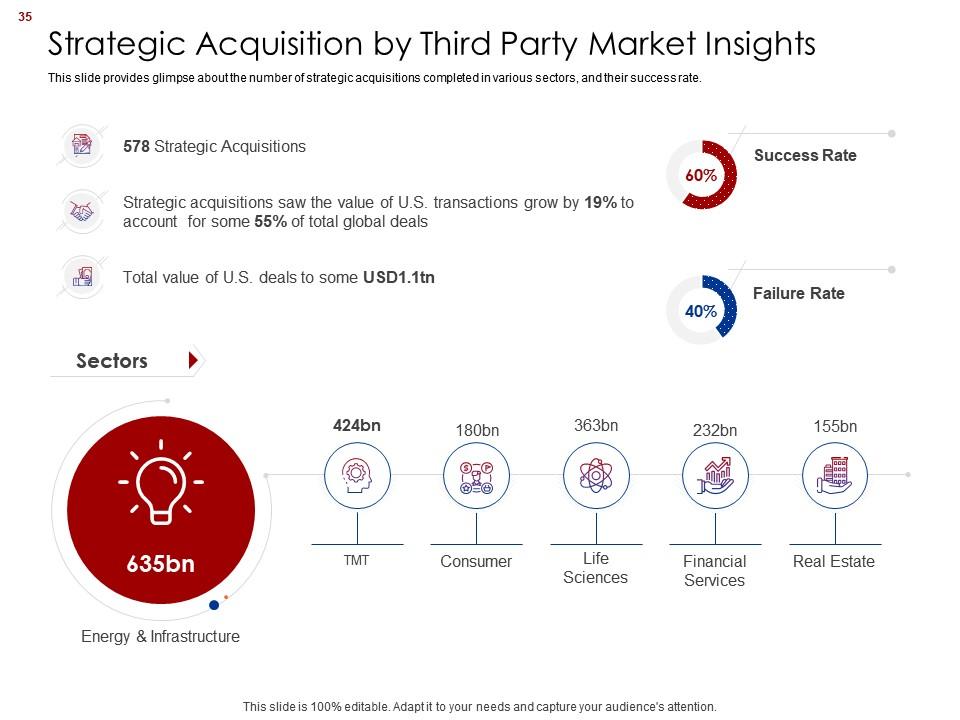
Slide 35: This slide displays Strategic Acquisition by Third Party Market Insights.
Slide 36: This slide represents Table of Content highlighting Comparative Analysis Between Exit Options
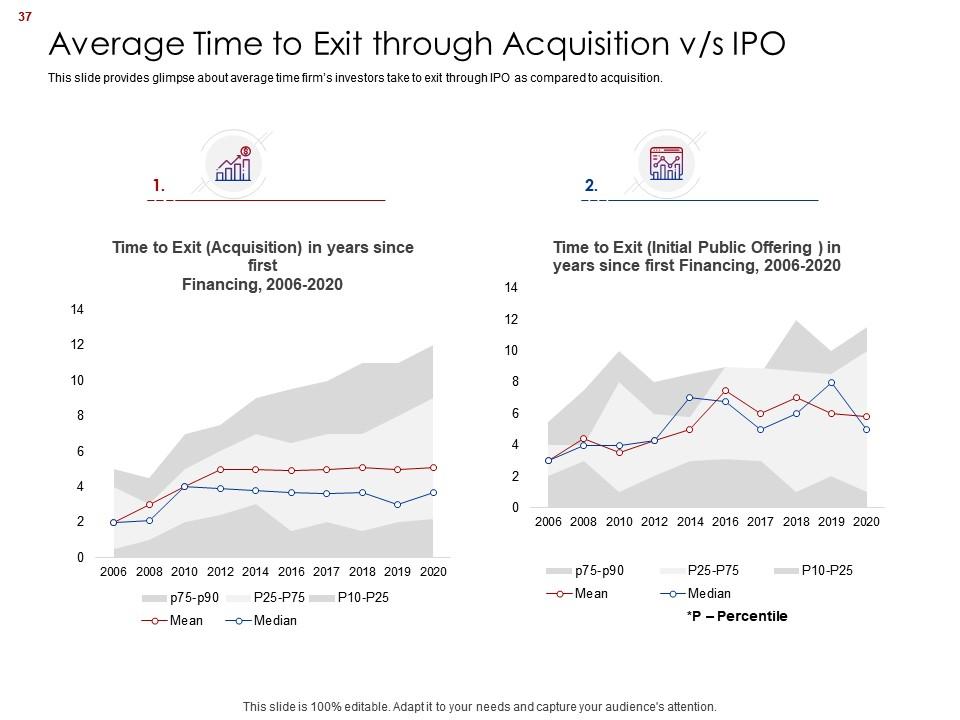
Slide 37: This slide showcases Average Time to Exit through Acquisition v/s IPO.
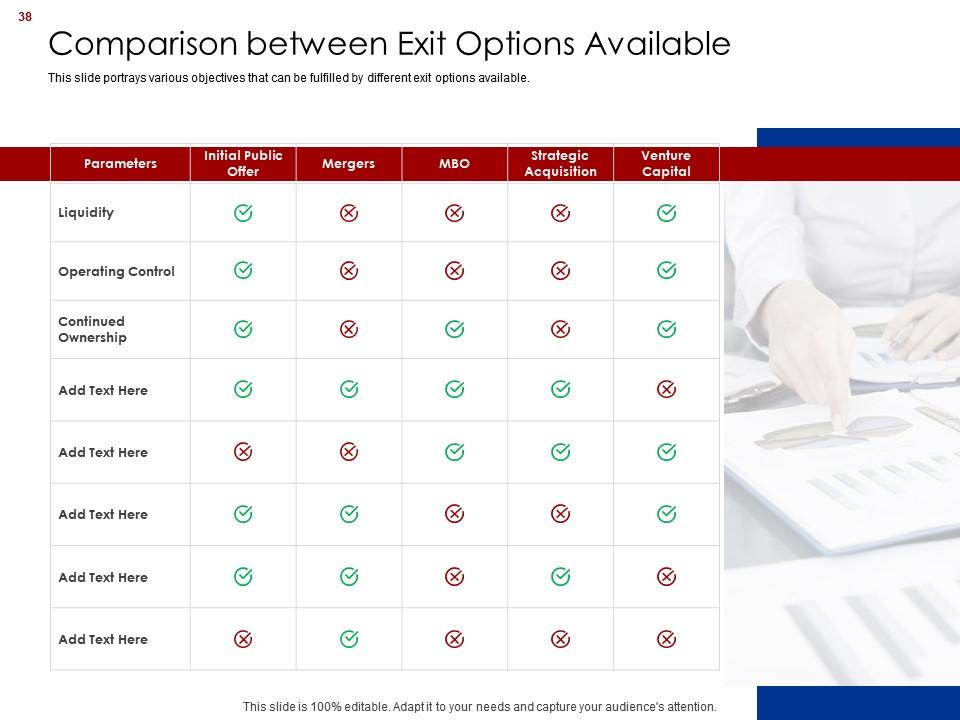
Slide 38: This slide shows Comparison between Exit Options Available.
Slide 39: This slide presents Table of Content highlighting Valuation.
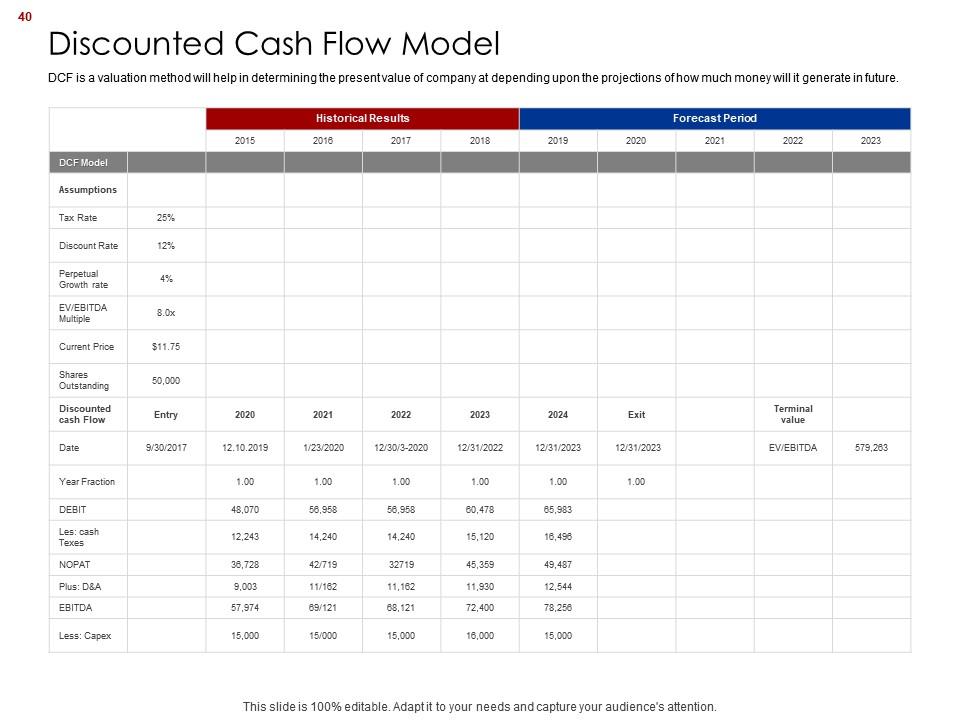
Slide 40: This slide displays Discounted Cash Flow Model.
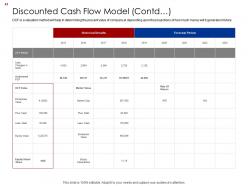
Slide 41: This is another slide continuing Discounted Cash Flow Model.
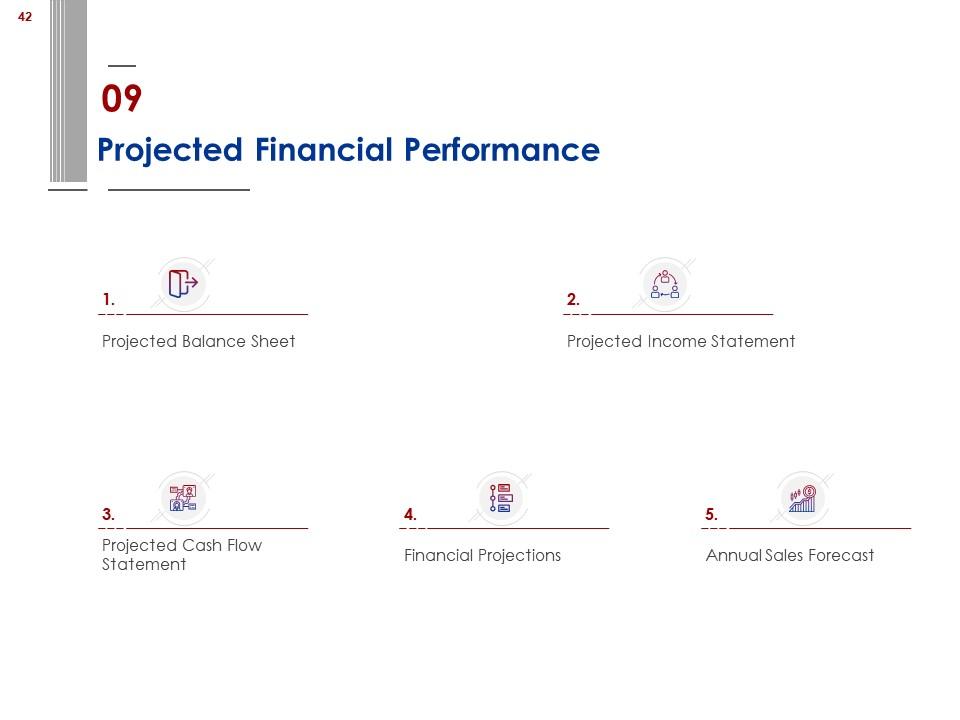
Slide 42: This slide shows Table of Content highlighting Projected Financial Performance.
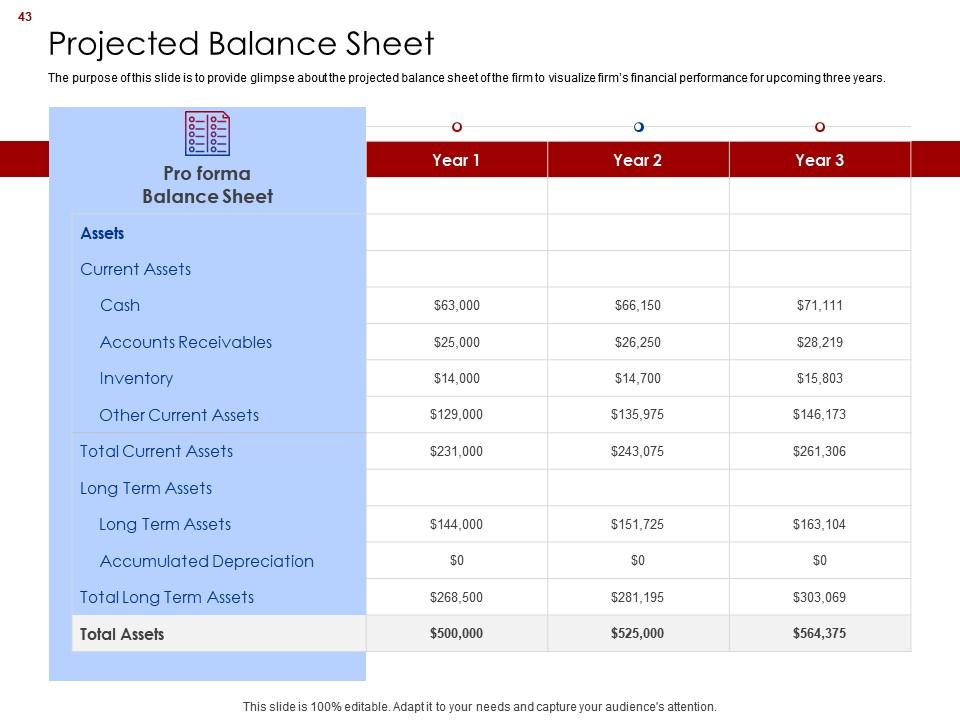
Slide 43: This slide showcases projected balance sheet of the firm to visualize firm’s financial performance for upcoming three years.
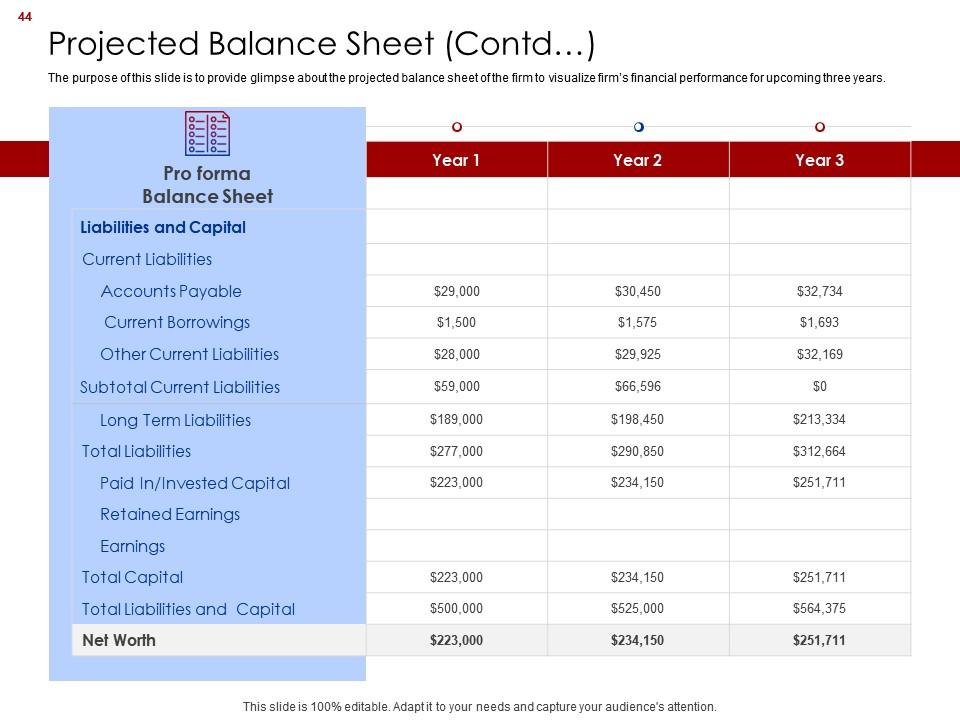
Slide 44: This is another slide continuing Projected Balance Sheet.
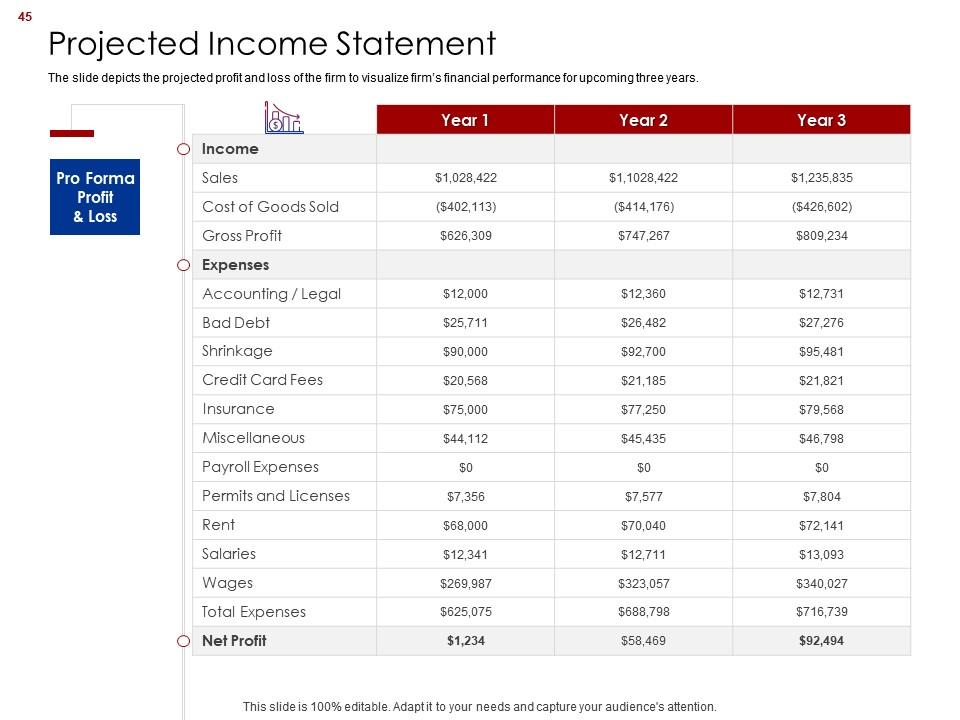
Slide 45: This slide shows Projected Income Statement.
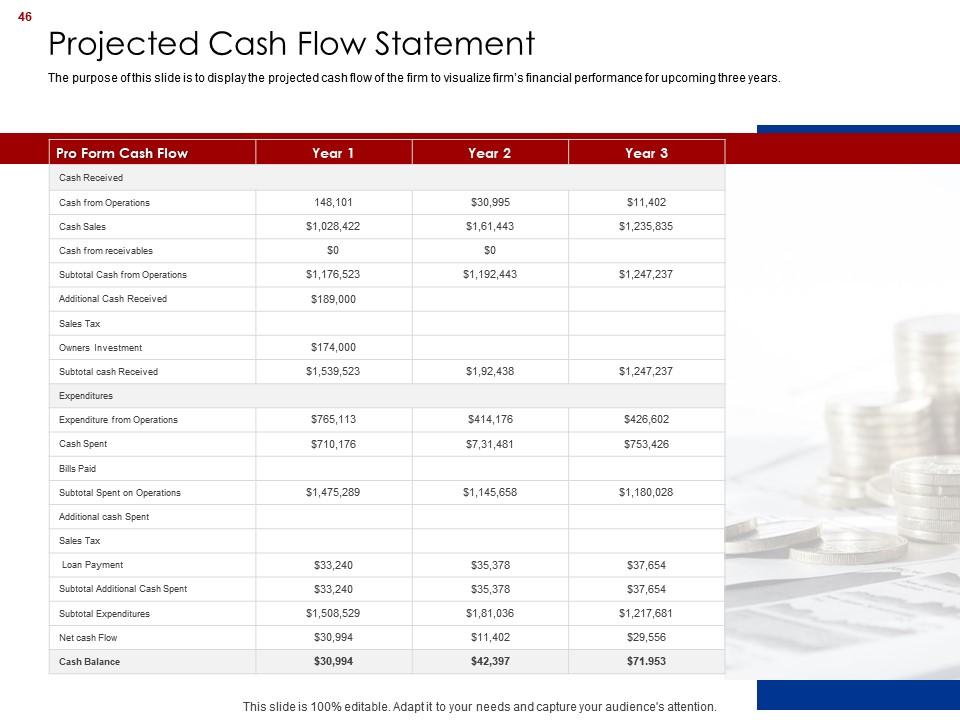
Slide 46: This slide presents projected cash flow of the firm to visualize firm’s financial performance for upcoming three years.
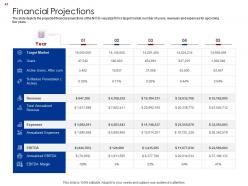
Slide 47: This slide displays projected financial projections of the firm to visualize firm’s target market, number of users, revenues, etc.
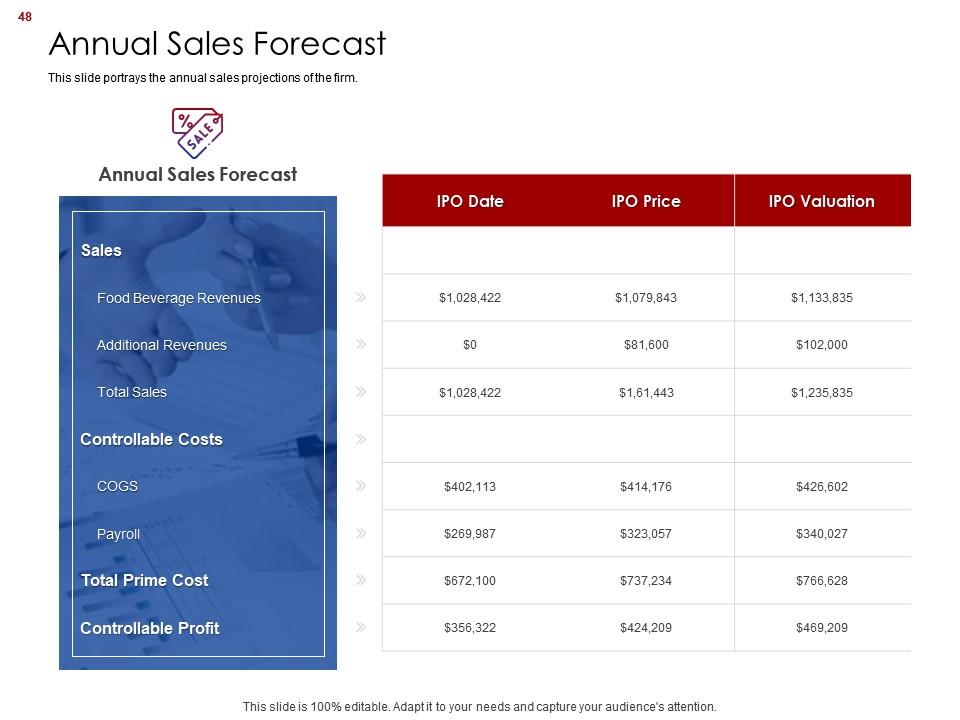
Slide 48: This slide represents the annual sales projections of the firm.
Slide 49: This slide showcases Private Company Liquidity Options Icons.
Slide 50: This slide is titled as Additional Slides for moving forward.
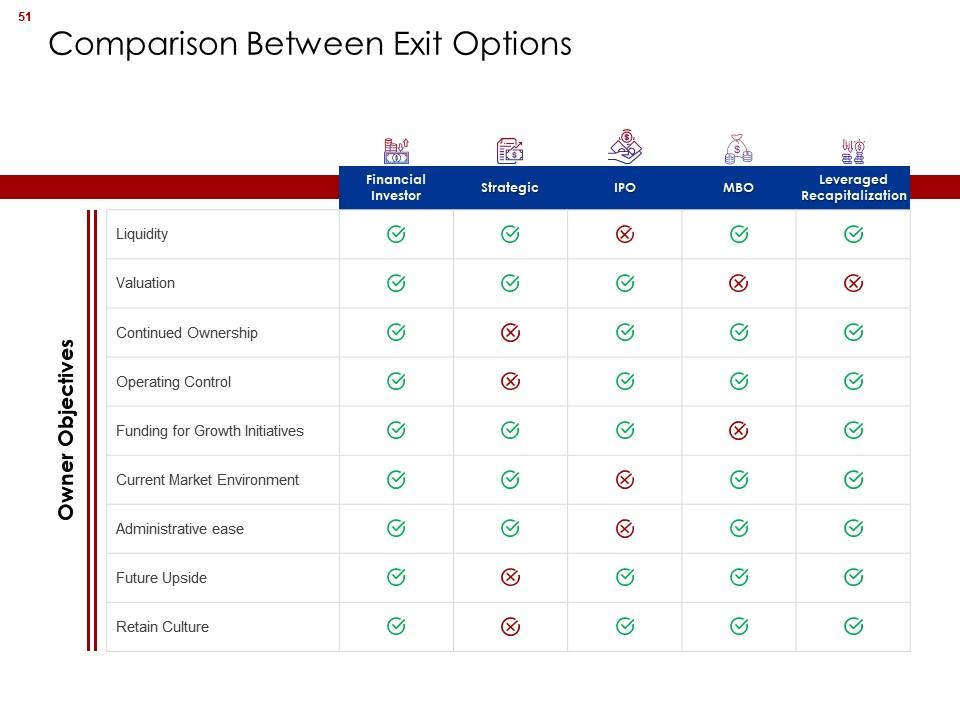
Slide 51: This slide shows Comparison Between Exit Options.
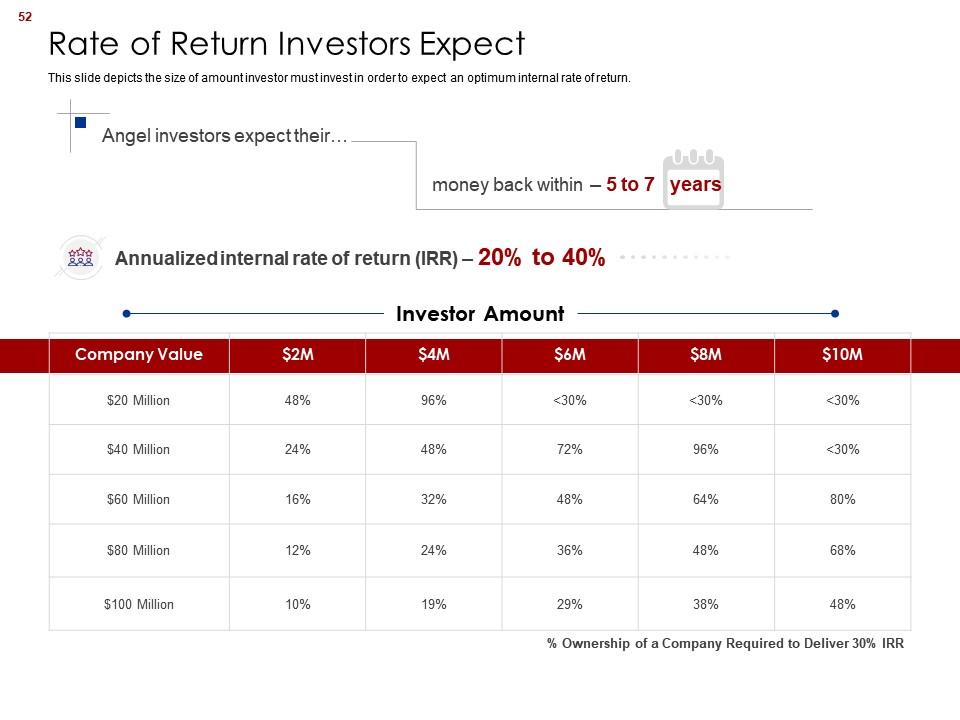
Slide 52: This slide presents size of amount investor must invest in order to expect an optimum internal rate of return.
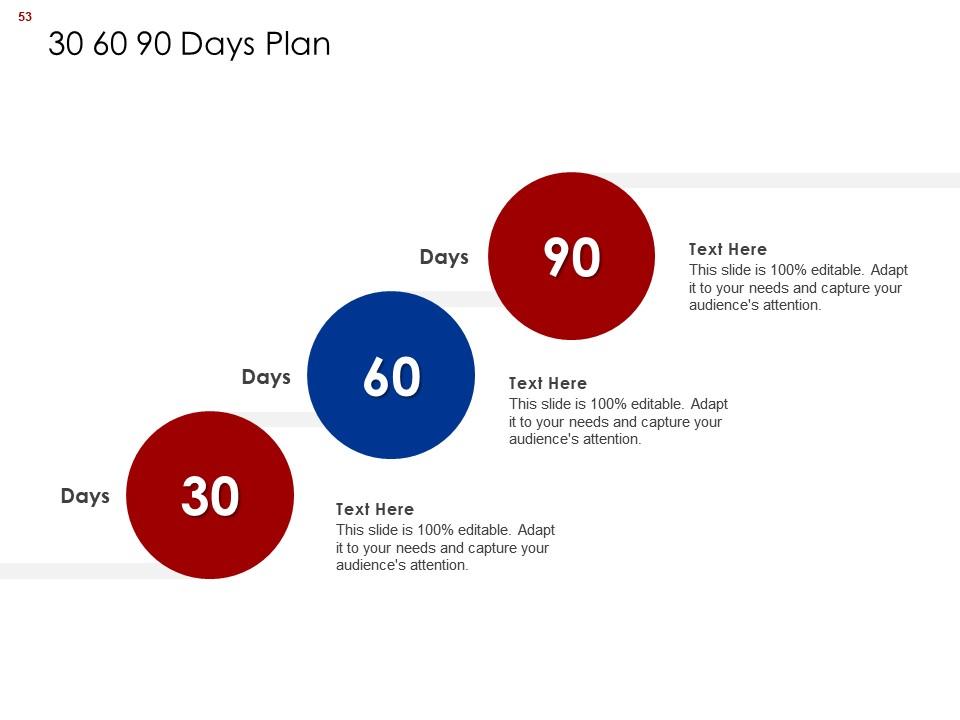
Slide 53: This slide displays 30 60 90 Days Plan with text boxes.
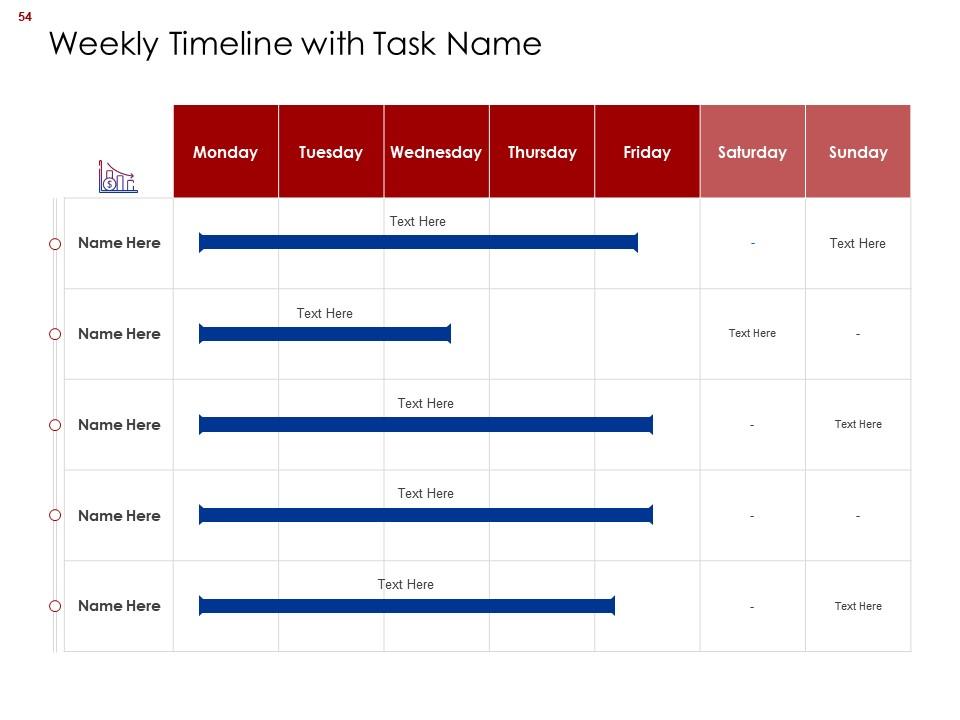
Slide 54: This slide represents Weekly Timeline with Task Name.
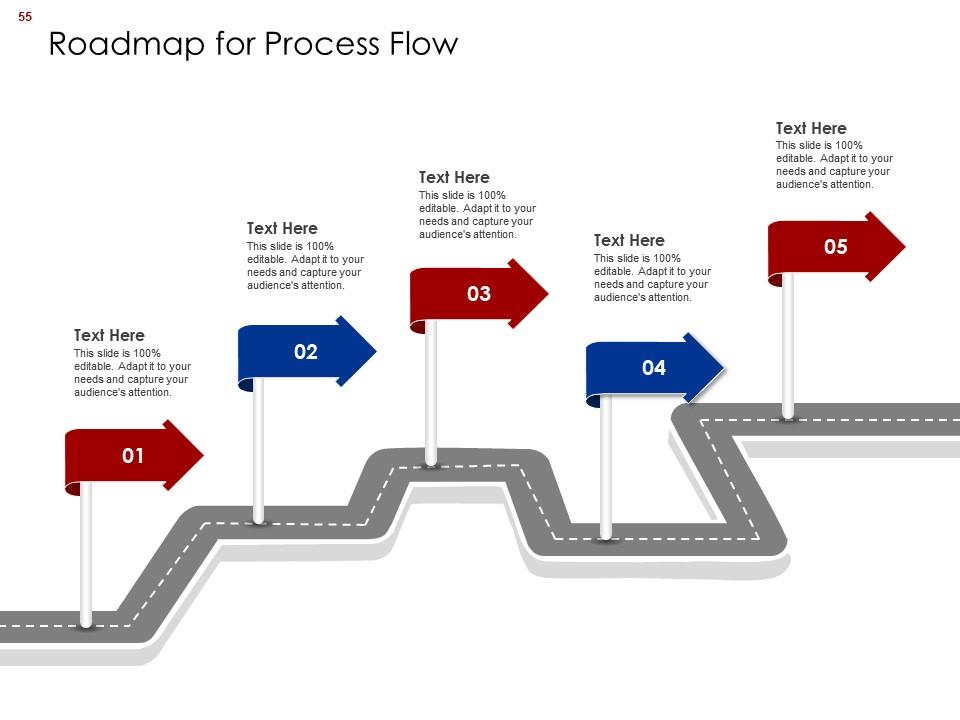
Slide 55: This slide showcases Roadmap for Process Flow.
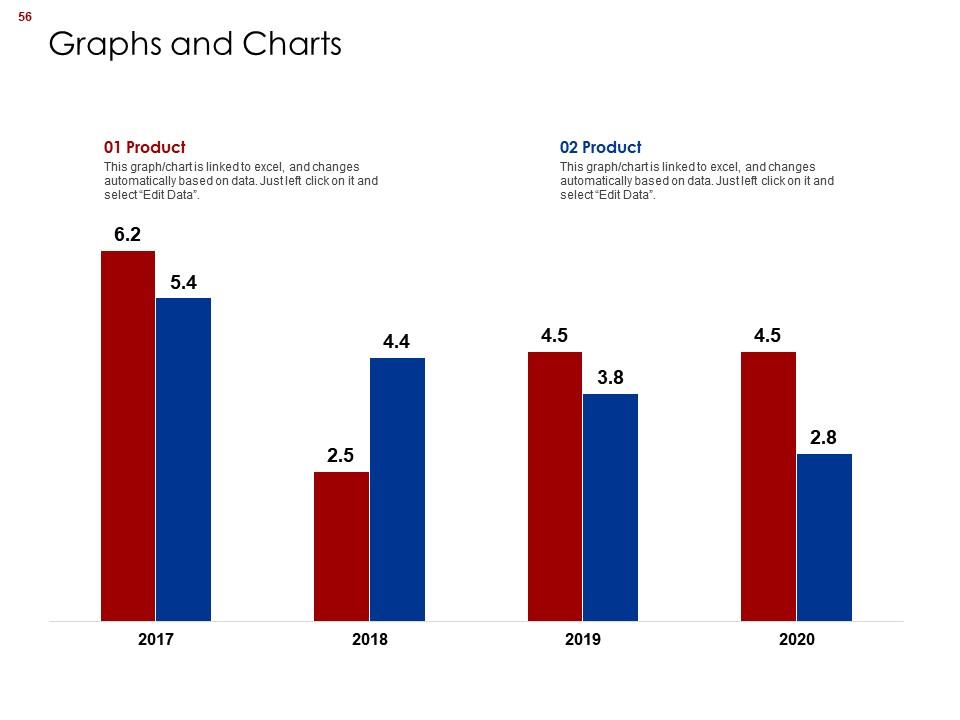
Slide 56: This slide shows Graphs and Charts with two products comparison.
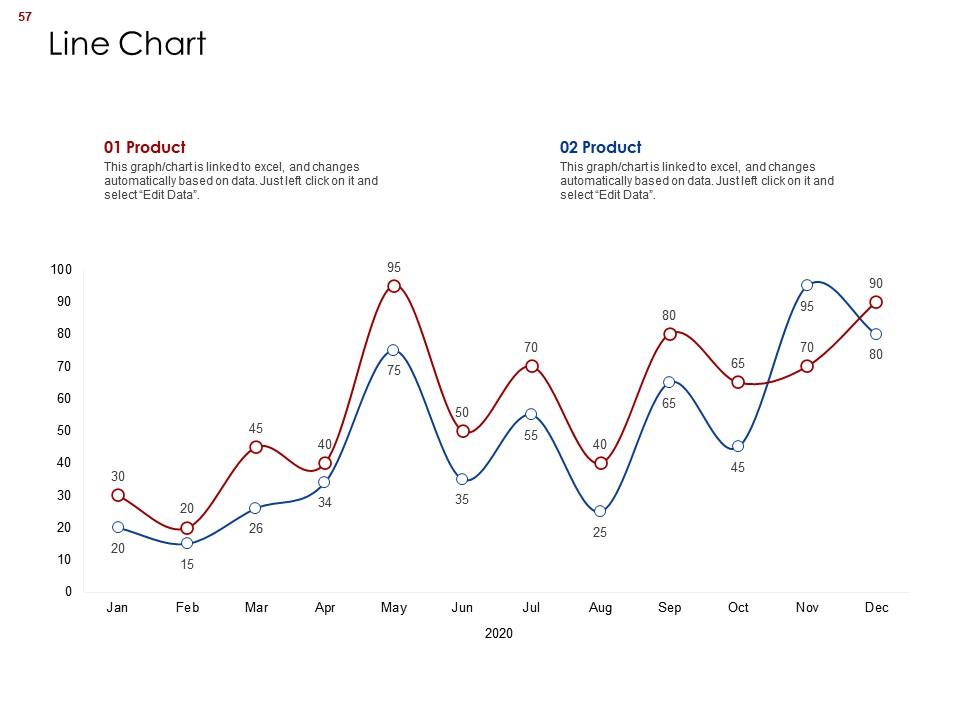
Slide 57: This slide presents Line Chart with two products comparison.
Slide 58: This slide displays Linear Diagram with additional textboxes.
Slide 59: This is an Idea Generation slide to state a new idea or highlight information, specifications etc.
Slide 60: This slide shows Dashboard with additional text boxes to show information.
Slide 61: This is a Financial slide. Show your finance related stuff here.
Slide 62: This is Our Target slide. State your targets here.
Slide 63: This is a Thank You slide with address, contact numbers and email address.
Private Company Liquidity Options Powerpoint Presentation Slides with all 63 slides:
Use our Private Company Liquidity Options Powerpoint Presentation Slides to effectively help you save your valuable time. They are readymade to fit into any presentation structure.
-
Visually stunning presentation, love the content.
-
Colors used are bright and distinctive.
-
Wonderful templates design to use in business meetings.
-
Easily Understandable slides.
-
Innovative and Colorful designs.
-
Illustrative design with editable content. Exceptional value for money. Highly pleased with the product.
-
Very well designed and informative templates.
-
Visually stunning presentation, love the content.
-
Excellent template with unique design.
-
Much better than the original! Thanks for the quick turnaround.


