

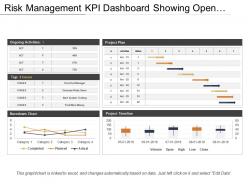
Project status kpi dashboard showing project plan and burndown chart






Try Before you Buy Download Free Sample Product
 Impress Your
Audience
 100%
Editable
 Save Hours
of Time


Show case real-time data about a project performance and see if your schedule is on the track or if resources need reallocation with our project status KPI dashboard showing project plan and burndown chart. This presentation slide of project status KPI dashboard showing project plan and burndown has been designed by our team of professional and is a five stage process. The stages in this template of project metrics dashboard can be portrayed as KPI dashboard best practice PPT slide, project KPI dashboard slide or as a project management metrics and dashboard template. This project dashboard layout will help management team to see every aspect of the project, from costs, budget, time and health to workload, progress, risk, issues and changes. This excel linked project status report template chart can be used in delivering the real-time one-page report and information can be presented in easy-to-read graphs and charts. Download this layout of project performance dashboard for managing projects and update the progress of your project in real-time. Contribute to any conclave with our Project Status Kpi Dashboard Showing Project Plan And Burndown Chart. Your clarity of expression will astound all.
People who downloaded this PowerPoint presentation also viewed the following :
Project status kpi dashboard showing project plan and burndown chart with all 5 slides:
Assess the factors that could effect you with our Project Status Kpi Dashboard Showing Project Plan And Burndown Chart. They help gauge the circumstances.


-
Colors used are bright and distinctive.
-
Unique and attractive product design.