Quarterly business review meeting qbr presentation

Rating:
87%
Quarterly business review meeting qbr presentation
Slide 1 of 2

or

Favourites Favourites

Try Before you Buy Download Free Sample Product

Audience Impress Your
Audience
Editable 100%
Editable
Time Save Hours
of Time
The Biggest Sale is ending soon in
0
0
:
0
0
:
0
0
Rating:
87%
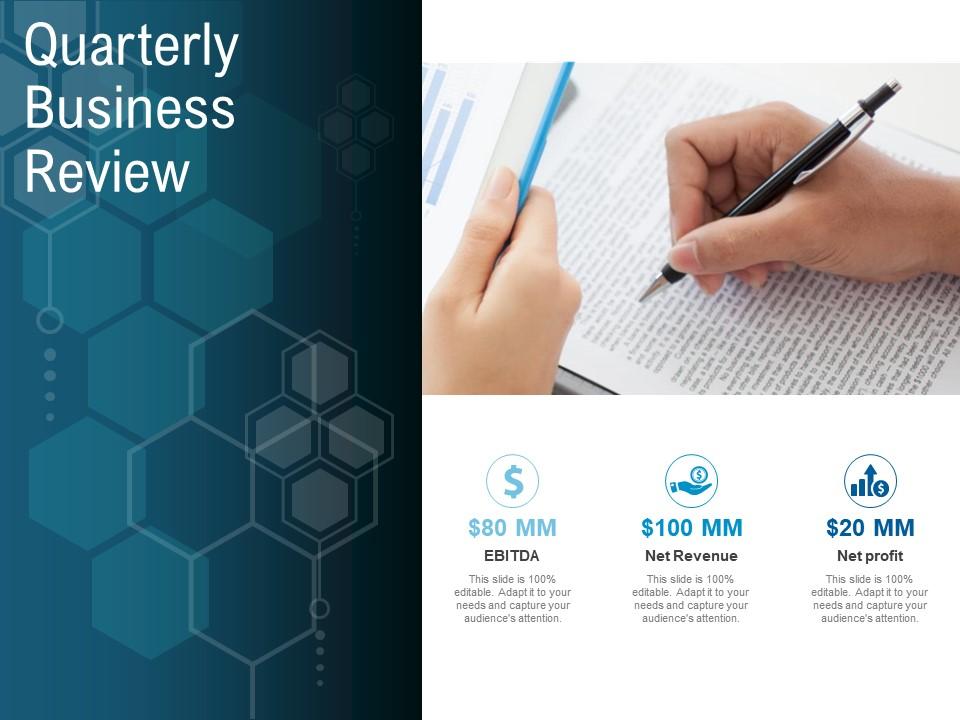
Presenting this set of slides with name Quarterly Business Review Meeting QBR Presentation. The topics discussed in these slides are Business Performance Review, Performance Evaluation, Quarterly Business Review. This is a completely editable PowerPoint presentation and is available for immediate download. Download now and impress your audience.

FAQs for Quarterly business review

Key QBR components include financial performance analysis, goal achievement metrics, market positioning updates, operational efficiency reviews, and strategic initiatives progress. These elements work together by providing comprehensive business visibility, enabling data-driven decision making, and facilitating stakeholder alignment, with many organizations finding that structured QBRs enhance accountability and drive sustainable growth.

Data visualization enhances QBR effectiveness by transforming complex quarterly metrics into clear charts, graphs, and dashboards that stakeholders can quickly interpret and analyze. Through interactive visualizations, executive teams can identify performance trends, spot operational bottlenecks, and make strategic decisions faster, while audiences retain key insights better than traditional spreadsheet presentations, ultimately streamlining quarterly planning processes.

Priority QBR metrics include revenue performance, customer acquisition costs, retention rates, operational efficiency indicators, and strategic goal progression. These metrics enable organizations by identifying growth opportunities, highlighting resource allocation needs, and revealing performance gaps, with many companies finding that focusing on 5-7 key metrics ultimately delivers clearer strategic direction and more decisive action plans.

Stakeholder feedback should be gathered continuously throughout the QBR cycle, including pre-meeting surveys, mid-quarter check-ins, and post-presentation evaluations. This systematic approach enables organizations to refine strategies in real-time, address concerns proactively, and enhance stakeholder engagement, with many companies finding that regular touchpoints ultimately deliver stronger alignment and more actionable quarterly outcomes.

Common QBR pitfalls include overwhelming stakeholders with excessive data, focusing solely on metrics without actionable insights, inadequate preparation time, and neglecting cross-departmental alignment. These challenges can undermine strategic discussions by creating confusion, missing growth opportunities, and failing to demonstrate clear ROI, with many organizations finding that streamlined, insight-driven presentations ultimately deliver stronger stakeholder engagement and clearer strategic direction.

Technology streamlines QBR processes by automating data collection, enabling real-time analytics, and facilitating collaborative reporting across departments. Through integrated dashboards and AI-powered insights, organizations enhance accuracy, reduce preparation time, and deliver more strategic presentations, with many companies finding that automated workflows ultimately minimize manual effort while improving stakeholder engagement and decision-making quality.

Competitive analysis in QBRs provides essential market context by benchmarking performance, identifying industry trends, pricing strategies, and emerging threats or opportunities. This strategic assessment enables teams to adjust positioning, refine value propositions, and capitalize on competitor weaknesses, with many organizations finding that regular competitive insights drive more informed strategic decisions and sustainable competitive advantage.

A QBR agenda should begin with performance highlights and key metrics review, followed by strategic initiatives discussion, challenge identification, and future planning sessions. Structuring these segments with interactive elements like breakout discussions, stakeholder presentations, and collaborative goal-setting keeps participants engaged, while allocating specific timeframes for each section ensures comprehensive coverage and actionable outcomes.

Effective QBR financial presentation strategies include visual dashboards with key metrics, year-over-year comparisons, variance analysis against targets, trend forecasting, and contextualized storytelling around the numbers. These approaches enhance stakeholder understanding by transforming complex data into actionable insights, highlighting both achievements and opportunities, ultimately enabling informed strategic decisions and demonstrating clear accountability to leadership teams.

Storytelling elements can be incorporated into QBR presentations through narrative arcs that connect data points, customer success stories that illustrate key metrics, and challenge-resolution frameworks that showcase quarterly achievements. These techniques transform traditional reporting by creating emotional connections with stakeholders, making complex performance data more memorable and actionable, ultimately enhancing executive engagement and strategic alignment across organizations.

Aligning QBR objectives with overall business goals ensures strategic coherence, resource optimization, and measurable progress toward company-wide priorities, while preventing departmental silos and conflicting initiatives. This alignment enables organizations to track meaningful metrics, allocate resources effectively, and demonstrate clear ROI, with many companies finding that synchronized quarterly reviews accelerate decision-making and enhance cross-functional collaboration.

Follow-up action items can be effectively tracked through centralized project management platforms, automated reminder systems, regular progress check-ins, and assigned ownership with clear deadlines. These tracking mechanisms streamline accountability by establishing transparent workflows, enabling real-time status updates, and facilitating cross-departmental coordination, with many organizations finding that systematic follow-up processes ultimately deliver improved execution rates and stronger quarterly outcomes.

Best practices for involving team members in QBR preparation include assigning specific data collection responsibilities, conducting pre-meeting departmental reviews, creating collaborative templates for input, establishing clear deadlines, and encouraging cross-functional insights sharing. This collaborative approach enhances data accuracy, promotes ownership across teams, and delivers comprehensive quarterly assessments, with many organizations finding that distributed preparation ultimately streamlines the review process while strengthening strategic alignment.

Customer feedback integrates into QBR discussions through sentiment analysis, Net Promoter Score trends, support ticket categorization, survey insights, and direct customer testimonials. These feedback mechanisms enable account managers to identify service gaps, validate strategic initiatives, and demonstrate customer value realization, while presenting both retention opportunities and expansion possibilities that strengthen client relationships and drive revenue growth.

Recommended QBR presentation tools include PowerPoint with advanced templates, Tableau for data visualization, Salesforce Analytics for CRM insights, Google Slides for collaborative editing, and Canva for professional design elements. These platforms streamline presentation creation by offering customizable dashboards, automated data integration, and interactive charts, with many organizations finding that strategic template combinations ultimately deliver more engaging stakeholder communications and faster preparation timelines.

Ratings and Reviews

87% of 100
Review Form
Write a review
Most Relevant Reviews
  1. 80%

    by David Lian

    Design layout is very impressive.
  2. 80%

    by Edgardo Chapman

    Great quality product.
  3. 80%

    by Cyrus Ellis

    Design layout is very impressive.
  4. 80%

    by Denis Rose

    Designs have enough space to add content.
  5. 100%

    by Charley Bailey

    Great designs, really helpful.
  6. 100%

    by Denver Fox

    Great product with effective design. Helped a lot in our corporate presentations. Easy to edit and stunning visuals.

6 Item(s)

per page: