Revenue and expenses comparison historical and projection secondary market investment ppt grid
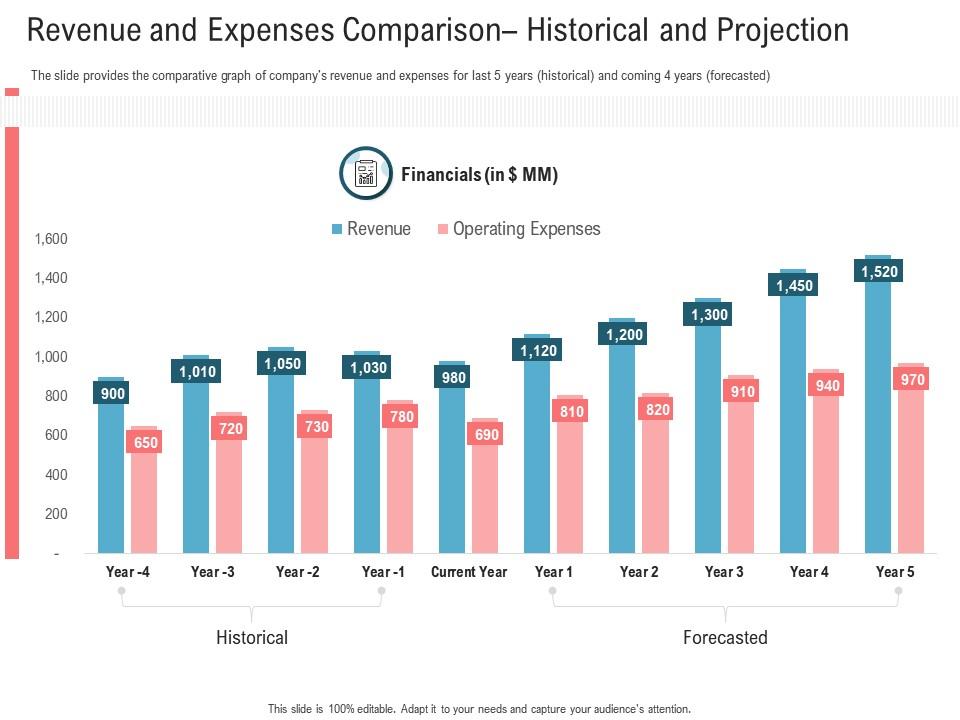
The slide provides the comparative graph of companys revenue and expenses for last 5 years historical and coming 4 years forecasted.
- Google Slides is a new FREE Presentation software from Google.
- All our content is 100% compatible with Google Slides.
- Just download our designs, and upload them to Google Slides and they will work automatically.
- Amaze your audience with SlideTeam and Google Slides.
-
Want Changes to This PPT Slide? Check out our Presentation Design Services
- WideScreen Aspect ratio is becoming a very popular format. When you download this product, the downloaded ZIP will contain this product in both standard and widescreen format.
-

- Some older products that we have may only be in standard format, but they can easily be converted to widescreen.
- To do this, please open the SlideTeam product in Powerpoint, and go to
- Design ( On the top bar) -> Page Setup -> and select "On-screen Show (16:9)” in the drop down for "Slides Sized for".
- The slide or theme will change to widescreen, and all graphics will adjust automatically. You can similarly convert our content to any other desired screen aspect ratio.
Compatible With Google Slides

Get This In WideScreen
You must be logged in to download this presentation.
PowerPoint presentation slides
The slide provides the comparative graph of companys revenue and expenses for last 5 years historical and coming 4 years forecasted. Deliver an outstanding presentation on the topic using this Revenue And Expenses Comparison Historical And Projection Secondary Market Investment Ppt Grid. Dispense information and present a thorough explanation of Operating Expenses, Revenue using the slides given. This template can be altered and personalized to fit your needs. It is also available for immediate download. So grab it now.
People who downloaded this PowerPoint presentation also viewed the following :
Revenue and expenses comparison historical and projection secondary market investment ppt grid with all 2 slides:
Use our Revenue And Expenses Comparison Historical And Projection Secondary Market Investment Ppt Grid to effectively help you save your valuable time. They are readymade to fit into any presentation structure.
-
Excellent products for quick understanding.


