Sales performance reporting ppt sample presentations

Rating:
90%
Slide 1 of 4
Favourites Favourites

Try Before you Buy Download Free Sample Product

Audience Impress Your
Audience
Editable 100%
Editable
Time Save Hours
of Time
The Biggest Sale is ending soon in
0
0
:
0
0
:
0
0
Rating:
90%
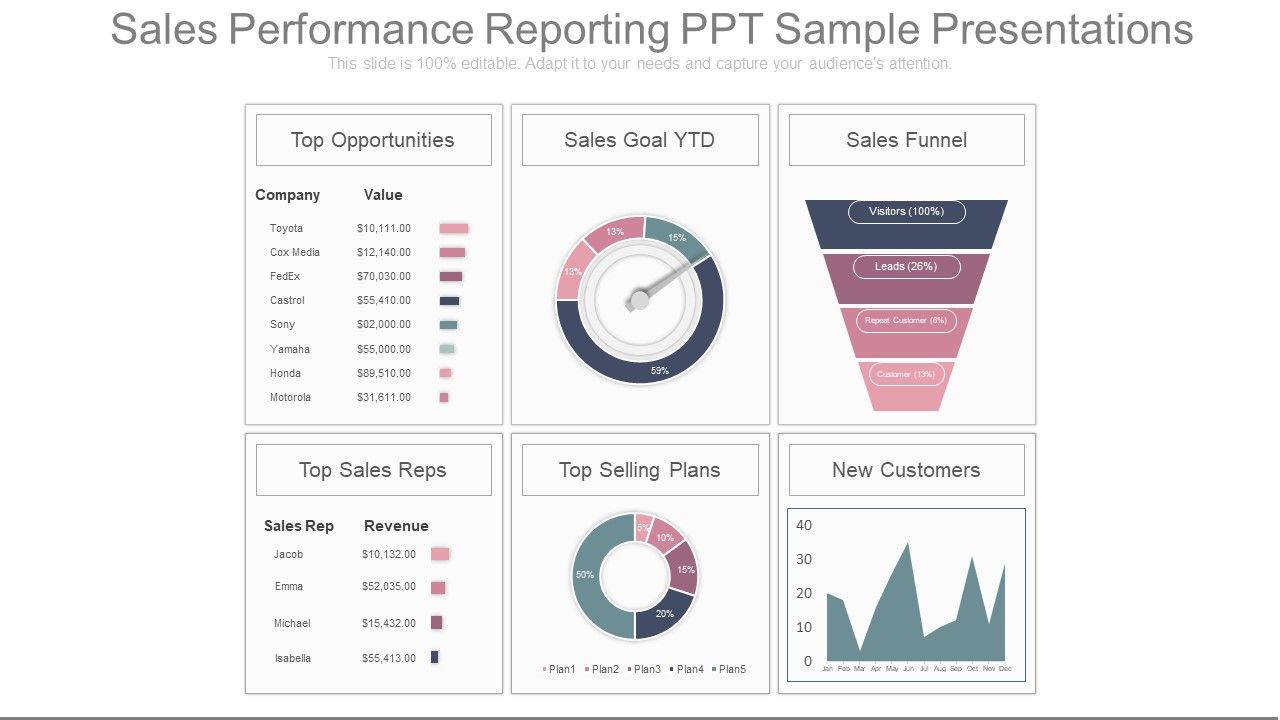
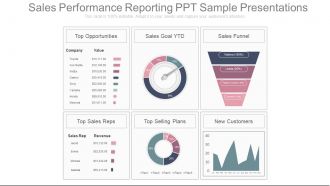
These slides are fully editable to suit your needs. Instantly download any design within a few seconds. Standard and widescreen compatible graphics. Can be opened using Google Slides also. Suitable for use by marketers, sales team, businessmen. Premium customer support service.This is a four stage process. The stages in this process are top opportunities, sales goal ytd, sales funnel, top sales reps, top selling plans, new customers, company, value, sales rep, revenue.

FAQs for Sales performance reporting

Start with the obvious stuff - total revenue, conversion rates, and how healthy your pipeline looks. Sales cycle length matters a ton for forecasting. Activity metrics like calls and meetings are useful but honestly can become a rabbit hole if you're not careful. Customer acquisition cost and lifetime value show you the real money picture. Oh, and definitely track quota attainment and win rates - those are non-negotiable. I'd probably add more later based on what your team's actually struggling with, but this gives you a solid foundation to work from.

Dude, visualization tools are honestly a lifesaver. They turn those nightmare spreadsheets into something you can actually understand at a glance. Your brain picks up on visual stuff so much faster than scanning endless rows of numbers - like, who wants to do that anyway? Charts and graphs let you spot trends, see which things are performing well, figure out where problems are hiding. I learned this the hard way after spending way too many late nights squinting at Excel. Bar charts and line graphs are super simple to start with. Plus when you show stakeholders a clean dashboard instead of just data dumps, they actually listen for once.

Your sales data from the past is like a roadmap for what's ahead. Pull at least 12-18 months worth - trust me, you need that much to see real patterns. Look for which months always crush it and which ones are slow. Check your conversion rates too. Sales cycles usually follow pretty predictable timelines once you map them out. I'd grab two years of data if you can swing it, then hunt for anything that repeats year over year. That's your baseline right there. Honestly, most businesses are way more predictable than they think once you dig into the numbers.

Honestly, your sales reports are like a roadmap for figuring out what training your team actually needs. I'd pull last quarter's numbers and look for patterns - maybe someone's crushing it on calls but tanking at demos, or the whole team sucks at handling price objections. The data tells the real story (unlike Steve who blames "bad leads" for everything). Check stuff like call-to-meeting ratios and deal sizes. You'll spot the gaps pretty quick. Way better than those generic training sessions that put everyone to sleep. Focus on your bottom performers first - they usually share the same 2-3 weaknesses you can fix with targeted coaching.

Honestly, just start with whatever CRM you're already using - bet you're not even using half the reporting stuff that's already in there. Salesforce is solid but way too much if you're just starting out. HubSpot's way more friendly for mid-sized teams. Power BI and Tableau are amazing for turning your messy data into dashboards that actually make sense (though I always forget which filters I set up last week). You can always upgrade later once you figure out what you actually need. Don't overthink it.

Weekly's your best bet honestly. Daily reports are just overkill - you'll spend more time reading than actually selling, and trends need time to show up anyway. Monthly? Way too long to wait if something's going wrong. Weekly gives you that sweet spot where you can catch problems early without drowning in spreadsheets every morning. Though if you're in a crazy fast-paced place or it's like end-of-quarter crunch time, maybe switch to daily temporarily. Just pick something and stick with it so your team knows what to expect.

Honestly, the worst thing you can do is get obsessed with metrics that look impressive but don't actually help you make decisions. Also avoid cherry-picking data just to make your team shine - trust me, people see right through that. Complex reports are useless if nobody reads them, which happens more often than you'd think. Outdated or inconsistent data across systems will tank your credibility super fast. Start simple with maybe three key metrics that actually move the needle on revenue. You can always add more later. Just make sure you're comparing the same types of data when tracking performance over time.

Dude, it's all about tailoring the data depth for who's actually looking at it. Executives just want the big picture - revenue trends, win rates, pipeline health. They literally don't care about call logs or daily activity stuff. But your sales reps? They need all the nitty-gritty details: personal numbers, where their deals stand, activity breakdowns, competitive info that'll help them actually close things. I swear, most companies mess this up by trying to make one report work for everyone. Ask each group what decisions they're making with the data first, then work backwards. Way easier than guessing what they need.

Look, benchmarking is basically your reality check - without it you're just guessing if your numbers are any good. Are your conversion rates decent? Deal sizes competitive? No clue unless you compare to similar companies (same size, market, all that). I've seen teams think they're crushing it when they're actually underperforming hard. Short sales cycles might seem great until you realize everyone else closes way faster. Find solid data sources and use those insights to figure out what actually needs fixing. Way better than randomly trying to improve everything at once.

Okay so first thing - figure out which metrics actually matter for your business. Don't try to track everything, you'll go crazy. Then automate data pulls from your CRM and other systems because manual entry is where things go sideways fast. Honestly, I've watched so many teams mess this up by having different departments define the same metric differently. Get everyone on the same page first. Run monthly audits comparing your data sources, and clean out duplicates and old records regularly - that stuff will tank your reports. Oh, and set up those quality checks monthly so you catch problems before they snowball.

Looking at sales by region and demographics is honestly a game-changer. You'll spot which areas are tanking and figure out your best customer segments. Sometimes the people actually buying aren't who you'd expect at all! Geographic data shows you where to expand next. The demographic stuff is clutch for dialing in your marketing. I'd start simple - grab reports for your top 3-5 regions plus key age/income groups. Then hunt for patterns in conversion rates and deal sizes. It's like detective work but for your business.

Honestly, treat your sales reports like you're telling a story. Begin with what went down last quarter, then dive into the messy stuff your team dealt with, and finish strong with the wins. Skip the boring "Q3 revenue increased 15%" nonsense - nobody cares about that. Instead, talk about how Sarah somehow saved that huge enterprise deal everyone had written off for dead. That's what people actually remember. Real examples hit way harder than spreadsheet data. Oh, and always wrap up each section with what people should do next, otherwise you're just wasting everyone's time.

Dude, you gotta start mixing customer feedback with your sales data. It shows you which deals actually closed because people loved working with you vs just random luck. I swear it's wild how many patterns you'll catch that weren't obvious before. Like, you can see which reps are building real relationships that turn into repeat customers and referrals. The satisfaction scores will also warn you when things are going south. Just throw a feedback column into whatever reports you're already using and watch what trends show up. Honestly changed how I look at our numbers.

Honestly, sales reports are like having a scoreboard everyone can see - suddenly nobody can BS about their numbers anymore. Pick 3-4 metrics that actually move the needle for your team. Then do weekly check-ins where you go through the data together. Transparency is huge here. When reps know exactly where they stand against clear targets, most will naturally step up their game (though there's always that one person who needs extra motivation, lol). The visibility alone creates accountability since everything's out in the open. Just don't overcomplicate it with too many metrics or you'll lose focus.

Dude, real-time sales reporting is a game changer. Your reps can actually pivot mid-month instead of finding out they're screwed when it's too late. I've seen managers jump in with coaching the second someone starts struggling - way better than waiting for monthly reviews. It's like finally getting GPS instead of wandering around lost, you know? Short wins: you celebrate immediately. Problems? You catch them before they spiral. Honestly wish more teams did this. Start with daily dashboard check-ins and see what happens.

Ratings and Reviews

90% of 100
Review Form
Write a review
Most Relevant Reviews
  1. 100%

    by Jones Cook

    The content is very helpful from business point of view.
  2. 100%

    by Edgar George

    Much better than the original! Thanks for the quick turnaround.
  3. 80%

    by Dorsey Hudson

    Excellent design and quick turnaround.
  4. 80%

    by Johnson Morris

    Presentation Design is very nice, good work with the content as well.

4 Item(s)

per page: