High medium low shown by three coloured metric board
End idle jabber with our High Medium Low Shown By Three Coloured Metric Board. Get folks to indulge in beneficial discussions.
- Google Slides is a new FREE Presentation software from Google.
- All our content is 100% compatible with Google Slides.
- Just download our designs, and upload them to Google Slides and they will work automatically.
- Amaze your audience with SlideTeam and Google Slides.
-
Want Changes to This PPT Slide? Check out our Presentation Design Services
- WideScreen Aspect ratio is becoming a very popular format. When you download this product, the downloaded ZIP will contain this product in both standard and widescreen format.
-

- Some older products that we have may only be in standard format, but they can easily be converted to widescreen.
- To do this, please open the SlideTeam product in Powerpoint, and go to
- Design ( On the top bar) -> Page Setup -> and select "On-screen Show (16:9)” in the drop down for "Slides Sized for".
- The slide or theme will change to widescreen, and all graphics will adjust automatically. You can similarly convert our content to any other desired screen aspect ratio.
Compatible With Google Slides

Get This In WideScreen
You must be logged in to download this presentation.
PowerPoint presentation slides
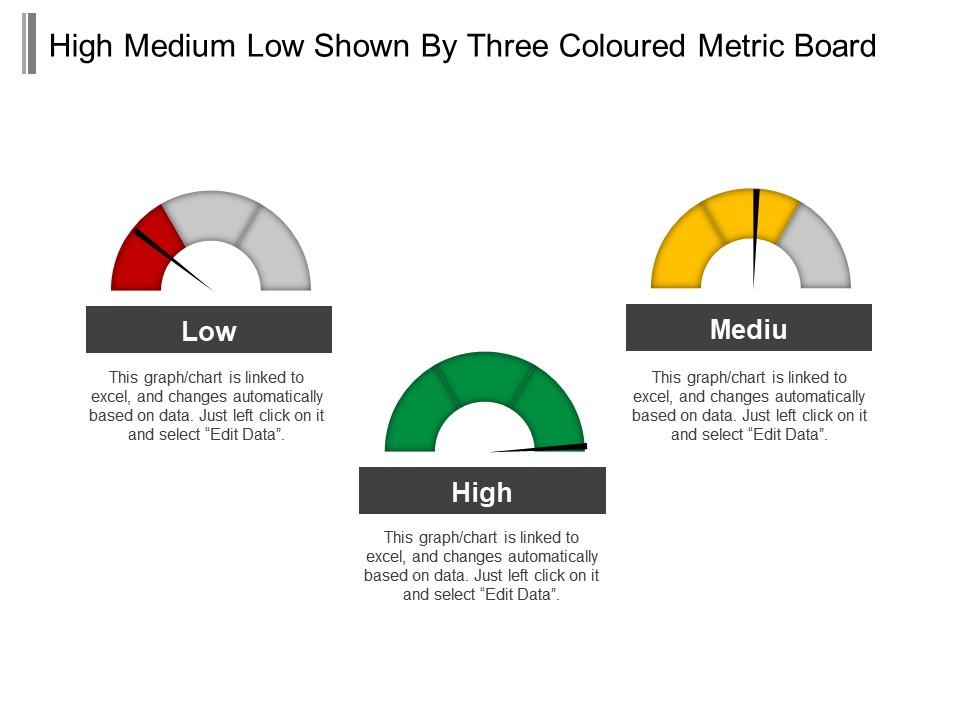
Presenting this set of slides with name - High Medium Low Shown By Three Coloured Metric Board. This is a three stage process. The stages in this process are High Medium Low, High Moderate Low, Top Medium Low.
People who downloaded this PowerPoint presentation also viewed the following :
Content of this Powerpoint Presentation
Description:
The image displays a PowerPoint slide with the title "High Medium Low Shown By Three Coloured Metric Board." It features three semi-circular gauges representing different levels of a metric: one for low (red), medium (yellow), and high (green). Each gauge has a description box below it stating that the graph/chart is linked to Excel, and changes automatically based on data, with instructions to edit the data by left-clicking and selecting "Edit Data."
The gauges are a visual aid for presenting quantitative data, and the colors are typically used to indicate performance or status levels, with red often signaling a warning or low level, yellow indicating a middle or cautionary level, and green signifying a high or optimal level.
Use Cases:
This slide can be effectively used in a variety of industries to visualize and communicate performance metrics or status levels:
1. Manufacturing:
Use: Monitoring production quality levels.
Presenter: Quality Assurance Manager.
Audience: Production team, management.
2. Finance:
Use: Displaying financial health or risk assessments.
Presenter: Financial Analyst.
Audience: Investors, corporate executives.
3. Sales:
Use: Tracking sales performance against targets.
Presenter: Sales Manager.
Audience: Sales team, stakeholders.
4. IT Services:
Use: Reporting system uptime or service level agreements (SLAs).
Presenter: IT Service Manager.
Audience: Clients, technical staff.
5. Energy:
Use: Showing energy consumption or efficiency ratings.
Presenter: Energy Manager.
Audience: Sustainability teams, regulatory bodies.
6. Education:
Use: Representing school or student performance metrics.
Presenter: School Administrator.
Audience: Educators, parents.
7. Transportation:
Use: Indicating fleet operational status or maintenance needs.
Presenter: Fleet Manager.
Audience: Logistics personnel, maintenance teams.
High medium low shown by three coloured metric board with all 5 slides:
Get exactly as you demand with our High Medium Low Shown By Three Coloured Metric Board. Say goodbye to any compromises.
-
Use of icon with content is very relateable, informative and appealing.
-
The content is very helpful from business point of view.


