Seven point infographic growth core values and productivity
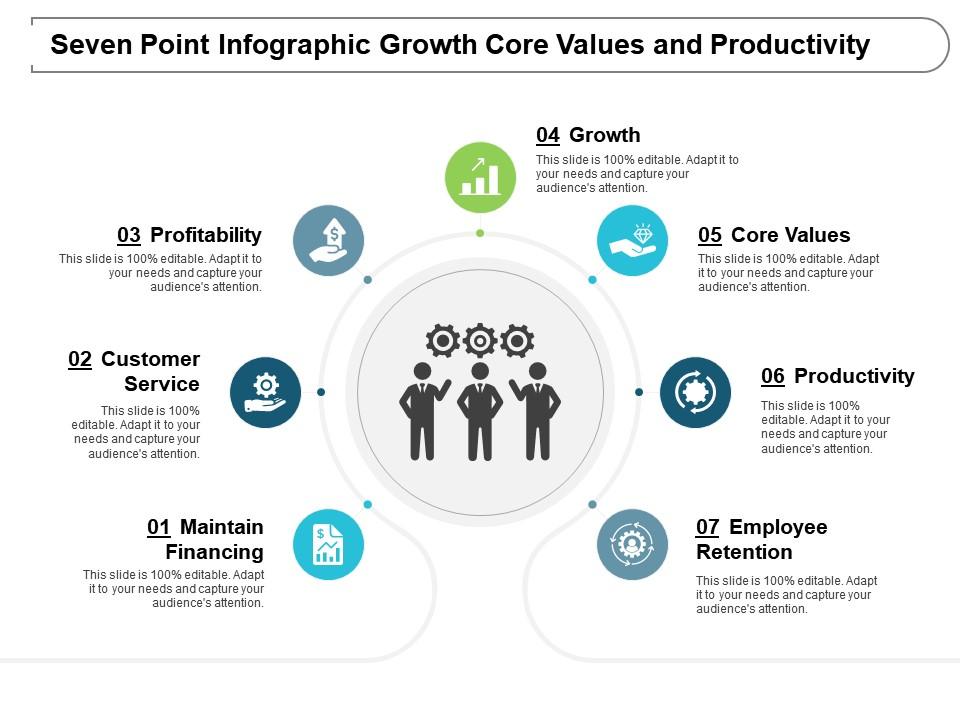
Impress your audience with our seven-point infographic growth core values and productivity presentation design. Core values are what support the vision of your company and help shape its culture. Establishing strong core values provides both internal and external advantages to the company. This core values PowerPoint slideshow is designed using a seven staged circular process with icons and text boxes and it helps in the decision-making process to all the people who are associated with your company be it stakeholders, customers, suppliers, employees, etc. This core values and productivity PPT layout educates your clients and potential customers about what the company is about and clarifies the identity of the company. Our PowerPoint template does the work for you, it shows all the aspects that enables you to create the strategy for different channels and increase the productivity of your organization. So, download the growth and productivity PPT design slideshow and use now. Cruise along with our Seven Point Infographic Growth Core Values And Productivity. Your thoughts will really start to travel.
- Google Slides is a new FREE Presentation software from Google.
- All our content is 100% compatible with Google Slides.
- Just download our designs, and upload them to Google Slides and they will work automatically.
- Amaze your audience with SlideTeam and Google Slides.
-
Want Changes to This PPT Slide? Check out our Presentation Design Services
- WideScreen Aspect ratio is becoming a very popular format. When you download this product, the downloaded ZIP will contain this product in both standard and widescreen format.
-

- Some older products that we have may only be in standard format, but they can easily be converted to widescreen.
- To do this, please open the SlideTeam product in Powerpoint, and go to
- Design ( On the top bar) -> Page Setup -> and select "On-screen Show (16:9)” in the drop down for "Slides Sized for".
- The slide or theme will change to widescreen, and all graphics will adjust automatically. You can similarly convert our content to any other desired screen aspect ratio.
Compatible With Google Slides

Get This In WideScreen
You must be logged in to download this presentation.
PowerPoint presentation slides
Presenting seven-point infographic growth core values and productivity PPT template. Attuned with Microsoft office software’s as well as Google Slides. Amend and customize the PPT slide by adding the corporate trademark and icon. Ample space provided to enter your information. Assistance to make changes has been provided in the slide. Useful for sales leaders, marketers, business professionals, analysts, strategists, customers, general public, etc. Effortlessly and fluently adjustable by any user at any time without even having any expertise.
People who downloaded this PowerPoint presentation also viewed the following :
Content of this Powerpoint Presentation
Description:
The image is of a PowerPoint slide titled "Seven Point Infographic Growth Core Values and Productivity." It features seven key areas each business should focus on to foster growth, uphold core values, and boost productivity.
Each point is numbered and has an associated icon that visually represents the concept:
1. Maintain Financing:
Suggests the importance of securing and managing financial resources, symbolized by a graph and dollar sign, indicating financial performance and stability.
2. Customer Service:
Highlighted by an icon with a gear and a representative, emphasizing the need for efficient customer support systems and service quality.
3. Profitability:
Depicted with a rising bar graph, underscoring the goal of achieving and maintaining profit margins as a measure of success.
4. Growth:
Accompanied by an upward trend and circles, pointing to the expansion and scaling of business operations.
5. Core Values:
Represented by a group of people and cogwheels, indicating the foundational beliefs and principles that guide a company's culture and decision-making.
6. Productivity:
Illustrated with a clock, signifying the effective and efficient use of time and resources to maximize output.
7. Employee Retention:
Shown with a badge icon, stressing the importance of keeping valuable employees engaged and reducing turnover.
Each section of the infographic reminds the viewer that the slide is "100% editable," indicating the adaptability of the template to suit specific organizational needs and highlight key points effectively to engage an audience.
Use Cases:
Infographics like these are crucial in conveying growth strategies and company values across industries, aiding in alignment and goal-setting for teams and stakeholders.
1. Technology:
Use: Communicating company culture and innovation strategies
Presenter: Chief Technology Officer
Audience: Employees, Investors
2. Healthcare:
Use: Discussing patient-centered care and operational efficiency
Presenter: Healthcare Administrator
Audience: Medical Staff, Hospital Board Members
3. Education:
Use: Outlining institutional values and educational productivity
Presenter: University Dean
Audience: Faculty, Educational Staff
4. Retail:
Use: Detailing customer service excellence and retention strategies
Presenter: Retail Operations Manager
Audience: Store Managers, Customer Service Teams
5. Hospitality:
Use: Explaining service standards and staff engagement measures
Presenter: Hotel General Manager
Audience: Hotel Staff, Stakeholders
6. Finance:
Use: Describing fiscal responsibility and client-oriented service
Presenter: Financial Planner
Audience: Banking Staff, Financial Advisors
7. Manufacturing:
Use: Addressing efficiency, growth, and workforce management
Presenter: Operations Director
Audience: Plant Managers, Production Teams
Seven point infographic growth core values and productivity with all 5 slides:
Invoke good fortune with our Seven Point Infographic Growth Core Values And Productivity. Acquire the blessings of the Force.
No Reviews


