Six months bi strategy roadmap for project management
Utilize our pre build Six Months Bi Strategy Roadmap For Project Management to present your plan of action in the most effective way. Reduce the paperwork and showcase how different activities are linked to each other by incorporating this attention grabbing PowerPoint theme. This completely editable roadmap PPT layout is suitable to fit all your needs and to have a structured outline of the entire process flow using color coding. Provide guidelines to your teammates about the progression process by employing our PPT theme. Team members can easily be designated into teams by accessing the work milestones to be accomplished within the timeframe. You can easily modify the PowerPoint slide according to real time situations. Download our stunning Six Months Bi Strategy Roadmap For Project Management, and you are good to go to prove your expertise in strategic planning.
Utilize our pre build Six Months Bi Strategy Roadmap For Project Management to present your plan of action in the most effe..
- Google Slides is a new FREE Presentation software from Google.
- All our content is 100% compatible with Google Slides.
- Just download our designs, and upload them to Google Slides and they will work automatically.
- Amaze your audience with SlideTeam and Google Slides.
-
Want Changes to This PPT Slide? Check out our Presentation Design Services
- WideScreen Aspect ratio is becoming a very popular format. When you download this product, the downloaded ZIP will contain this product in both standard and widescreen format.
-

- Some older products that we have may only be in standard format, but they can easily be converted to widescreen.
- To do this, please open the SlideTeam product in Powerpoint, and go to
- Design ( On the top bar) -> Page Setup -> and select "On-screen Show (16:9)” in the drop down for "Slides Sized for".
- The slide or theme will change to widescreen, and all graphics will adjust automatically. You can similarly convert our content to any other desired screen aspect ratio.
Compatible With Google Slides

Get This In WideScreen
You must be logged in to download this presentation.
PowerPoint presentation slides
Presenting Six Months Bi Strategy Roadmap For Project Management PowerPoint Template. This PPT presentation is Google Slides compatible hence it is easily accessible. You can download and save this PowerPoint layout in different formats like PDF, PNG, and JPG. This PPT theme is available in both 4,3 and 16,9 aspect ratios. This PowerPoint template is customizable so you can modify the font size, font type, color, and shapes as per your requirements.
People who downloaded this PowerPoint presentation also viewed the following :
Content of this Powerpoint Presentation
Description:
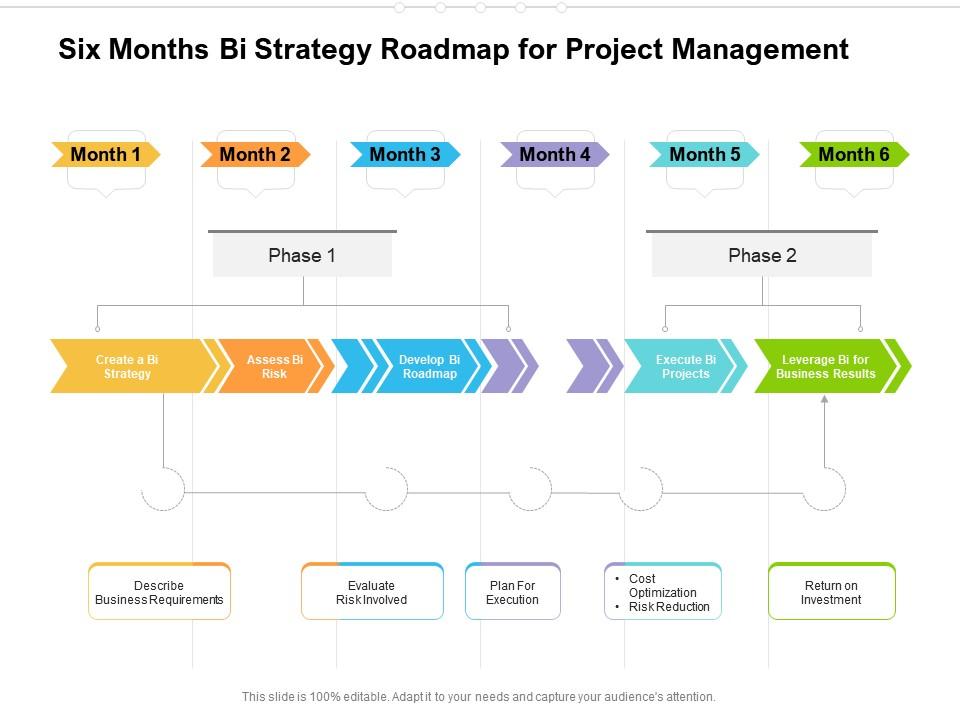
The image presents a structured "Six Months BI Strategy Roadmap for Project Management," focusing on Business Intelligence (BI) implementation to enhance project management practices.
This strategic plan is divided into two phases, with each phase covering three months of the roadmap:
In Month 1, under Phase 1, "Create a BI Strategy" is highlighted, suggesting the initial stage focuses on developing a strategic approach to BI implementation. This may include setting objectives, identifying key BI technology and tools, and determining how they align with the company's goals.
Month 2 emphasizes "Assess BI Risk," indicating that the next step involves evaluating potential risks associated with the BI strategy. It involves understanding the potential challenges or setbacks the project could face, such as data quality issues, integration complexities, or user adoption hurdles.
"Develop BI Roadmap" in Month 3 represents the planning component, where a detailed plan is laid out for the BI strategy's execution. Here, the steps required to implement the BI tools and processes are documented, along with timelines and benchmarks.
Phase 2 begins in Month 4 with "Execute BI Projects," where the actual implementation of the BI tools and strategy takes place based on the developed roadmap.
Month 5 and Month 6 cover "Leverage BI for Business Results." This phase is about utilizing the implemented BI strategy to achieve tangible business results, analyzing performance, and making data-driven decisions that can benefit the organization.
Below the monthly phases, additional details are provided to support the strategy's steps:
"Describe Business Requirements," "Evaluate Risk Involved," "Plan For Execution," "Cost Optimization - Risk Reduction," and "Return on Investment." Each of these refers to underlying strategic actions or considerations vital for a comprehensive BI project.
Use Cases:
This versatile BI strategy roadmap can find application across a variety of industries for improving project management through Business Intelligence tools and practices. Here are seven industries where this roadmap could be effectively utilized:
1. Technology:
Use: Implementing BI for software development and customer analytics.
Presenter: Chief Technology Officer (CTO) or BI Manager.
Audience: Project teams and department heads.
2. Retail:
Use: Enhancing inventory management and customer experience through BI insights.
Presenter: Chief Operating Officer (COO) or Retail Analytics Director.
Audience: Store managers and regional directors.
3. Healthcare:
Use: Optimizing patient care and operational efficiency with BI tools.
Presenter: Healthcare Administrator or Clinical Data Analyst.
Audience: Hospital management and healthcare professionals.
4. Banking and Finance:
Use: Streamlining financial reporting and risk management through BI solutions.
Presenter: Chief Financial Officer (CFO) or Financial Analyst.
Audience: Finance department staff and risk management teams.
5. Manufacturing:
Use: Improving supply chain logistics and production processes with BI.
Presenter: Operations Manager or Supply Chain Analyst.
Audience: Production supervisors and logistics coordinators.
6. Education:
Use: Managing institutional performance and enhancing educational outcomes with BI analytics.
Presenter: Dean or Director of Institutional Research.
Audience: Faculty and administrative staff.
7. Marketing and Advertising:
Use: Increasing campaign effectiveness and ROI through BI-driven insights.
Presenter: Marketing Director or Data Scientist.
Audience: Marketing team members and strategy planners.
Six months bi strategy roadmap for project management with all 2 slides:
Give your audience a fulfilling experience. They will find our Six Months Bi Strategy Roadmap For Project Management elevating.
No Reviews


