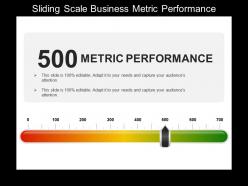
Sliding scale business metric performance powerpoint guide
Try Before you Buy Download Free Sample Product
Audience
Editable
of Time
Comedy can refocus serious thought. Our Sliding Scale Business Metric Performance Powerpoint Guide can help with some comical content.
People who downloaded this PowerPoint presentation also viewed the following :
Sliding scale business metric performance powerpoint guide with all 5 slides:
Display chivalry with our Sliding Scale Business Metric Performance Powerpoint Guide. The audience will glorify your actions.
FAQs for Sliding scale business metric
So sliding scale metrics change their thresholds based on what's happening, but fixed ones stay the same no matter what. Like instead of "response time must be under 2 seconds always," you might allow 3 seconds during busy periods but want 1 second when it's quiet. Fixed metrics are way simpler to set up, I'll give them that. But they can be pretty unrealistic when conditions keep changing. You'll want sliding scale when your system deals with different loads or seasonal stuff. Honestly, just look at which fixed metrics currently break when things get crazy - those are perfect candidates to switch over.
Honestly, you need to map out what good performance looks like at different levels first. Don't just eyeball it - create actual criteria for each tier based on experience, team size, whatever matters for your roles. Like, what does "exceeds expectations" mean for a 2-year employee vs someone who's been there 8 years? Totally different standards, right? Make sure everyone knows how their metrics shift based on their situation - transparency is huge here. Oh, and definitely pilot it with a smaller team before going company-wide. You'll catch issues you never thought of. Trust me on that one.
Honestly, the biggest win is just being able to pivot when stuff changes - which it always does. Like if half your team suddenly gets pulled onto another project, you can adjust your velocity targets instead of beating yourself up for missing some arbitrary number you set months ago. That's soul-crushing and totally pointless. You're basically protecting your metrics from all the usual chaos - scope creep, resource shuffles, timeline disasters. Start small with one metric next sprint and see how much easier planning gets. Way better than pretending everything will go exactly as planned (spoiler: it won't).
So instead of just one target, you set up different tiers - like 15%/20%/25% for sales goals. Way less pressure that way. Your team won't feel like total failures if they hit the middle tier instead of the top one. I've seen this work really well because there's always something to aim for next. Bronze/silver/gold levels keep people motivated even when they're having an off quarter. Honestly, the single-target thing is kind of brutal - you either win or lose, no in-between. Try 3-4 tiers next time and watch how differently people respond to it.
SaaS companies get the most out of sliding scale metrics, along with consulting and financial services. Manufacturing too, especially with seasonal stuff. Makes sense when you think about it - if your clients range from tiny startups to massive enterprises, regular metrics just look wonky. I'd say any industry where client size varies wildly will benefit. Retail during holiday season is another good example. Look at where your numbers seem off because of client mix or timing issues. That's probably where you need sliding scales instead of the usual static approach.
So basically, sliding scale metrics let you change your thresholds based on what's actually happening instead of sticking to some arbitrary number. Like instead of "80% is always good," you can compare Q4 to Q1 or adjust for seasonal stuff. Honestly took me forever to wrap my head around this concept, but now I swear by it. You'll spot patterns you'd totally miss otherwise. False alarms become way less of a thing too when you account for natural variations. Pick one metric where context really matters and just start playing around with different thresholds based on whatever factors make sense.
Oh man, biggest thing is people will hate the change at first. Sliding scales feel way more complicated than just hitting a target, you know? Data gets messy too - suddenly you're tracking performance across all these different situations instead of one simple number. Everyone needs training on how this stuff actually works, which takes forever. Your reports become super detailed and honestly some executives will roll their eyes at that. Oh and you'll need better tracking systems since everything's more complex now. My advice? Test it with just one metric first to see what breaks.
Yeah, they totally work for nonprofits! Raw numbers are kinda meaningless anyway - like who cares if you served 1000 meals if it cost you $50k vs $5k, you know? Better to track meals per dollar or actual food insecurity reduction in your area. Same logic works for donor stuff, volunteer retention, whatever. I'd start small though - pick one metric that actually matters to your org and break it into maybe 3-4 tiers based on your capacity or the communities you're working with. Way more useful than just counting things.
Honestly, those sliding scales are game-changers for getting real feedback. Instead of just yes/no answers, you get the full picture - like 1-10 ratings or "very dissatisfied" to "very satisfied." Most customers aren't totally thrilled OR completely miserable, right? They're usually somewhere in the middle. The beauty is you'll catch satisfaction dropping before it crashes completely. I'd probably start with monthly NPS or CSAT tracking - you'll start seeing patterns pretty quickly. Way better than those basic "are you happy?" surveys that tell you basically nothing useful.
Honestly, you've gotta build in regular check-ins - maybe every 3-6 months - to look at both your metrics and the ranges you set. Market shifts, company changes, new priorities... all that stuff makes your old benchmarks useless pretty fast. I've watched teams cling to numbers that made zero sense anymore just because nobody wanted to rock the boat. Set up automatic triggers too - like if you're consistently hitting the top or bottom of your scale for months. Way better than scrambling to fix things after they're already broken. Oh, and make these reviews planned, not some panic response when everything's falling apart.
Analytics platforms like Tableau are perfect for this - they'll auto-calculate and show your sliding scale metrics in real-time. Most BI tools let you set dynamic thresholds that shift based on customer size, market conditions, whatever matters to your business. I've worked with teams using everything from fancy dashboards to basic Python scripts (honestly, sometimes the simple approach works better). First step is figuring out which variables should trigger your scale changes. Then build automated pipelines pulling data from different sources. Set up alerts so you know when metrics hit those critical points. The whole thing recalculates automatically as conditions change.
Honestly, visuals just make everything click better for people. Instead of staring at boring spreadsheet numbers, stakeholders can actually *see* what's happening with color-coded dashboards and progress bars. It's way easier to spot trends and celebrate wins when you've got charts doing the work. I mean, who wants to dig through data tables when you could have interactive visuals? Tableau's great for this stuff, or even Google Charts if you want something simpler. The key is turning those sliding scale metrics into visual stories. People remember what they can see – plus it gets their attention way faster than static numbers ever will.
Ok so first thing - keep it simple with like 3-5 performance levels tops. More than that and people's eyes glaze over, trust me. Your metrics need to actually matter for the business, not just pretty numbers that make executives happy (I've been burned by vanity metrics before lol). Get your team involved when you're setting this up - if they don't understand why you're tracking something, good luck getting them to care. You'll want to review everything quarterly since priorities shift. Oh and definitely adjust those thresholds based on real data, not whatever sounded good in the planning meeting.
Yeah, cultural stuff totally changes how people see sliding scale metrics. Individualistic cultures usually love performance-based scaling, but collectivist ones? They hate anything that creates obvious gaps between teammates. Power distance expectations are huge too - some cultures want clear hierarchies while others prefer everything flatter. Oh, and whether your people value transparency or privacy around pay makes a massive difference. Honestly, I'd survey your specific culture first and maybe run a pilot test with different groups. You don't want to roll something out that completely bombs because you missed how your audience actually thinks about fairness.
Don't make your scale too narrow or you'll miss important changes. Too wide and everything looks the same. I switched scales halfway through a project once - total nightmare, don't do it. Also, be super specific about what each number means or your whole team will score things differently. Test it on old data first to see if it actually works. Oh, and measure what actually matters for your goals, not just whatever's easiest to track. Sounds obvious but you'd be surprised how often people mess that up.
-
Excellent work done on template design and graphics.
-
Unique research projects to present in meeting.