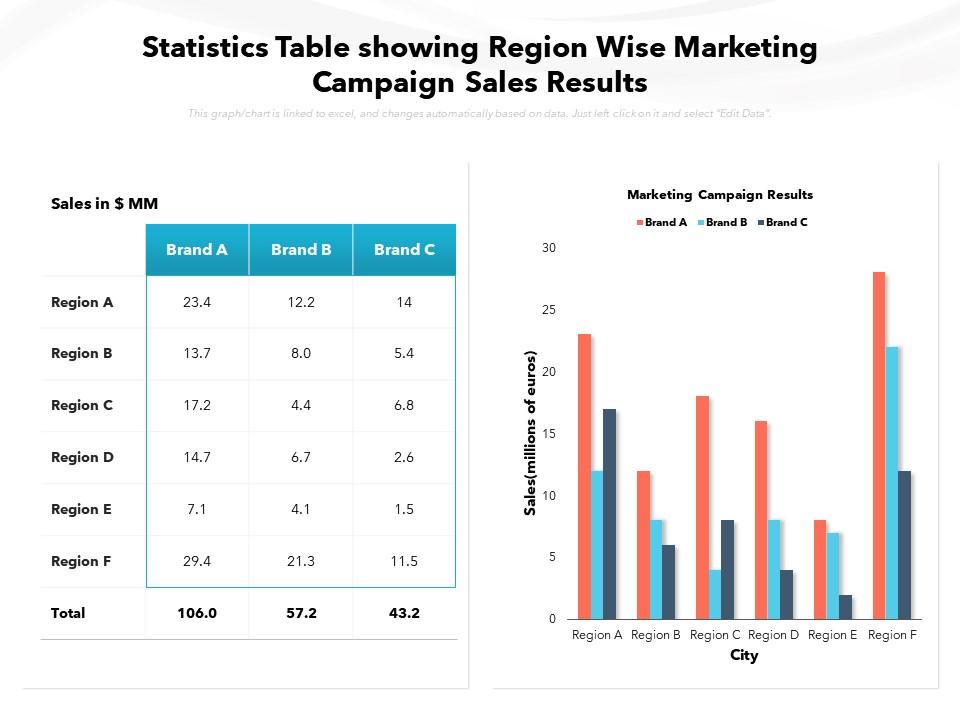
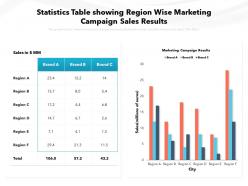
Statistics table showing region wise marketing campaign sales results
Try Before you Buy Download Free Sample Product
Audience
Editable
of Time
Our Statistics Table Showing Region Wise Marketing Campaign Sales Results are topically designed to provide an attractive backdrop to any subject. Use them to look like a presentation pro.
People who downloaded this PowerPoint presentation also viewed the following :
Statistics table showing region wise marketing campaign sales results with all 2 slides:
Use our Statistics Table Showing Region Wise Marketing Campaign Sales Results to effectively help you save your valuable time. They are readymade to fit into any presentation structure.
FAQs for Statistics table showing region wise marketing
Key performance indicators for marketing campaigns include conversion rates, customer acquisition cost, return on investment, engagement metrics, and lead quality scores. These KPIs enable organizations to optimize resource allocation, identify high-performing channels, and measure revenue impact, with many companies finding that tracking multiple metrics simultaneously delivers deeper insights and competitive advantage in increasingly data-driven markets.
Effective analysis requires tracking attribution models, customer journey mapping, multi-touch analytics, conversion funnel metrics, and channel-specific ROI measurements. Through integrated CRM and marketing automation platforms, businesses can identify which channels drive qualified leads, measure cross-channel interactions, and optimize budget allocation, ultimately delivering improved conversion rates and strategic resource allocation across campaigns.
Customer segmentation enhances marketing campaign effectiveness by enabling targeted messaging, personalized content delivery, optimized channel selection, and strategic resource allocation across distinct audience groups. Through advanced analytics and behavioral data, organizations streamline campaign performance by increasing engagement rates, improving conversion outcomes, and maximizing ROI, with many retailers and financial services finding that segmented approaches deliver significantly higher response rates than broad-based campaigns.
Marketing campaigns can be differentiated from organic sales through attribution modeling, control group testing, incremental lift analysis, and baseline comparison methods. These approaches help isolate campaign impact by measuring sales variations during campaign periods versus historical patterns, with many organizations finding that multi-touch attribution and A/B testing deliver the clearest insights into true campaign ROI.
Customer feedback methods include surveys, focus groups, social media monitoring, direct interviews, and Net Promoter Score assessments. These approaches enable businesses to gauge campaign effectiveness by capturing sentiment analysis, purchase intent data, and brand perception shifts, with many organizations finding that combining multiple feedback channels delivers comprehensive insights and competitive advantage.
A/B testing optimizes marketing messages by comparing different versions of content, subject lines, calls-to-action, visuals, and timing across audience segments. Through systematic testing, companies can identify which messaging resonates most effectively, refine targeting strategies, and enhance conversion rates, with many organizations finding that data-driven optimization delivers significantly improved sales performance and customer engagement.
Social media engagement significantly impacts marketing campaign sales by building brand awareness, fostering customer relationships, and driving direct conversions through targeted content. Higher engagement rates typically correlate with increased website traffic, lead generation, and ultimately sales growth, with many retail and e-commerce businesses finding that authentic social interactions enhance customer trust and purchase decisions.
Historical sales data enables businesses to predict marketing campaign success by identifying seasonal trends, customer behavior patterns, channel performance metrics, and demographic preferences from past campaigns. Through predictive analytics and machine learning models, organizations can forecast conversion rates, optimize budget allocation, and target high-value segments more effectively, ultimately delivering higher ROI and more strategic campaign planning.
Conversion rate improvement strategies include A/B testing messaging and visuals, optimizing landing page design, implementing retargeting campaigns, personalizing content based on customer segments, and streamlining the checkout process. These approaches enhance user experience by reducing friction points, delivering targeted messaging, and creating seamless customer journeys, with many organizations finding that strategic combination of these tactics significantly increases sales while lowering customer acquisition costs.
Seasonal trends significantly impact marketing campaign sales through fluctuating consumer demand, purchasing patterns, and engagement levels across different periods throughout the year. Marketing teams can account for these variations by analyzing historical data, adjusting budget allocation timing, segmenting campaigns by seasonal relevance, and incorporating predictive modeling, ultimately enabling more strategic resource planning and improved ROI performance.
Common pitfalls include confusing correlation with causation, ignoring external market factors, analyzing data too early before conversion cycles complete, and failing to account for multi-touch attribution across channels. These issues can be avoided by establishing clear baseline metrics, allowing sufficient time for campaign analysis, implementing proper attribution modeling, and conducting controlled A/B testing, ultimately delivering more accurate ROI assessments and strategic insights for future campaigns.
Marketing automation tools enhance sales tracking and reporting by centralizing data collection, providing real-time analytics dashboards, and creating automated performance reports across multiple channels. These platforms streamline lead attribution tracking, conversion funnel analysis, and ROI measurement, with many organizations finding that integrated automation delivers faster insights, more accurate forecasting, and ultimately enables data-driven campaign optimization for improved sales outcomes.
**INPUT**: In what ways can we assess the long-term impact of a marketing campaign on brand loyalty and sales? **OUTPUT**: Assessing long-term marketing campaign impact involves tracking customer lifetime value, repeat purchase rates, brand sentiment analysis, net promoter scores, and sales attribution modeling over extended periods. These metrics enable organizations to measure sustained engagement beyond immediate conversions, with many retail and financial services companies finding that comprehensive tracking delivers deeper customer insights, improved retention strategies, and ultimately stronger competitive positioning in increasingly crowded markets. [Word count: 60]
Aligning sales and marketing teams improves campaign accuracy by establishing shared metrics, unified lead scoring systems, and consistent messaging throughout the customer journey. This strategic collaboration enables organizations to track conversions more precisely, identify high-value prospects earlier, and optimize campaign targeting, with many companies finding significantly higher ROI and shorter sales cycles.
Visual best practices for marketing campaign presentations include clear data visualization, consistent branding, strategic color coding, compelling before-and-after comparisons, and executive summary highlights. These approaches streamline complex performance data by emphasizing key metrics, ROI outcomes, and actionable insights, with many marketing teams finding that visual storytelling ultimately enhances stakeholder engagement and accelerates campaign optimization decisions.
-
Excellent products for quick understanding.
-
Excellent work done on template design and graphics.