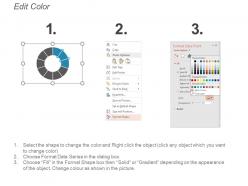
43203311 style division donut 2 piece powerpoint presentation diagram template slide
Create a brilliant and professional impression with our multiple charts for business growth presentation images PowerPoint deck example. This is a two stage process which comprises of the various following components, namely: multiple charts, multiple graph, multiple table along with multiple grid. Use this deck to showcase the significance of multiple charts for business growth which can also be incorporated in any business easily. As concentration is key when it comes to running a business or even in daily life, this PPT deck has been carefully designed and integrated to incorporate the attention of a professional and a varied audience during business meetings. Use this PPT to smartly process and convey the concept of multiple charts for business growth using this PowerPoint in a business meeting within an organization. This icon is smartly designed so that you can now captivate your audience with this process chart PowerPoint layout at the simple click of a button! Simply download, customize with your data and present it to your audience! Get gushing compliments due to our Multiple Charts For Business Growth Presentation Images. Folks find your acumen to be highly impressive.
- Google Slides is a new FREE Presentation software from Google.
- All our content is 100% compatible with Google Slides.
- Just download our designs, and upload them to Google Slides and they will work automatically.
- Amaze your audience with SlideTeam and Google Slides.
-
Want Changes to This PPT Slide? Check out our Presentation Design Services
- WideScreen Aspect ratio is becoming a very popular format. When you download this product, the downloaded ZIP will contain this product in both standard and widescreen format.
-

- Some older products that we have may only be in standard format, but they can easily be converted to widescreen.
- To do this, please open the SlideTeam product in Powerpoint, and go to
- Design ( On the top bar) -> Page Setup -> and select "On-screen Show (16:9)” in the drop down for "Slides Sized for".
- The slide or theme will change to widescreen, and all graphics will adjust automatically. You can similarly convert our content to any other desired screen aspect ratio.
Compatible With Google Slides

Get This In WideScreen
You must be logged in to download this presentation.
PowerPoint presentation slides
Presenting, our well designed multiple charts for business growth presentation images PowerPoint deck example A high-resolution PPT example slide for a bright widescreen aspect and comfortable professional experience. Support of proper color contrast to secure clear display. Method of strengthening and complementing picture graphics.100 percent editable content, edit the colors and the text with your company data as per the provisions. Easy insertion and exclusion of information, as per need. worthy for business experts, entrepreneurs, financial analysts, students, and scholars. Use with Google Slides and regenerate into jpeg or pdf format.
Content of this Powerpoint Presentation
Description:
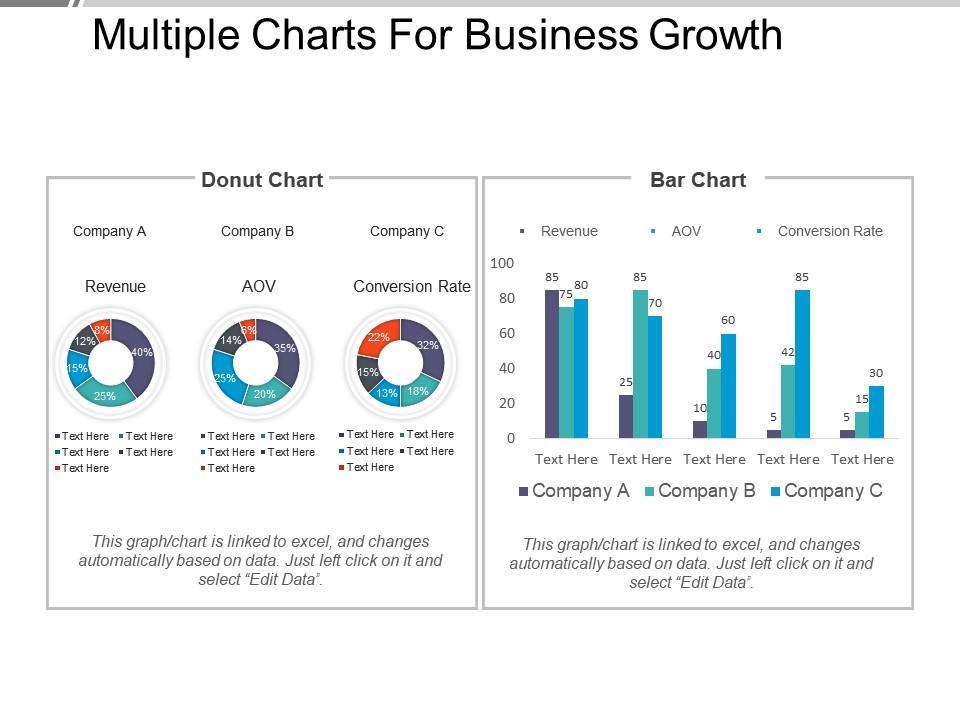
The image presents a PowerPoint slide titled "Multiple Charts For Business Growth," featuring a donut chart and a bar chart to compare key business metrics across three companies, labeled Company A, Company B, and Company C.
The donut chart segments display percentages for three categories: Revenue, Average Order Value (AOV), and Conversion Rate for each company. The bar chart shows the actual values for these metrics, allowing for a direct comparison between the companies. Below each chart, there is placeholder text indicating where additional data or descriptions can be inserted.
Use Cases:
This type of slide is versatile and can be used across various industries for performance analysis, investor presentations, and internal reviews:
1. E-commerce:
Use: Comparing sales performance metrics.
Presenter: Sales Manager.
Audience: Marketing team, stakeholders.
2. Retail:
Use: Analyzing store-wise revenue and customer conversion rates.
Presenter: Retail Analyst.
Audience: Store managers, corporate executives.
3. Financial Services:
Use: Showcasing portfolio growth and investment conversions.
Presenter: Financial Advisor.
Audience: Clients, investment committee.
4. Technology:
Use: Demonstrating software product sales and license conversion rates.
Presenter: Product Manager.
Audience: Development team, salesforce.
5. Healthcare:
Use: Comparing revenue and patient conversion rates across clinics.
Presenter: Healthcare Administrator.
Audience: Healthcare providers, administrative staff.
6. Manufacturing:
Use: Reviewing product line revenues and market penetration rates.
Presenter: Operations Director.
Audience: Production managers, business analysts.
7. Education:
Use: Evaluating program revenues and student enrollment rates.
Presenter: Academic Coordinator.
Audience: Faculty, education board members.
43203311 style division donut 2 piece powerpoint presentation diagram template slide with all 5 slides:
Our Multiple Charts For Business Growth Presentation Images encourage convivial feelings. They help broaden consensus.
-
Good research work and creative work done on every template.
-
Out of the box and creative design.


