25915484 style essentials 2 financials 6 piece powerpoint presentation diagram infographic slide
Get involve in fruitful action with our Marketing Analytics Websites Powerpoint Topics. Be able to join the game.
- Google Slides is a new FREE Presentation software from Google.
- All our content is 100% compatible with Google Slides.
- Just download our designs, and upload them to Google Slides and they will work automatically.
- Amaze your audience with SlideTeam and Google Slides.
-
Want Changes to This PPT Slide? Check out our Presentation Design Services
- WideScreen Aspect ratio is becoming a very popular format. When you download this product, the downloaded ZIP will contain this product in both standard and widescreen format.
-

- Some older products that we have may only be in standard format, but they can easily be converted to widescreen.
- To do this, please open the SlideTeam product in Powerpoint, and go to
- Design ( On the top bar) -> Page Setup -> and select "On-screen Show (16:9)” in the drop down for "Slides Sized for".
- The slide or theme will change to widescreen, and all graphics will adjust automatically. You can similarly convert our content to any other desired screen aspect ratio.
Compatible With Google Slides

Get This In WideScreen
You must be logged in to download this presentation.
PowerPoint presentation slides
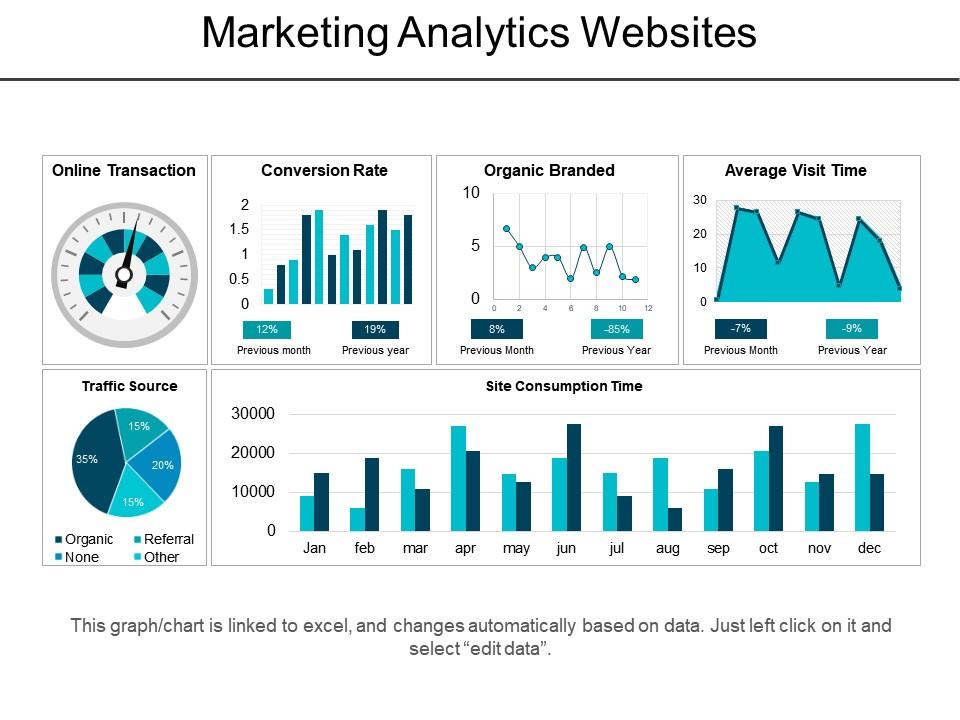
Presenting marketing analytics websites powerpoint topics. This is a marketing analytics websites powerpoint topics. This is a six stage process. The stages in this process are market analysis, marketing analytics, web analytics, marketing optimization.
Content of this Powerpoint Presentation
Description:
The image is a PowerPoint slide titled "Marketing Analytics Websites," which displays various graphical representations of data relevant to website performance and visitor engagement. The slide includes:
1. Online Transaction:
A gauge chart indicating the level of transactions completed online.
2. Conversion Rate:
A bar chart comparing the monthly and yearly conversion rates, with percentage changes.
3. Organic Branded:
A line graph showing the trend for organic branded searches or visits over a 12-month period, with percentage changes from the previous month and year.
4. Average Visit Time:
A mountain graph illustrating fluctuations in the average visit time on the site, also with percentage changes from the previous month and year.
5. Traffic Source:
A pie chart breaking down site traffic sources into categories: Organic, Referral, None, and Other.
6. Site Consumption Time:
A bar chart showing the time spent on the site each month over a year.
The note at the bottom of the slide states that the graphs/charts are linked to Excel and can be updated automatically with new data by selecting "edit data."
Use Cases:
This analytical approach is utilized across various industries for performance tracking and strategic planning:
1. E-commerce:
Use: Optimizing online sales funnels
Presenter: E-commerce Manager
Audience: Marketing Team
2. Healthcare:
Use: Analyzing patient engagement on health portals
Presenter: Digital Marketing Specialist
Audience: Healthcare Administrators
3. Real Estate:
Use: Tracking website leads for property listings
Presenter: Marketing Director
Audience: Real Estate Agents
4. Education:
Use: Measuring online course enrollment activities
Presenter: Admissions Marketing Coordinator
Audience: University Staff
5. Hospitality:
Use: Evaluating hotel booking conversions
Presenter: Revenue Manager
Audience: Hotel Management Team
6. Technology:
Use: Assessing user interaction with tech product websites
Presenter: UX Researcher
Audience: Product Managers
7. Finance:
Use: Understanding client engagement on financial service platforms
Presenter: Financial Analyst
Audience: Finance Executives
25915484 style essentials 2 financials 6 piece powerpoint presentation diagram infographic slide with all 5 slides:
Take advantage of your DNA with our Marketing Analytics Websites Powerpoint Topics. Display the brilliance in your genes.
-
Much better than the original! Thanks for the quick turnaround.
-
Illustrative design with editable content. Exceptional value for money. Highly pleased with the product.


