Business development and operational plan powerpoint presentation slides
If you are looking to grow your network and expanding your business, a perfect business strategy is all you need. Our business development and operational plan PowerPoint presentation slides help you defining the financial goals and methods that affect the business proposal. With the help of our pre-designed organizational improvement and operating strategy presentation, you can briefly explain your organizational day-to-day procedures and growth. Our professionally designed organizational development PPT includes templates like operations summary, operating challenges, company setup, strategic alliances, risk mitigation, current sources of revenue, company strategy, sales & marketing challenges, competitive roadmap and many more. But that’s not all. You can also work on related topics like corporate strategy, industry development, annual operating proposal, company’s task, development management, strategic controlling, innovation management, customer relationship administration etc. using this company growth PPT templates. Download this business development and operational plan PowerPoint presentation slides now and implement growth opportunities. Develop honourable individuals with our Business Development And Operational Plan Powerpoint Presentation Slides. It helps groom future citizens,
If you are looking to grow your network and expanding your business, a perfect
if(document.querySelectorAll(".pdp-description ").length > 0 ){
document.querySelector(".product-gallery-sub-title").classList.remove("content-trim");
var content = document.querySelector('.original_content').innerHTML;
var showChar = 500;
var ellipsestext = "..";
var moretext = "Read more";
var lesstext = " Read less";
resizePara(content);
window.addEventListener('resize', function() {
resizePara(content);
});
function resizePara(content) {
var windows_width = window.screen.width;
if (windows_width <= 1366 && windows_width > 768) {
showChar = 390;
} else if (windows_width <= 768 && windows_width > 500) {
showChar = 275;
} else if (windows_width <= 500) {
showChar = 125;
} else {
document.querySelector('.product-gallery-sub-title').innerHTML = content;
}
if (content.length > showChar && windows_width<=1366 ) {
var c = content.substr(0, showChar - 1);
var h = content.substr(showChar - 1, content.length - showChar);
var html = c + '' + ellipsestext + ' ' + h + '' + moretext + '';
document.querySelector('.product-gallery-sub-title').innerHTML = html;
document.querySelector('.product-gallery-sub-title.for_mobile').innerHTML = html;
}
};
}
Want Changes to This PPT Slide? Check out our Presentation Design Services
You must be logged in to download this presentation.
Pre-designed 80 slides making it a complete deck. This presentation is 100% editable. Easily to download presentations. High-resolution slides. Compatibility with google slides helps the presenter. This PPT can be easily converted to PDF formats. Our presentation visuals can be used by company professionals, testers, designers and project manager. These templates can be shown in standard and widescreen. Slide 1: This slide introduces Business Development & Operational Plan. State your company name here. God is in the details for our Business Development And Operational Plan Powerpoint Presentation Slides. Ensure each one gets appropriate coverage.
Compatible With Google Slides

Get This In WideScreen

PowerPoint presentation slides
Content of this Powerpoint Presentation
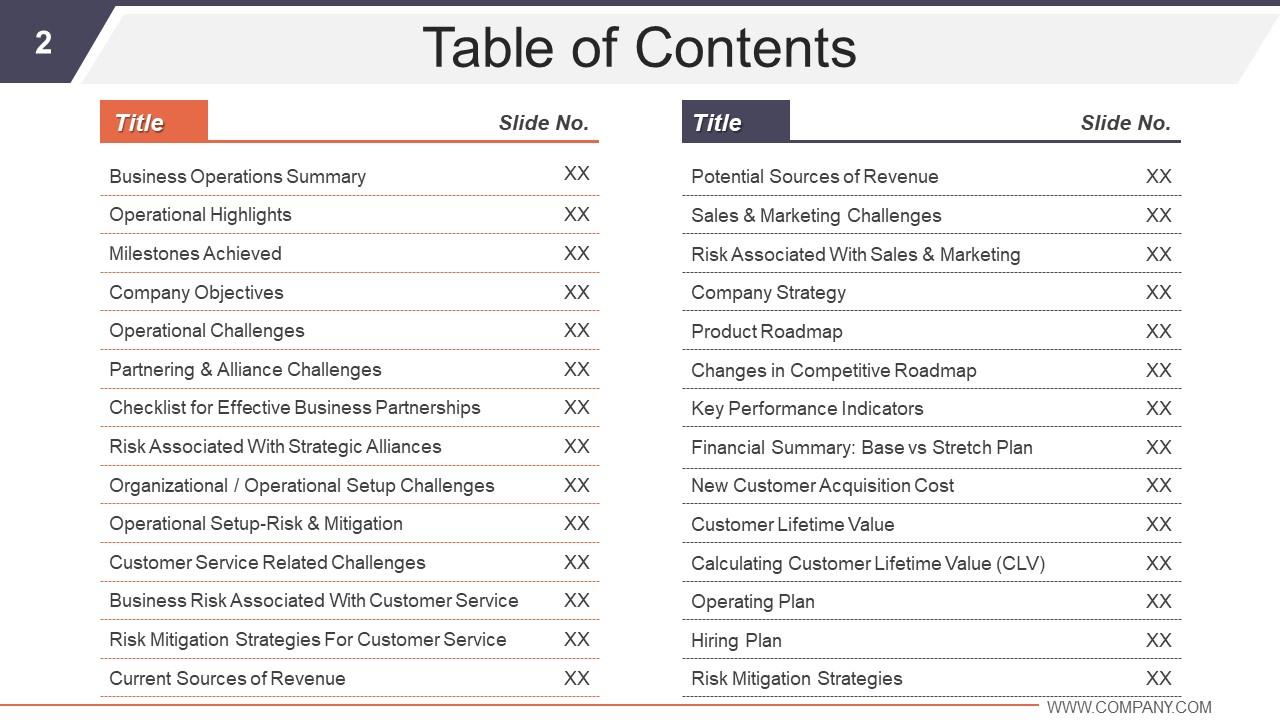
Slide 2: This slide presents Table of Contents with its title.
Slide 3: This is Our Agenda slide to state your agenda, purpose etc.
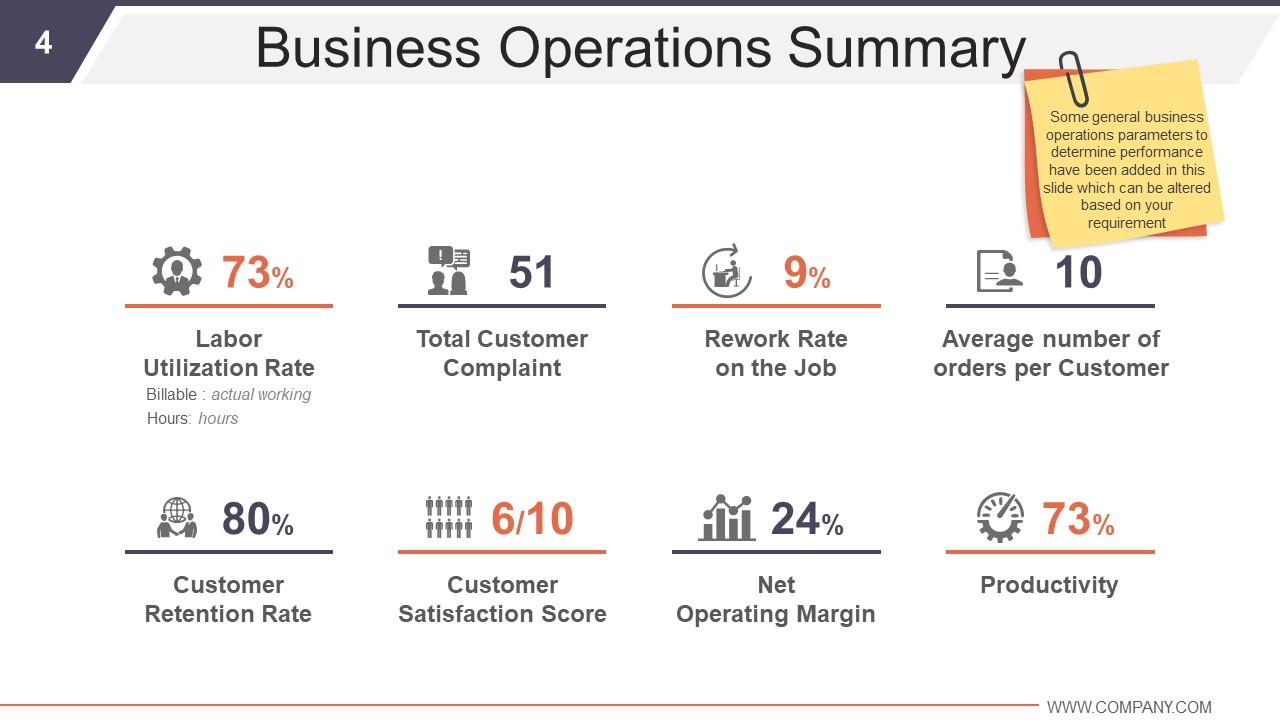
Slide 4: This slide states Business Operations Summary. Some general business operations parameters to determine performance have been added in this slide which can be altered based on your requirement.
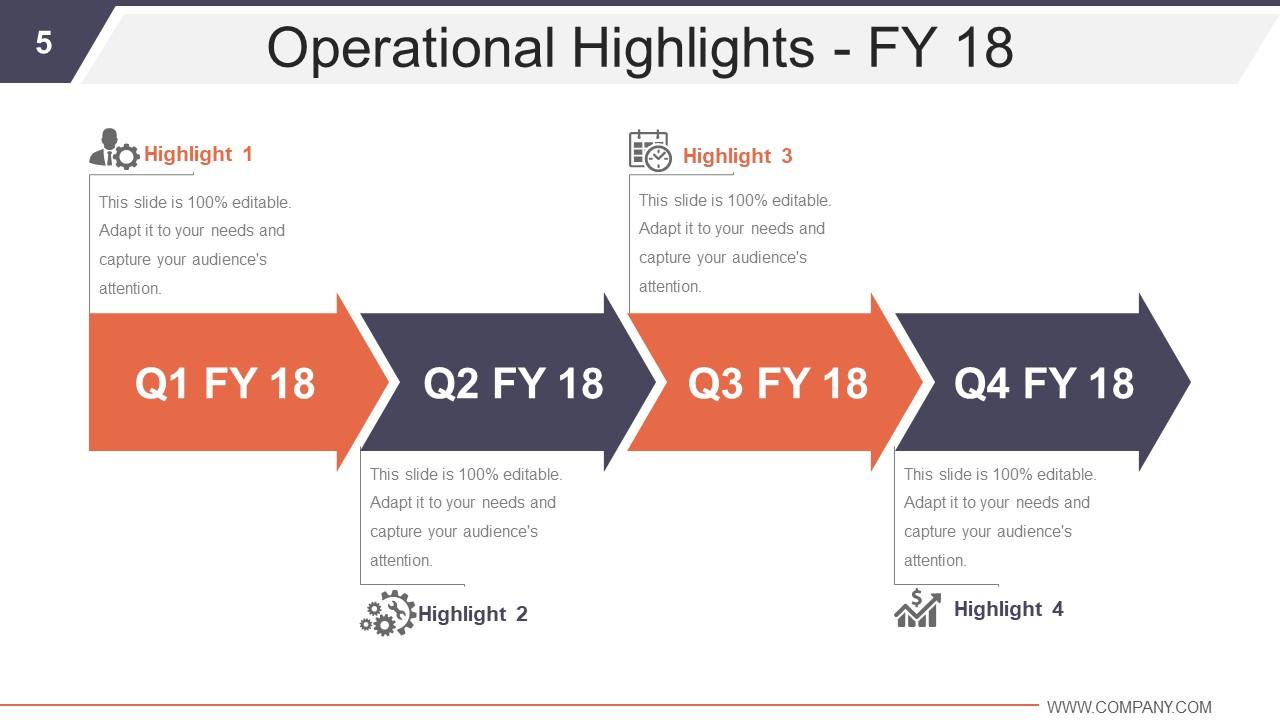
Slide 5: This slide presents Operational Highlights with arrow imagery. State your highlights here.
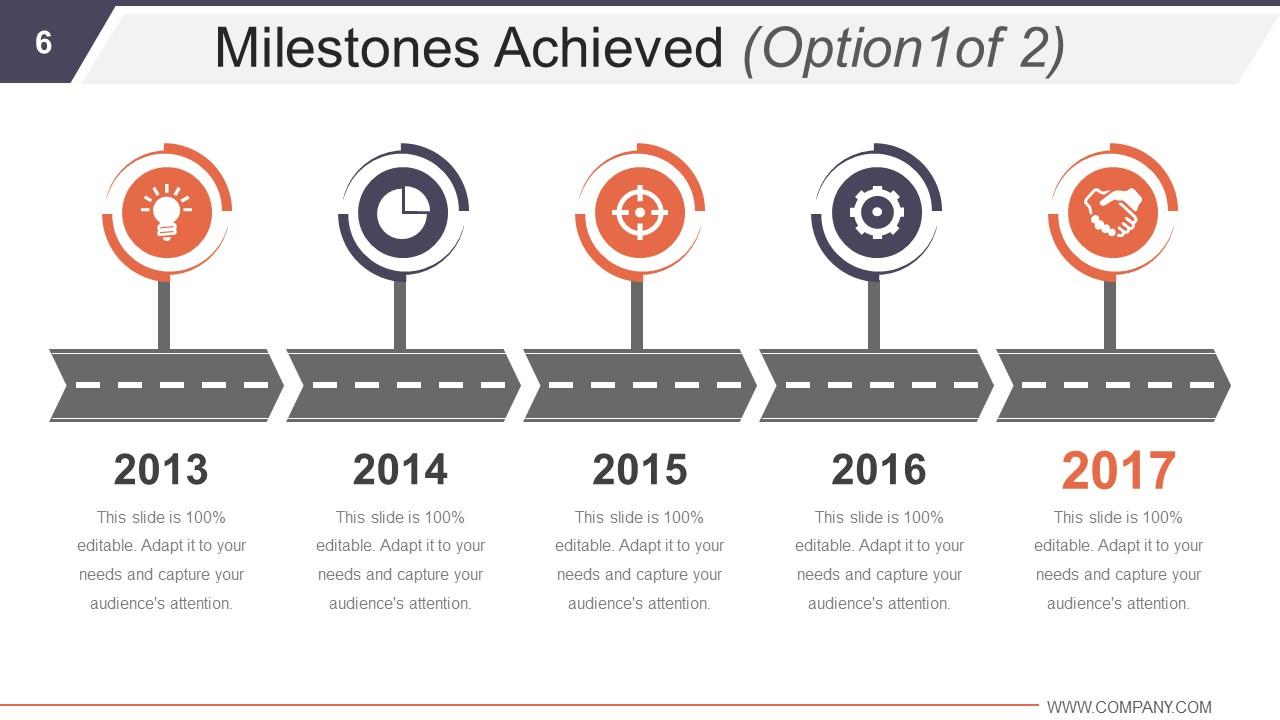
Slide 6: This is Milestones Achieved slide presented with a timeline. You can edit/ modify the contents as per need.
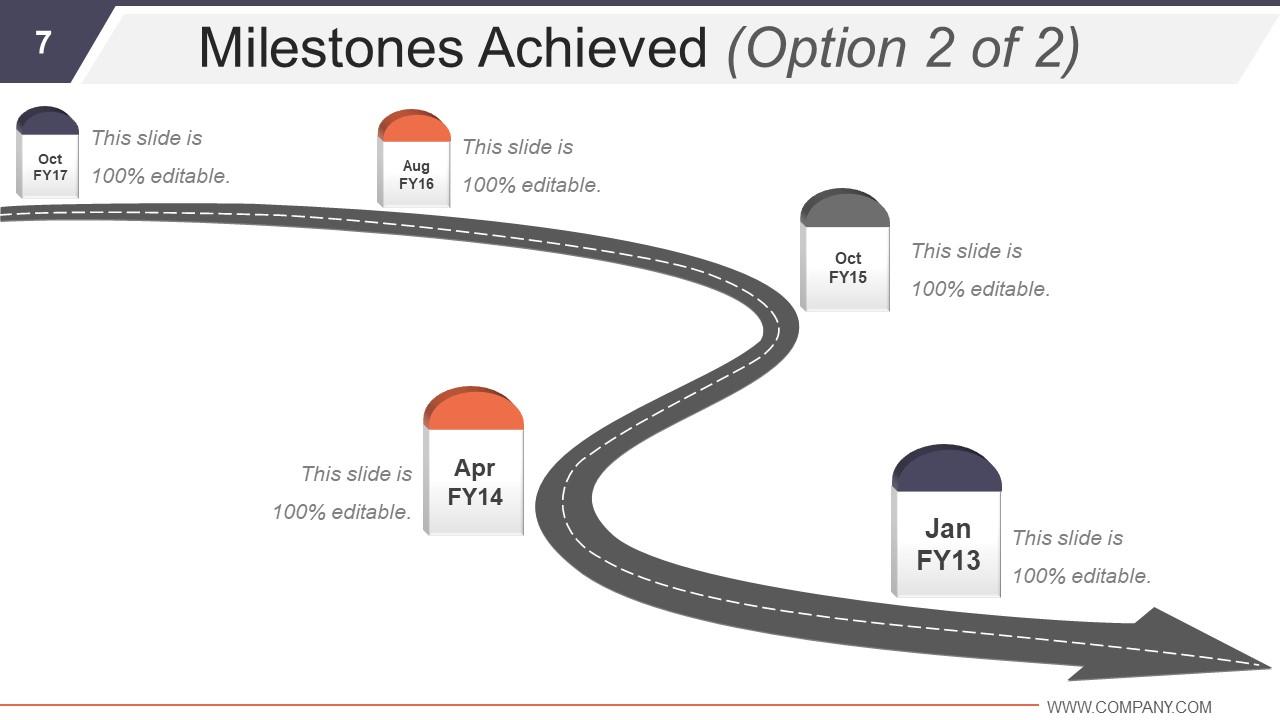
Slide 7: This is another Milestones Achieved slide presented with a roadmap.
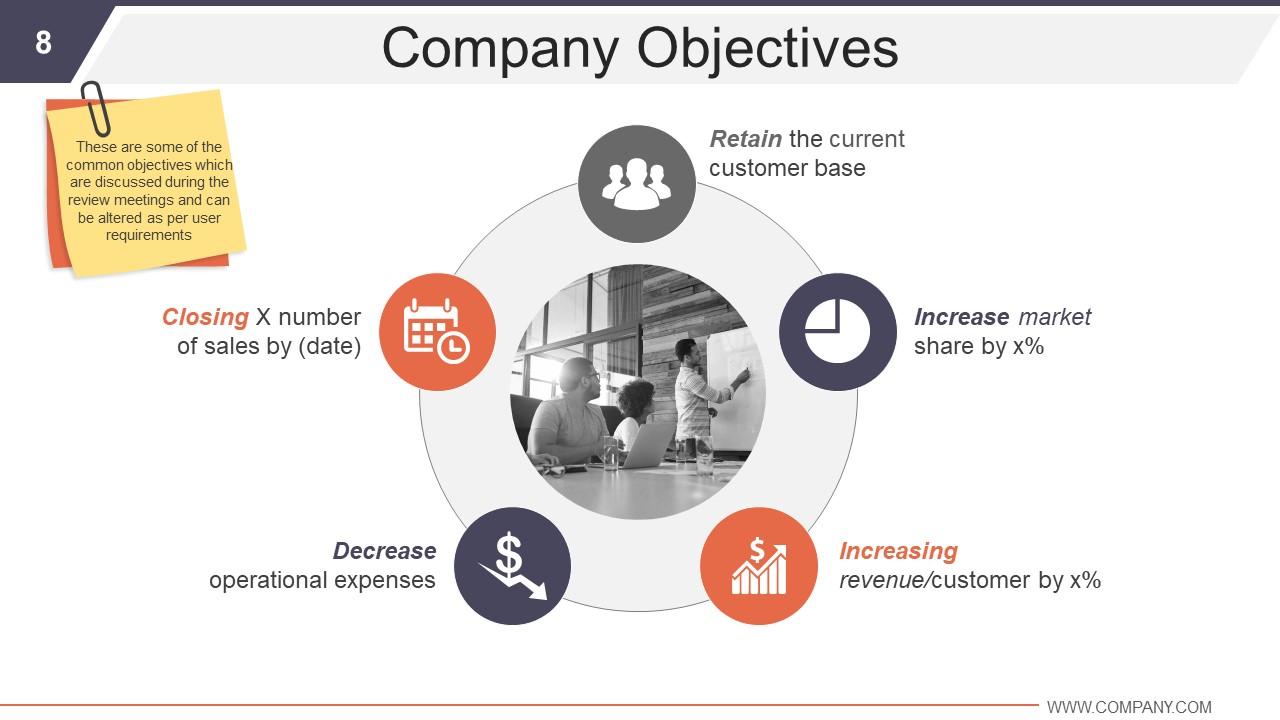
Slide 8: This slide states Company Objectives with circular image. They are- Retain the current customer base, Increase market share, Increasing revenue/customer, Decrease operational expenses, Closing number of sales. these are some of the common objectives which are discussed during the review meetings and can be altered as per user requirements
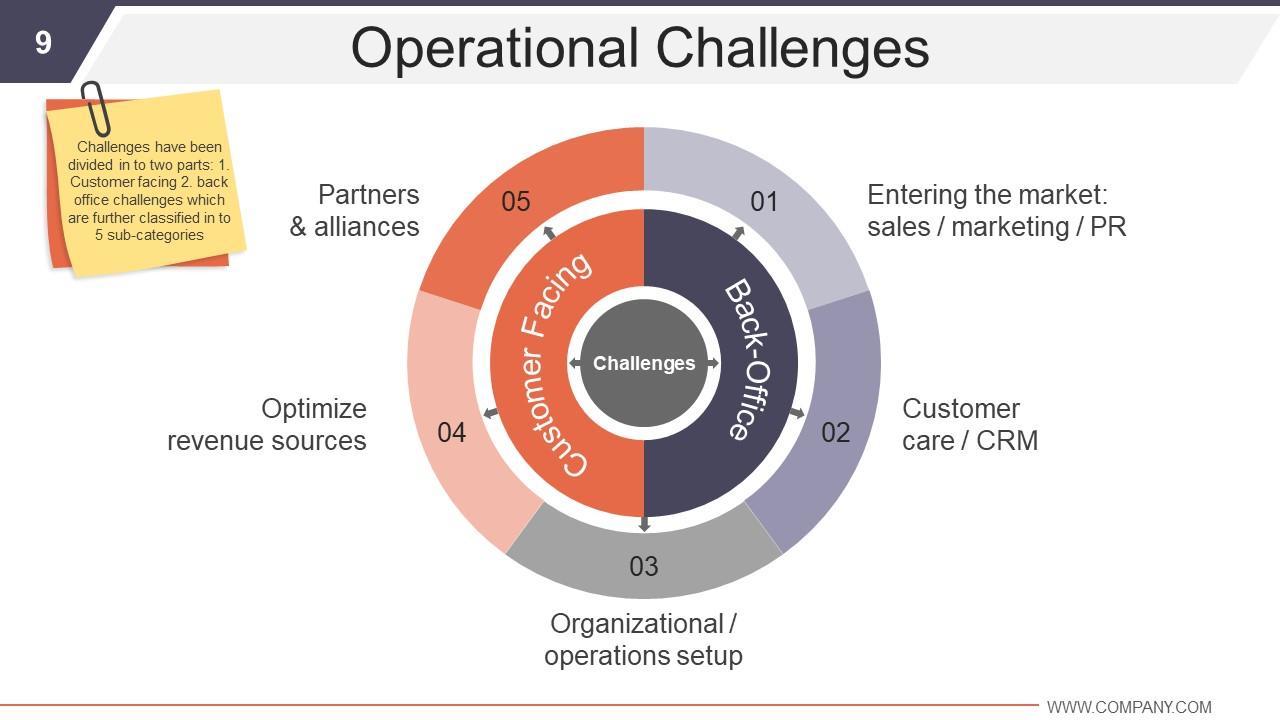
Slide 9: This slide showcases Operational Challenges. Challenges have been divided in to two parts: 1. Customer facing 2. back office challenges which are further classified in to 5 sub-categories. You can alter/ edit as per need.
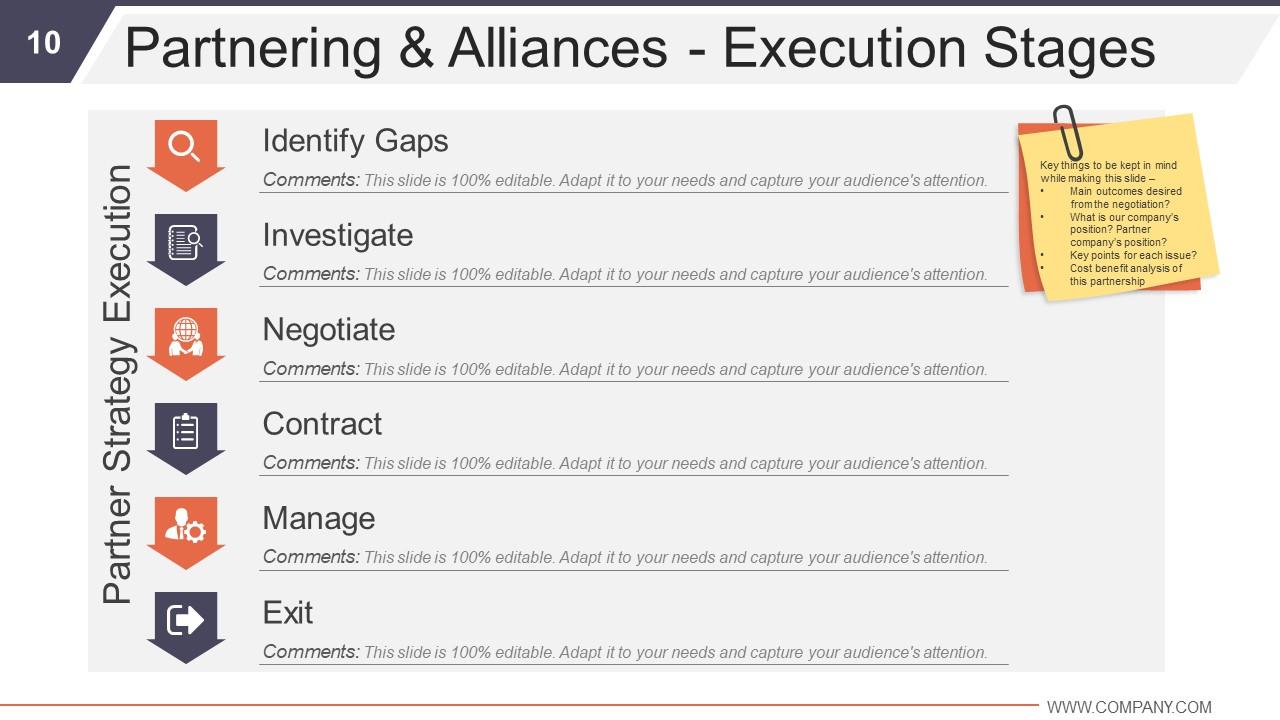
Slide 10: This is Partnering & Alliances slide. The various Execution Stages showcased are- Identify Gaps, Investigate, Negotiate, Contract, Manage, Exit.
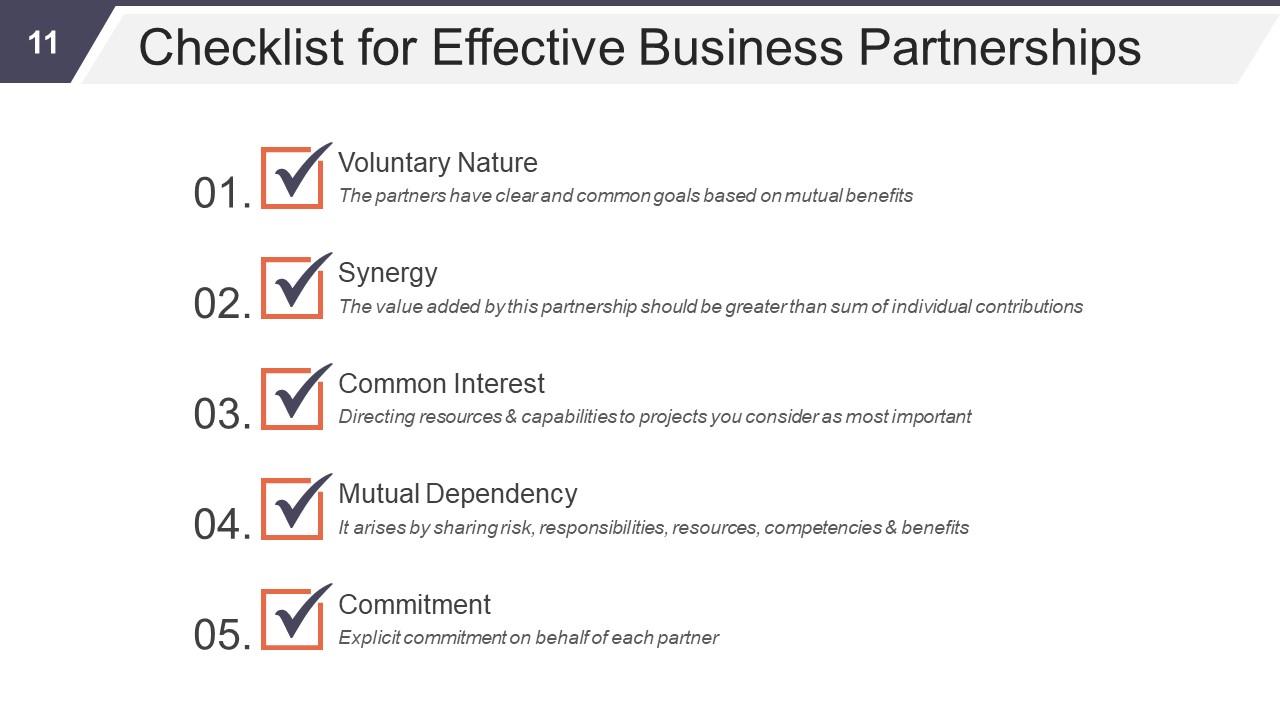
Slide 11: This slide presents a Checklist for Effective Business Partnerships.
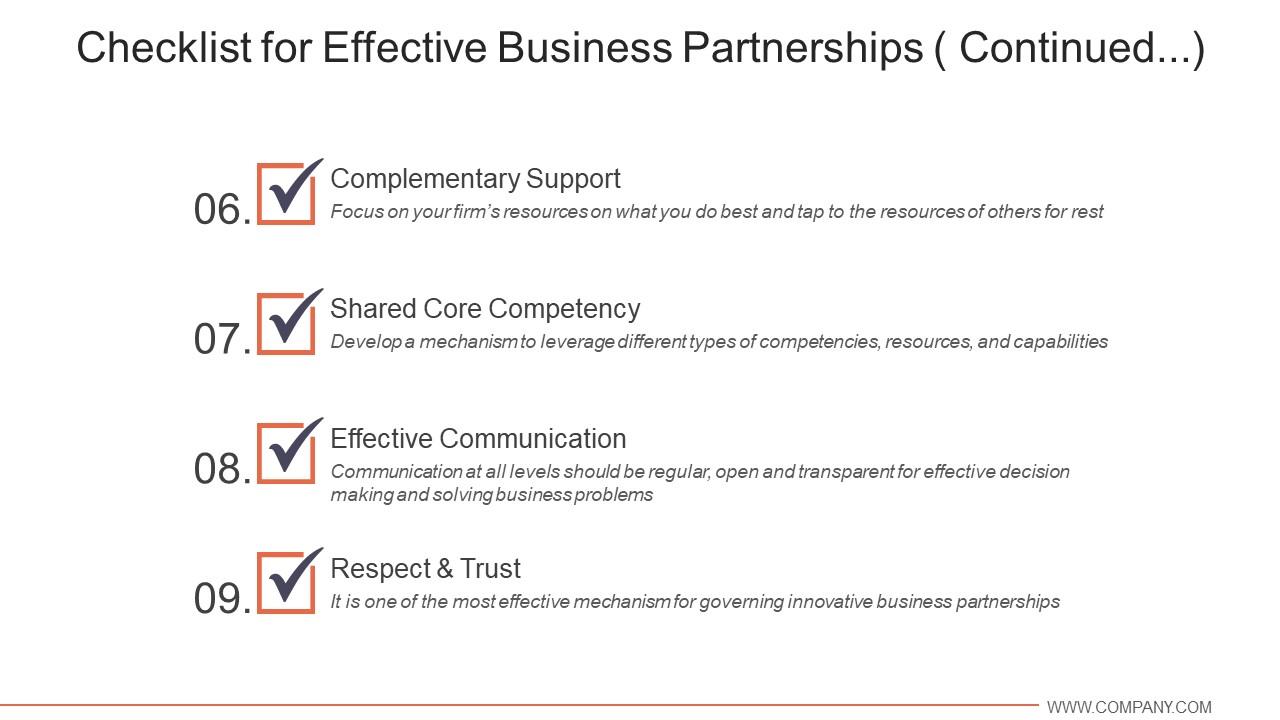
Slide 12: This is another Checklist for Effective Business Partnerships slide.
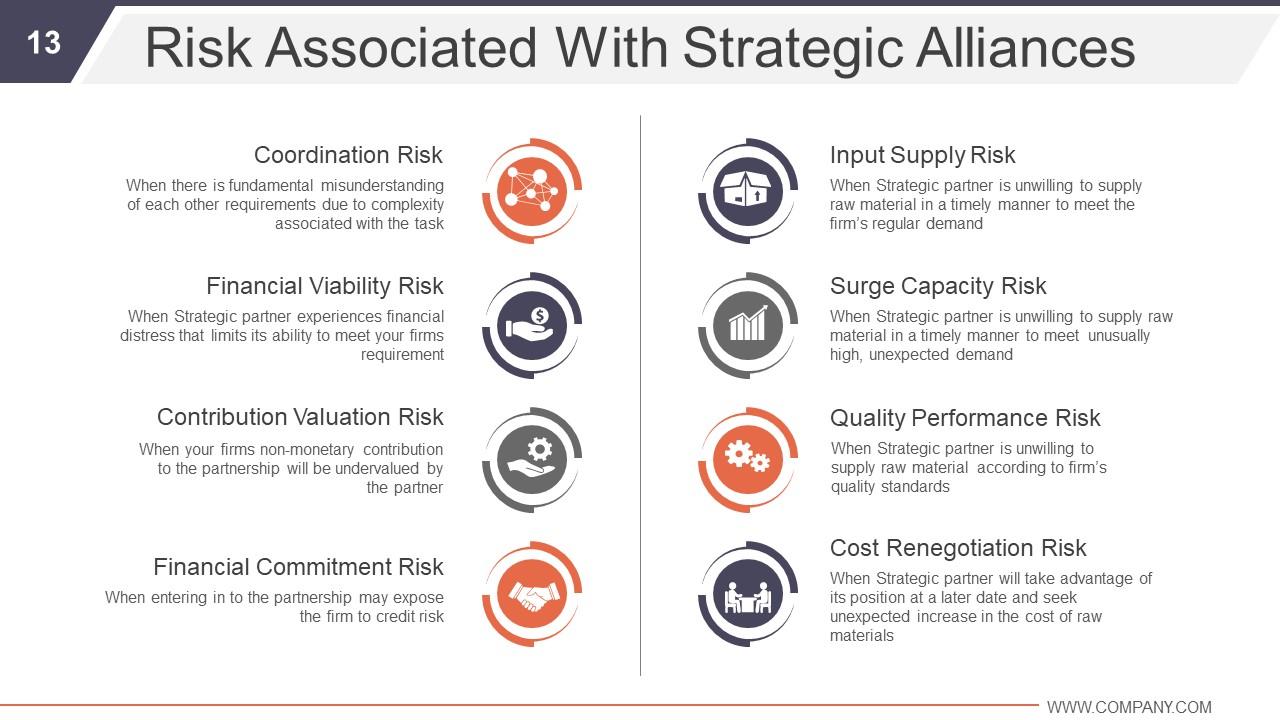
Slide 13: This slide states Risk Associated With Strategic Alliances with their names and respective icons.
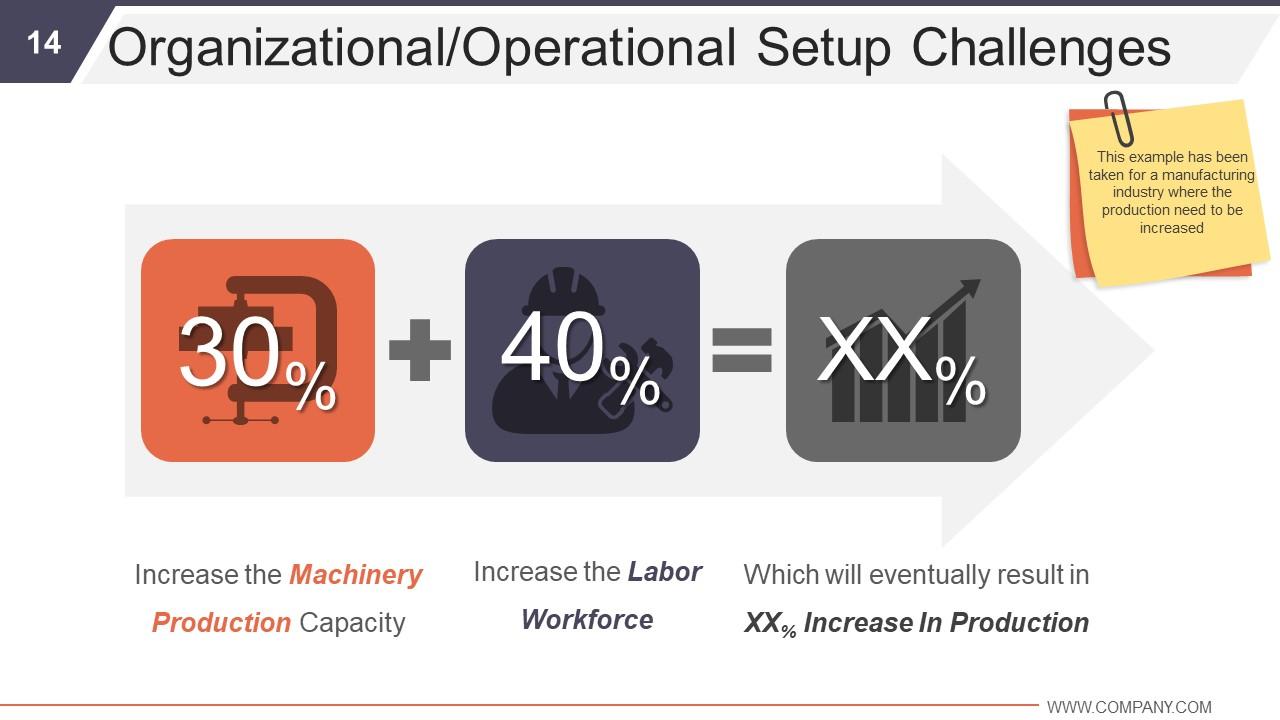
Slide 14: This slide showcases Organizational/Operational Setup Challenges. You can add your own example here.
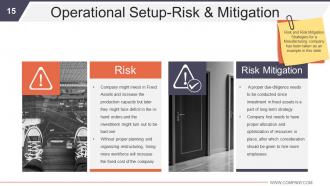
Slide 15: This slide showcases Operational Setup-Risk & Mitigation. Risk and Risk Mitigation Strategies for a Manufacturing company has been taken as an example in this slide. You can add your own example instead.
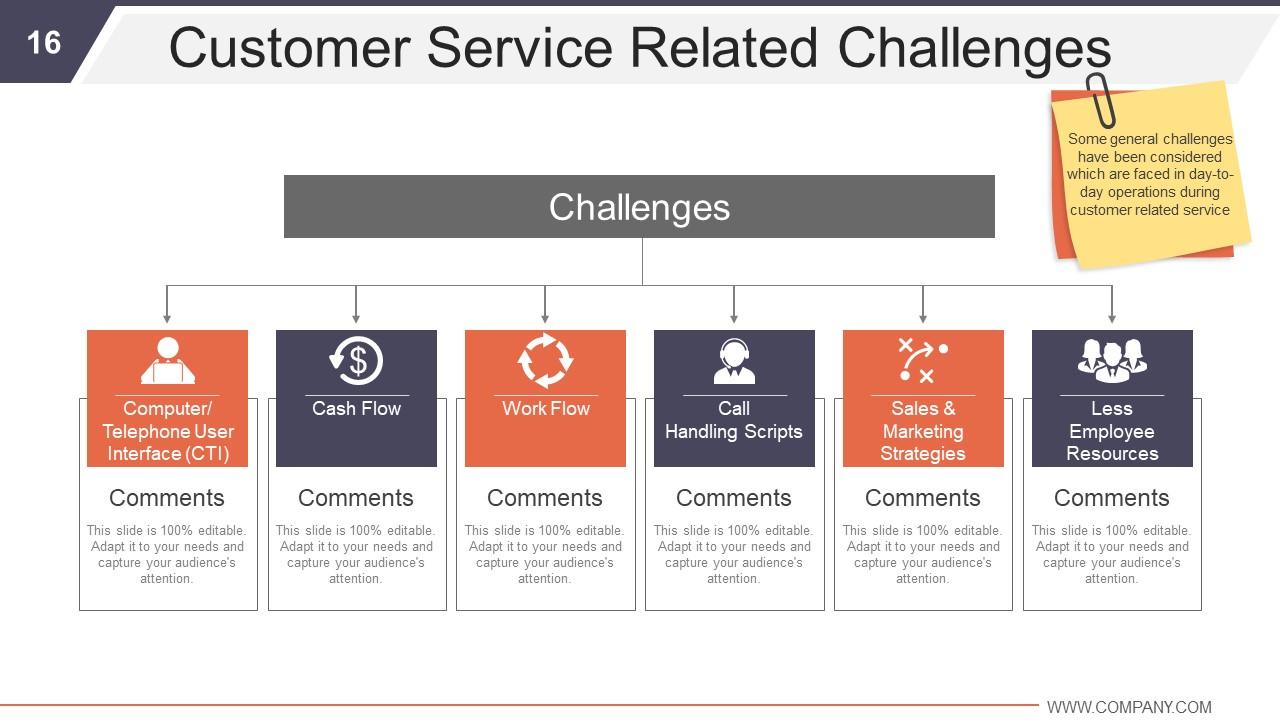
Slide 16: This slide states Customer Service Related Challenges. Some general challenges have been considered which are faced in day-to-day operations during customer related service in this slide.
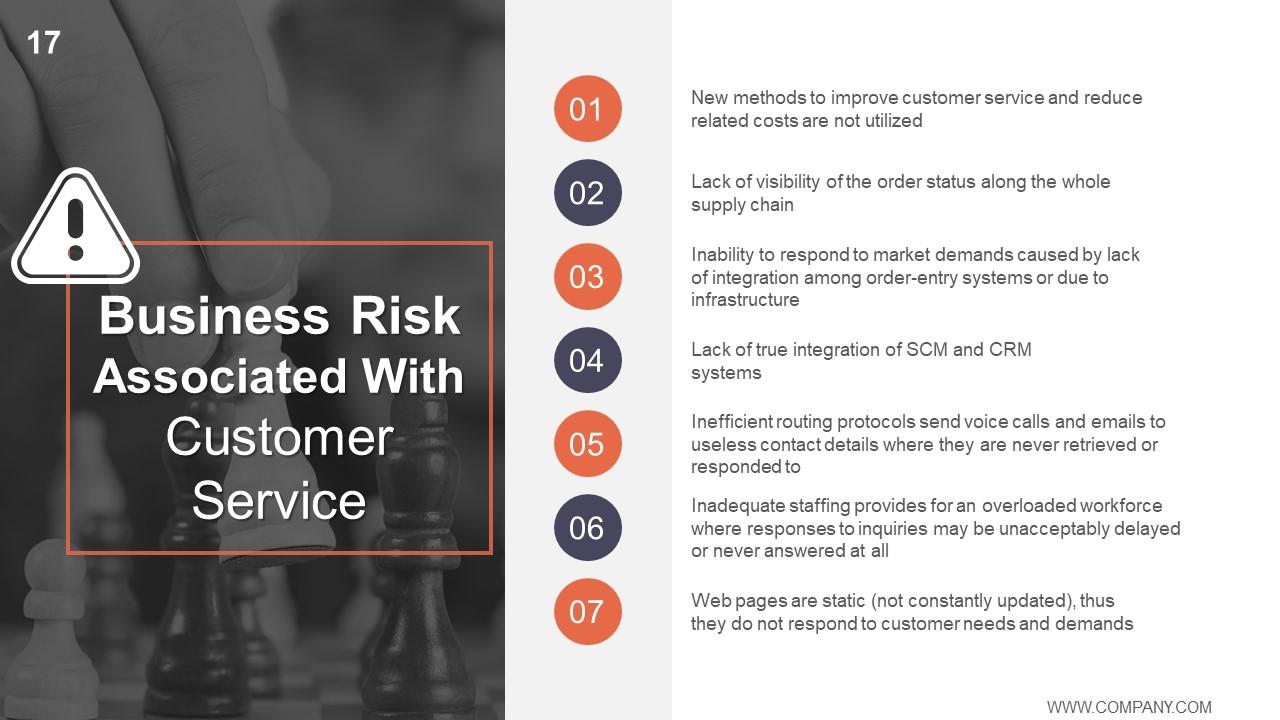
Slide 17: This slide showcases Business Risk Associated With Customer Service.
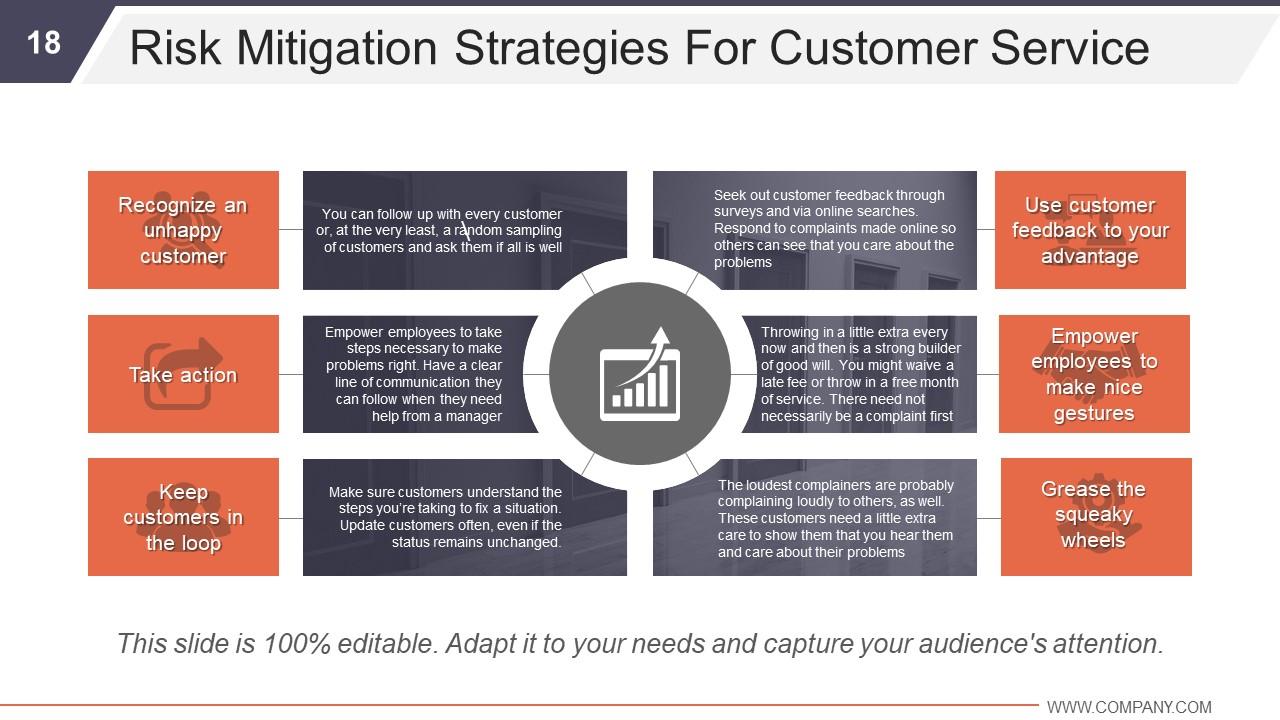
Slide 18: This slide presents Risk Mitigation Strategies For Customer Service.
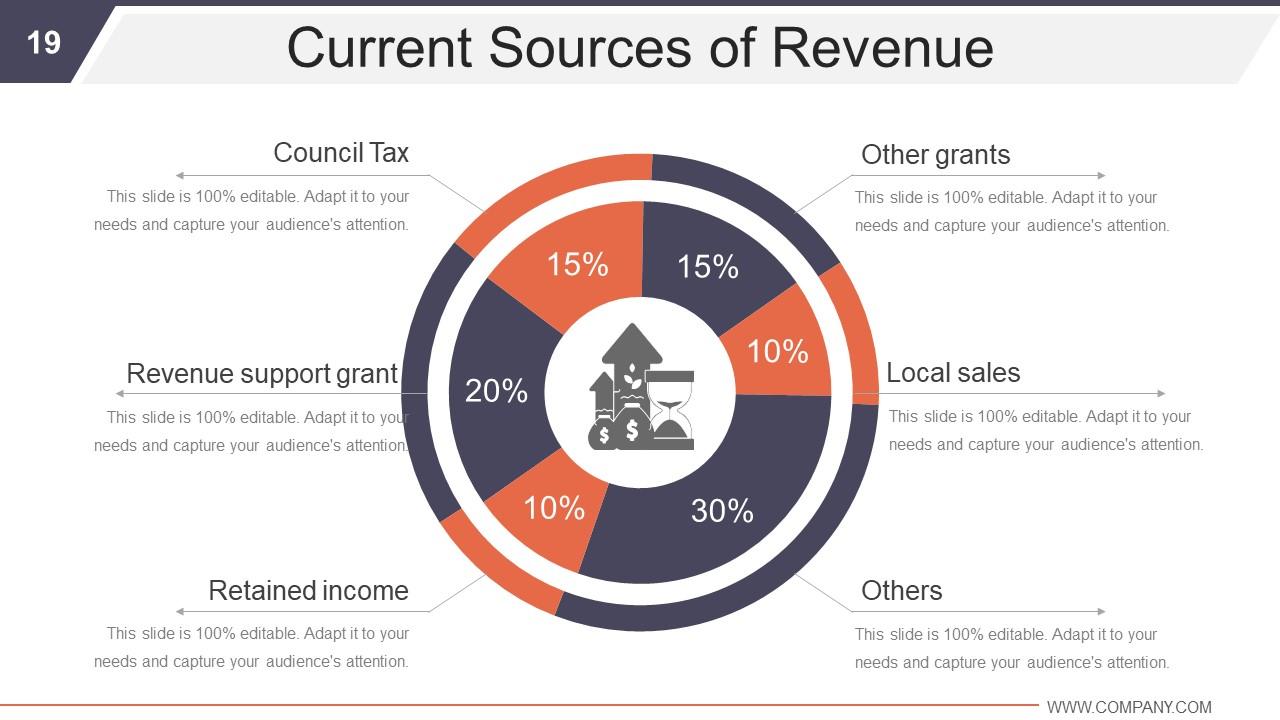
Slide 19: This slide presents Current Sources of Revenue in pie chart form. These include- Revenue support grant, Council Tax, Retained income, Other grants, Local sales, Others.
Slide 20: This is Coffee Break image slide for a halt. You may change the slide content as per need.
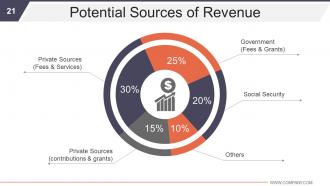
Slide 21: This slide showcases Potential Sources of Revenue with a pie chart/ graph. These include- Social Security, Government (Fees & Grants), Others, Private Sources (contributions & grants), Private Sources (Fees & Services).
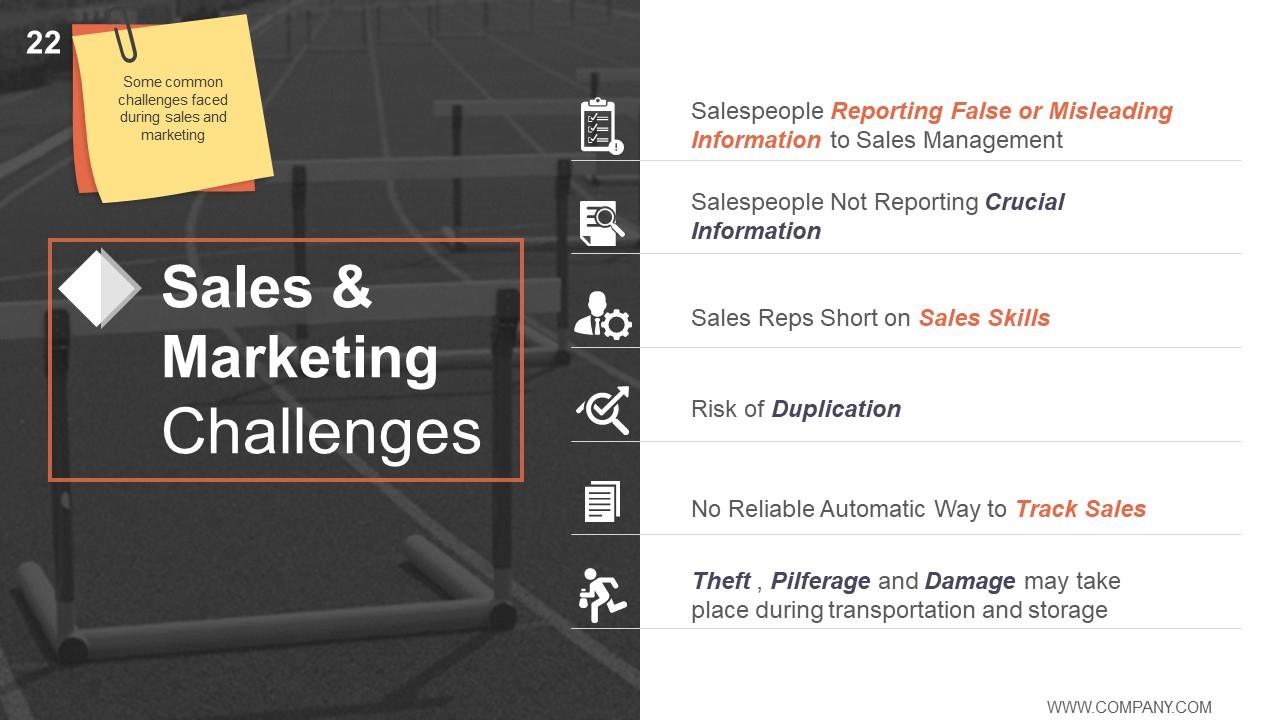
Slide 22: This slide displays Sales & Marketing Challenges.
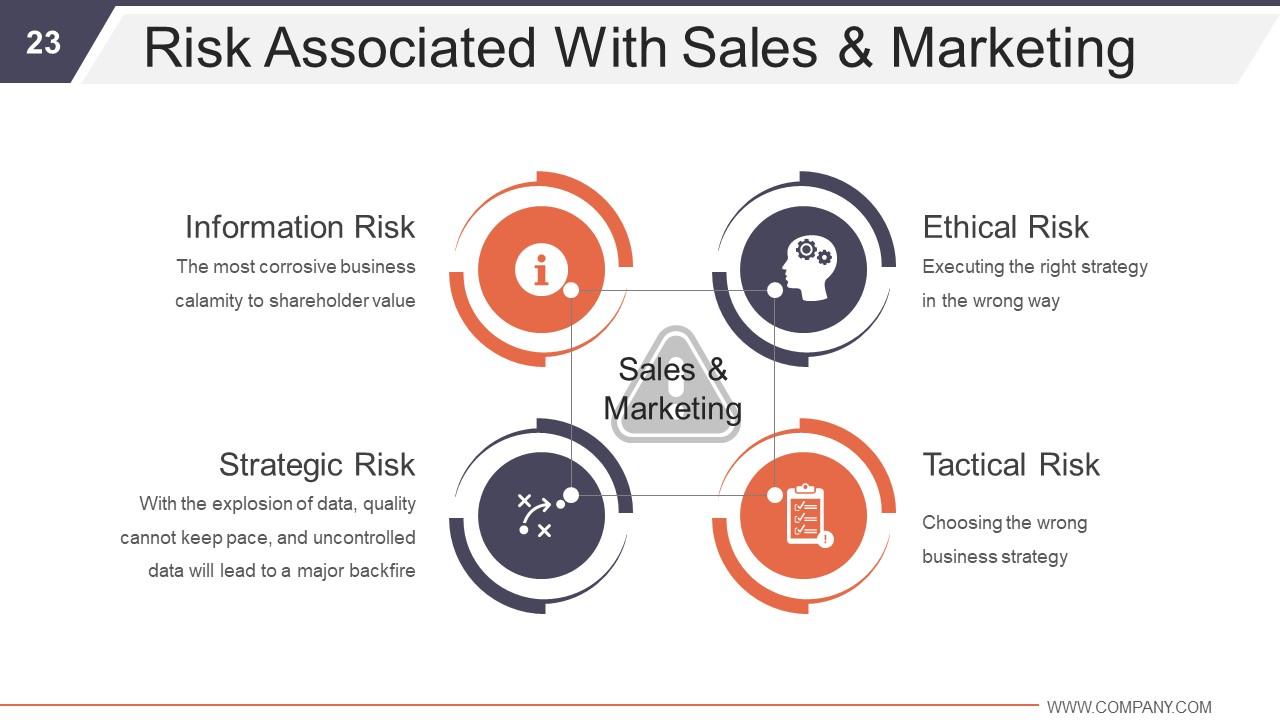
Slide 23: This slide states Risk Associated With Sales & Marketing with a circular diagram image showing- Tactical Risk, Ethical Risk, Strategic Risk, Information Risk.
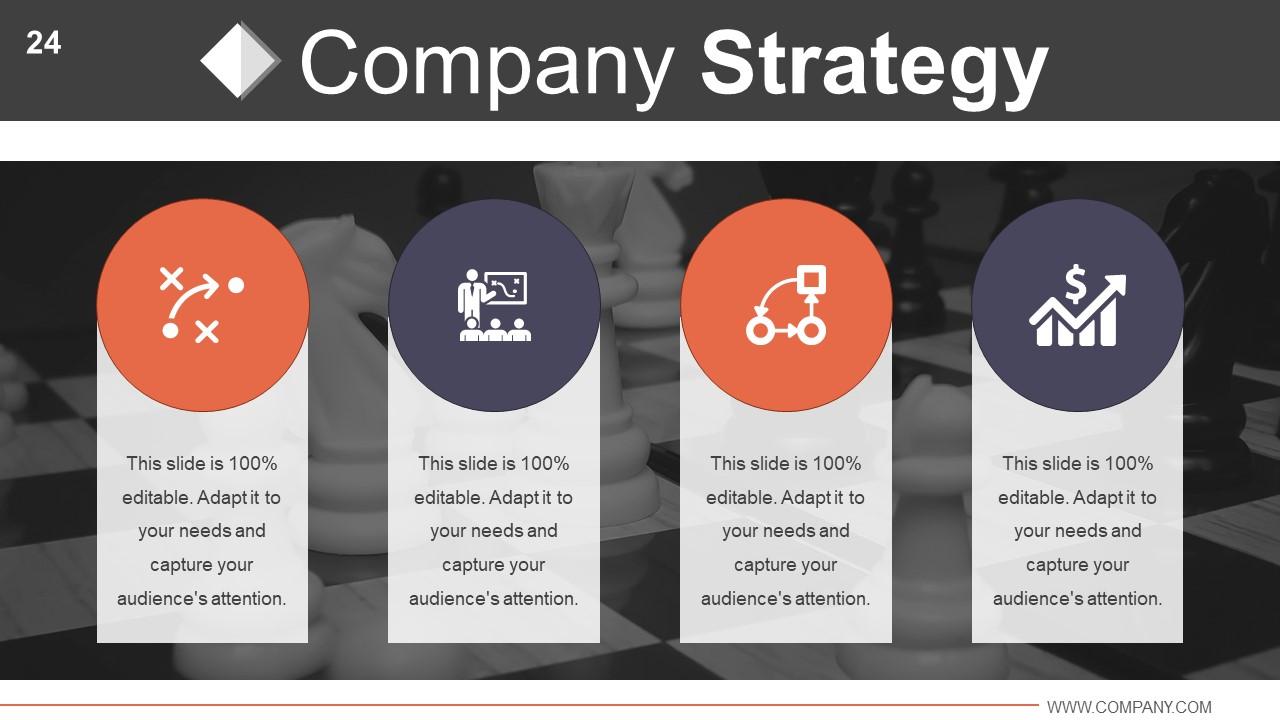
Slide 24: This slide presents Company Strategy with their respective icons.
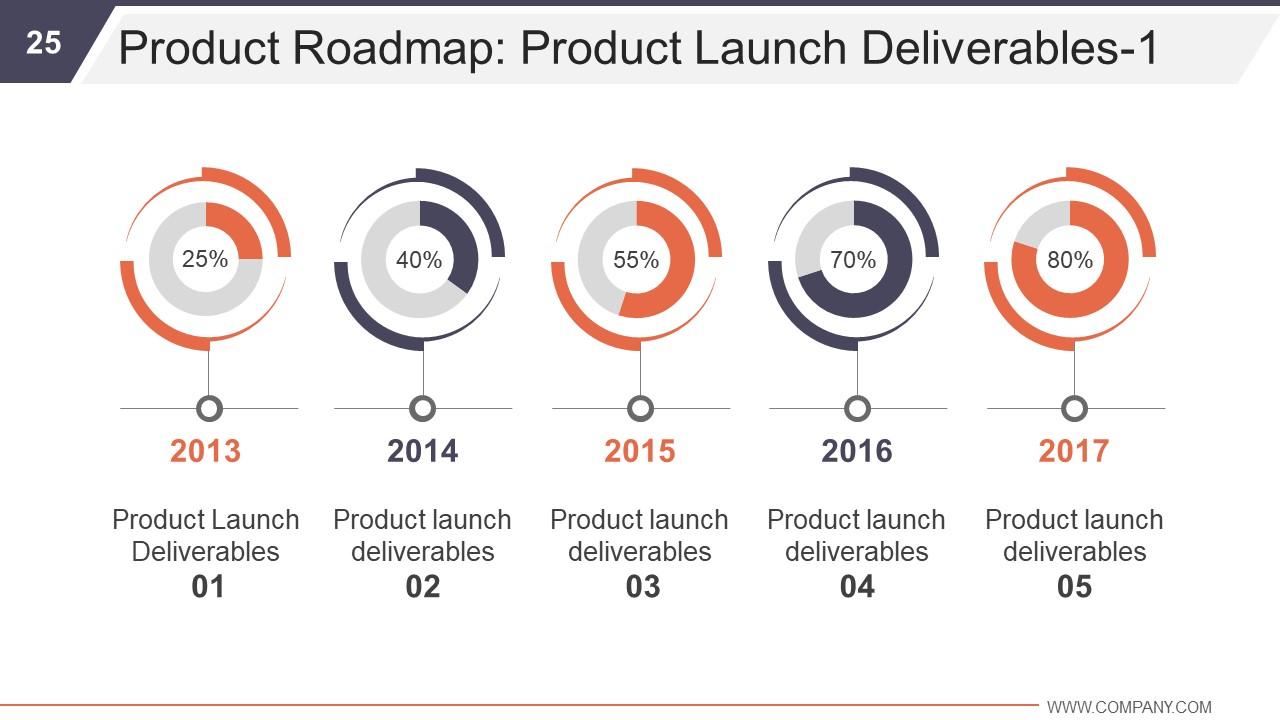
Slide 25: This is Product Roadmap: Product Launch Deliverables slide with circular images.
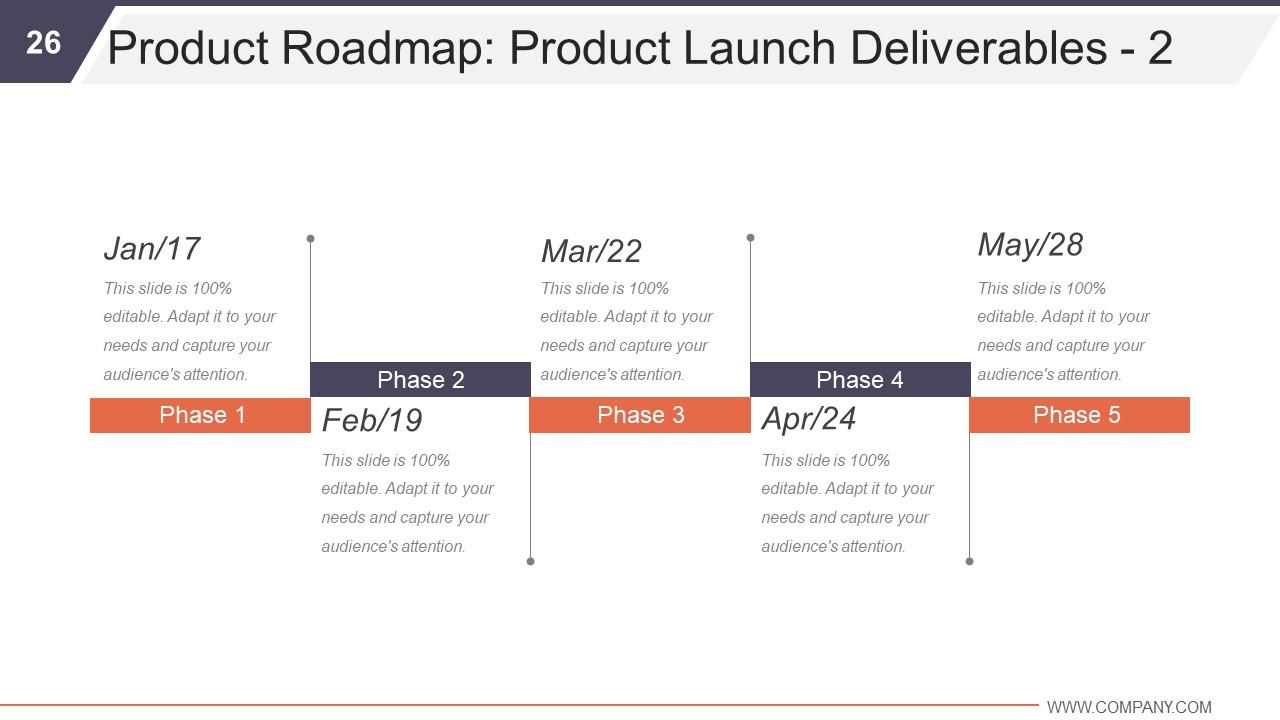
Slide 26: This is yet another Product Roadmap: Product Launch Deliverables slide presented with a timeline.
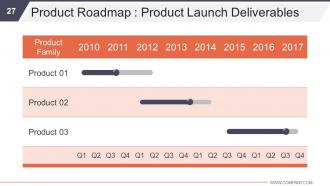
Slide 27: This too is a Product Roadmap : Product Launch Deliverables slide.
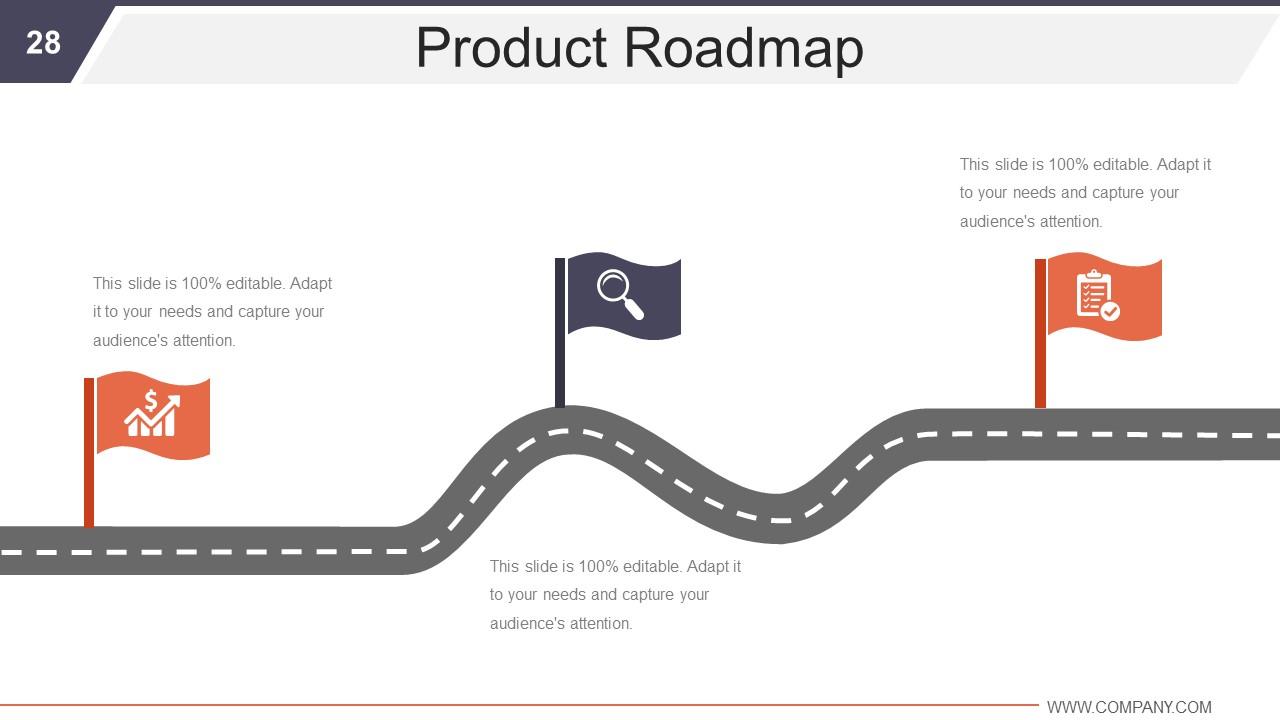
Slide 28: This slide showcases Product Roadmap with flags and icon imagery.
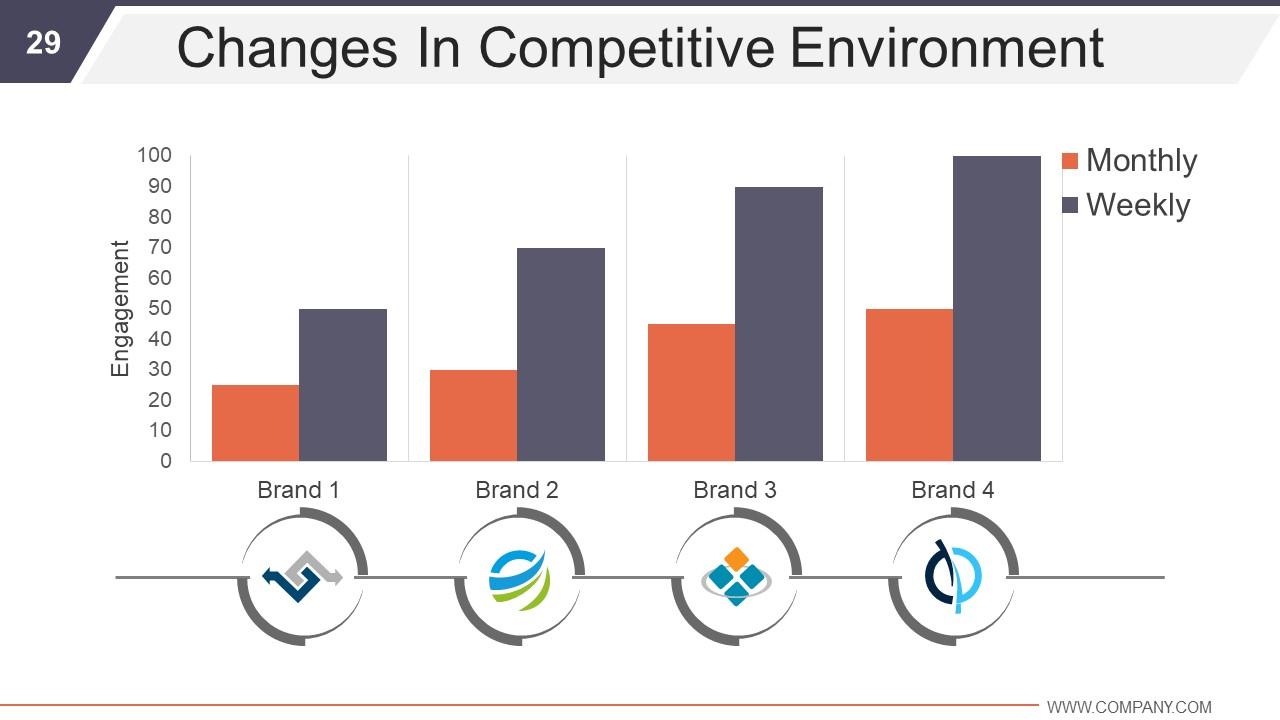
Slide 29: This slide presents Changes In Competitive Environment in a bar graph/ chart form.
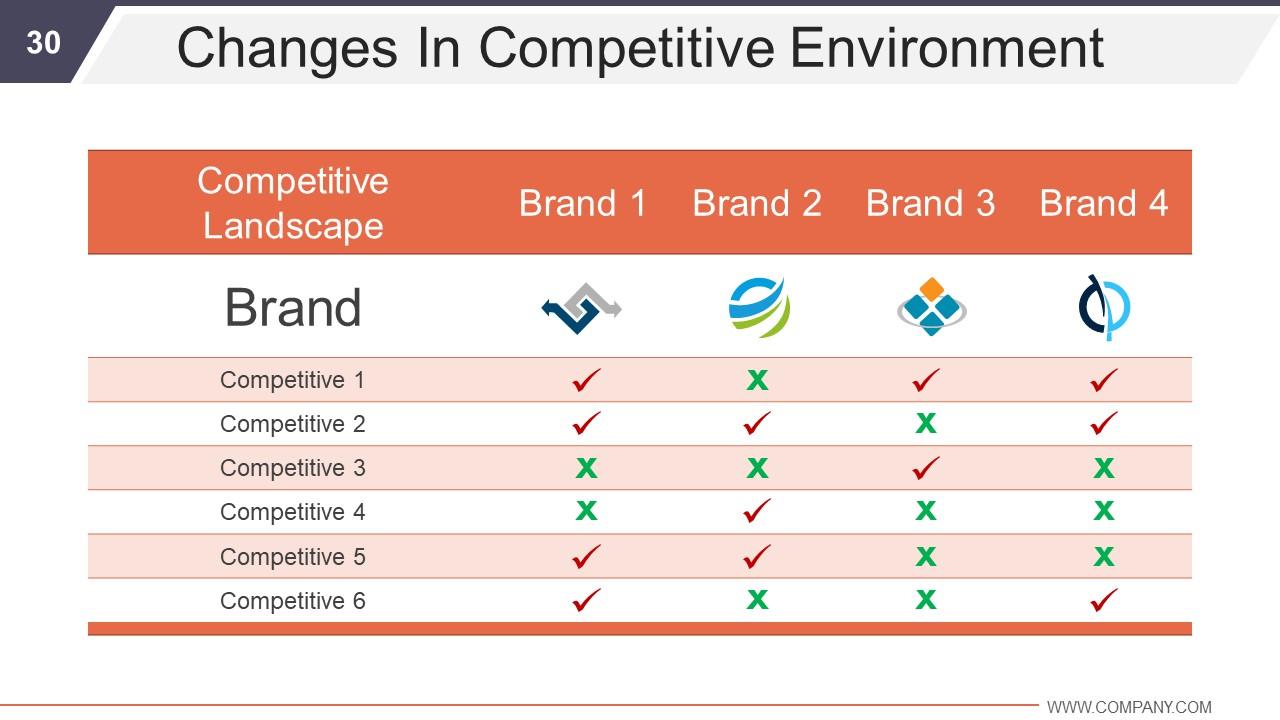
Slide 30: This is yet another Changes In Competitive Environment slide showcased in a tabular form.
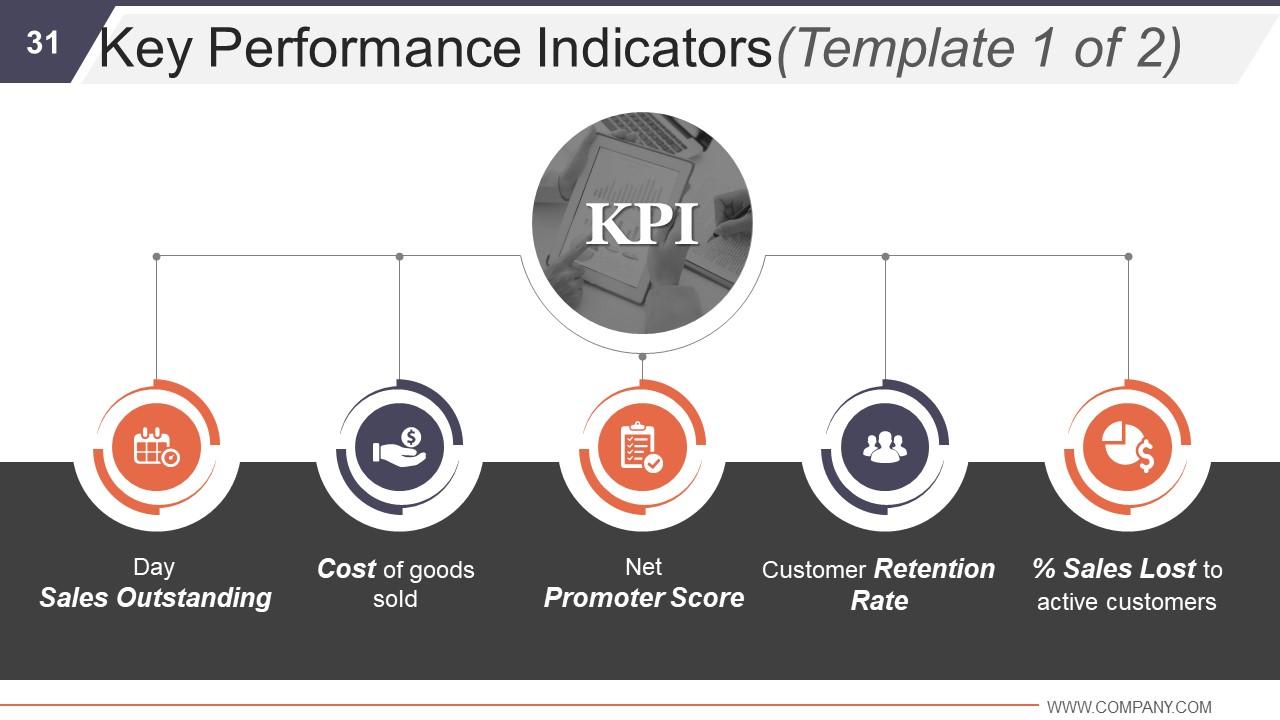
Slide 31: This slide showcases Key Performance Indicators consisting of- Sales Outstanding, Net Promoter Score, Customer Retention Rate, Cost of goods sold, % Sales Lost to active customers.
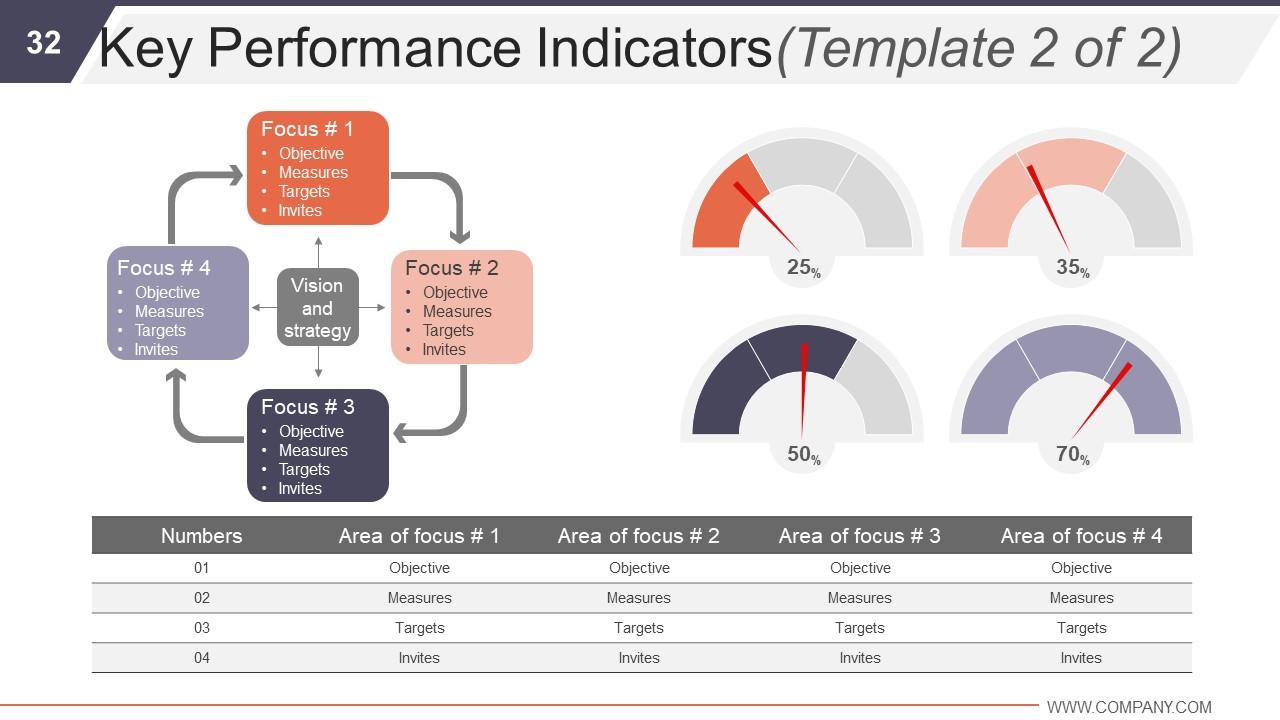
Slide 32: This is another Key Performance Indicators slide.
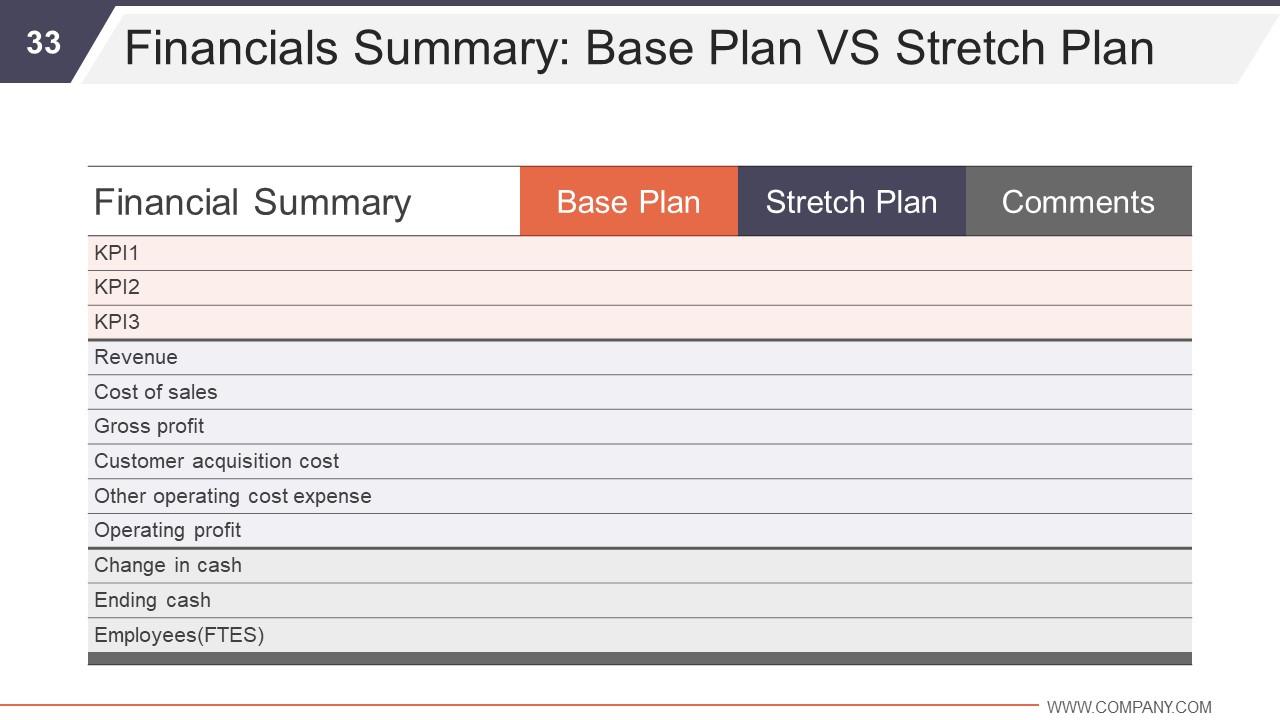
Slide 33: This slide states Financials Summary: Base Plan VS Stretch Plan.
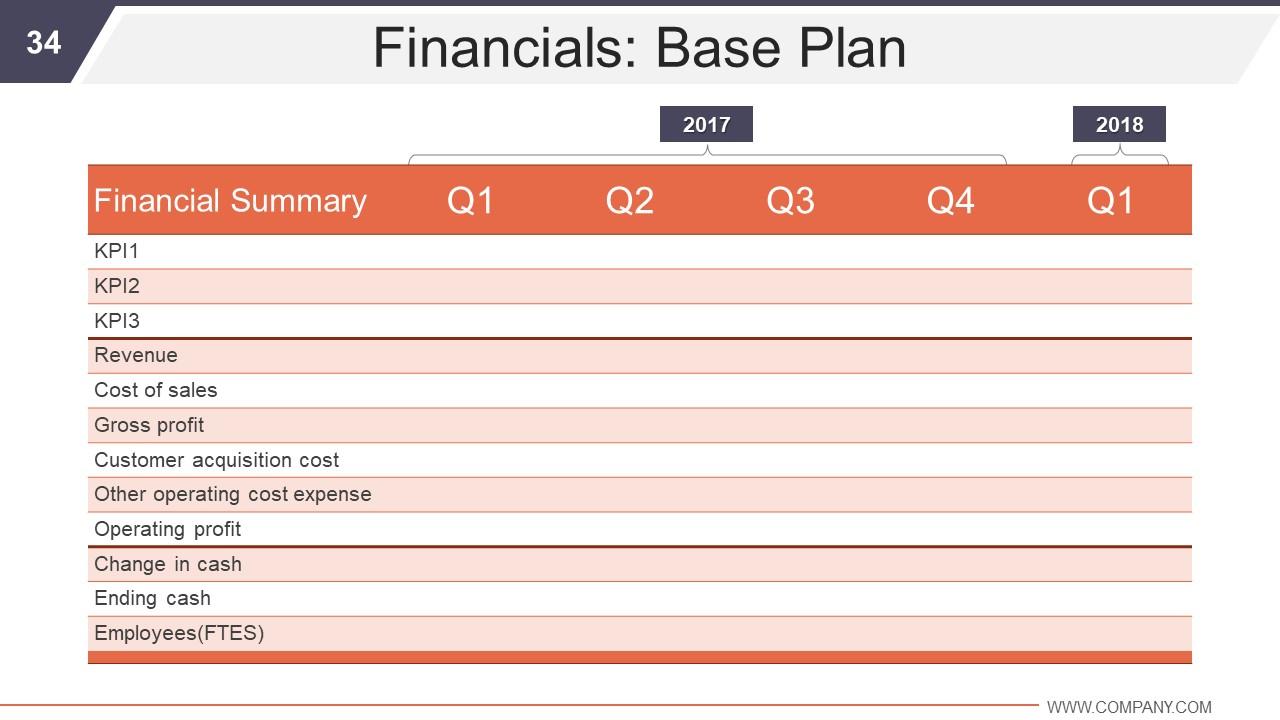
Slide 34: This slide showcases Financials: Base Plan in tabular form.
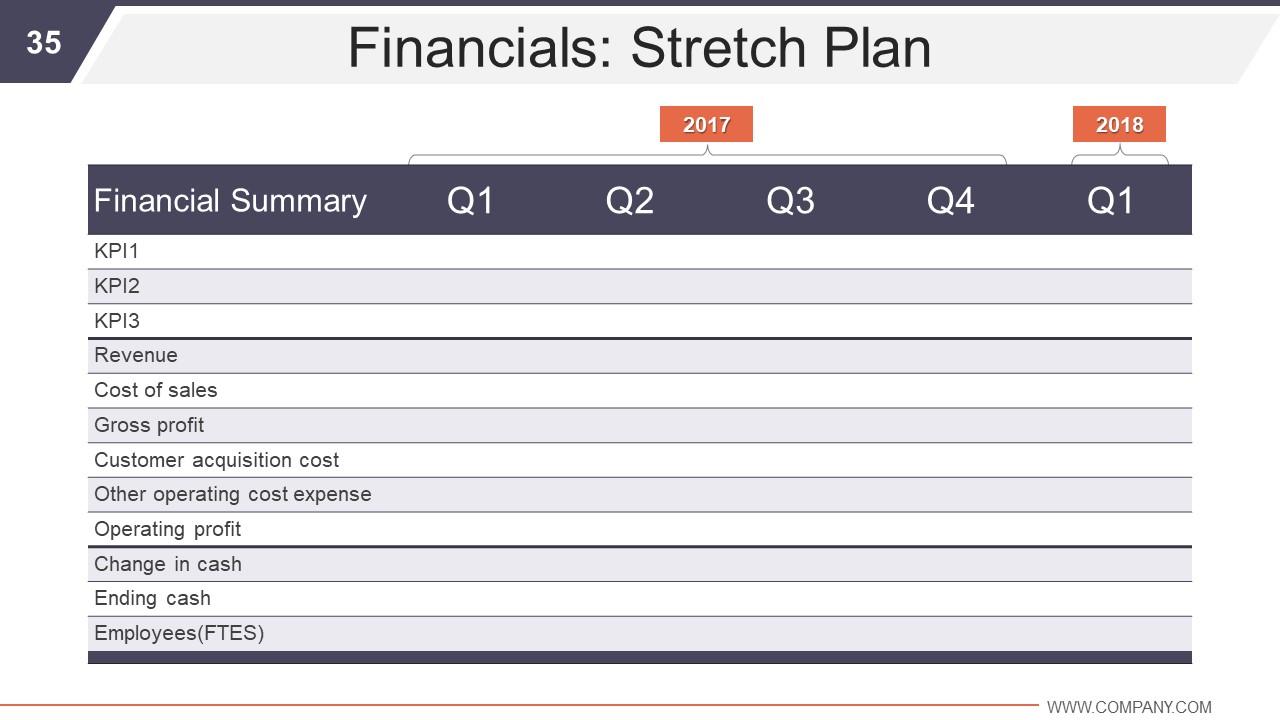
Slide 35: This slide states Financials: Stretch Plan.
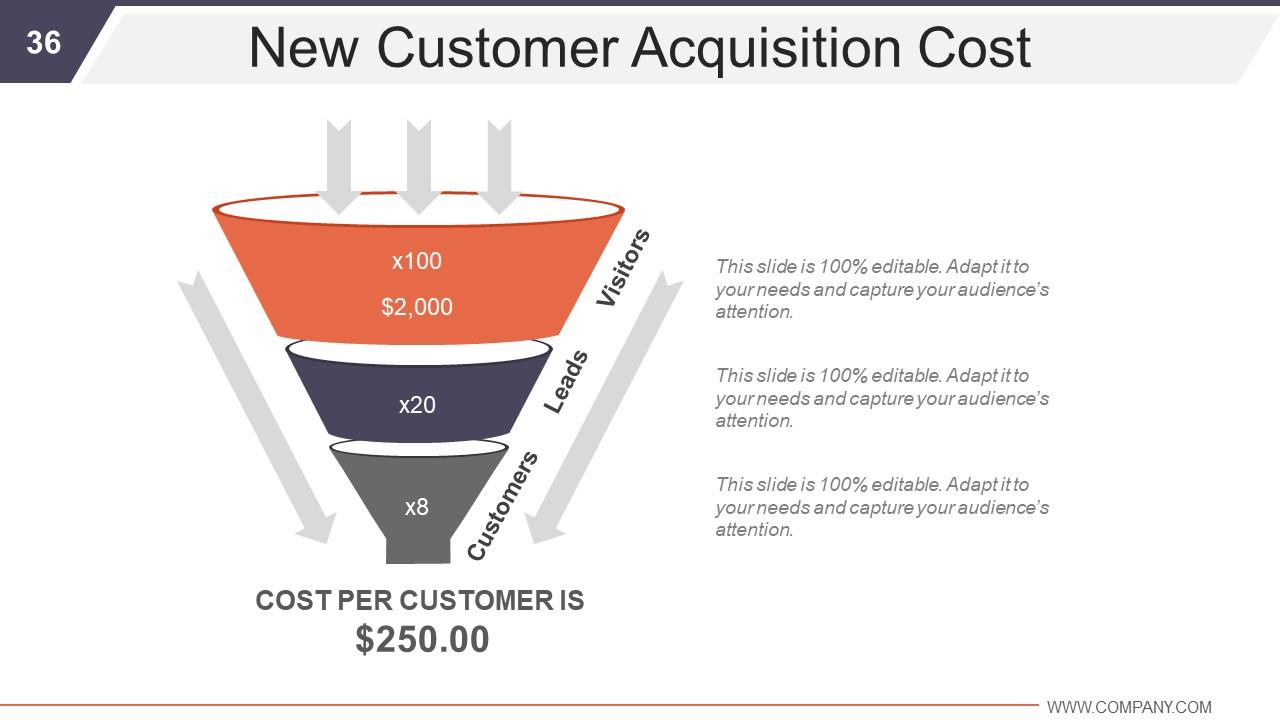
Slide 36: This is New Customer Acquisition Cost slide presented in a funnel form.
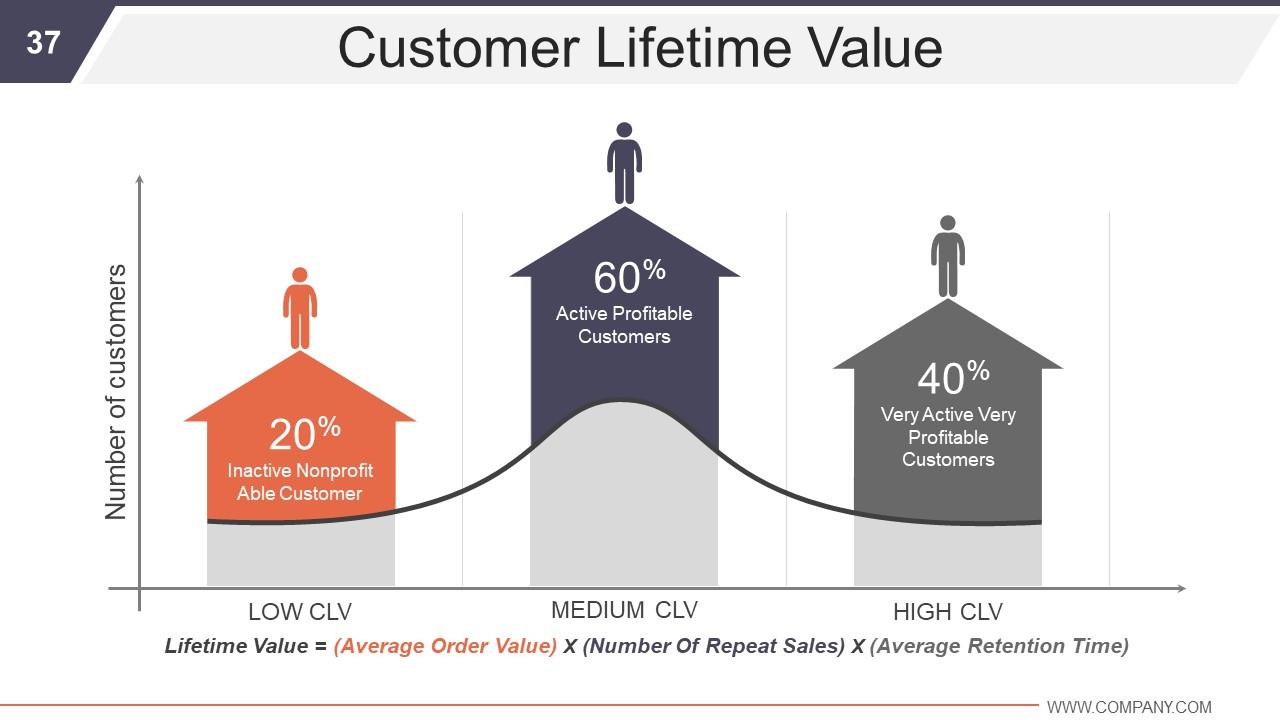
Slide 37: This slide displays Customer Lifetime Value with creative imagery and arrow imagery.
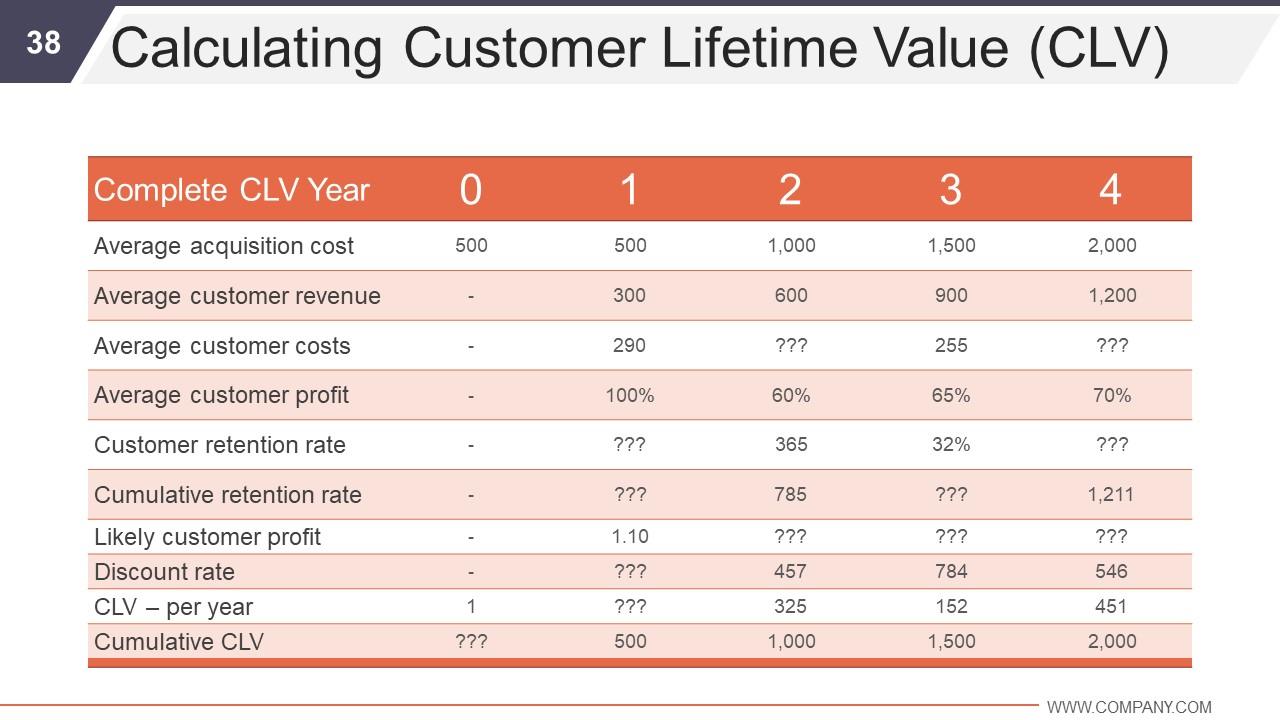
Slide 38: This is Calculating Customer Lifetime Value (CLV) slide in tabular form.
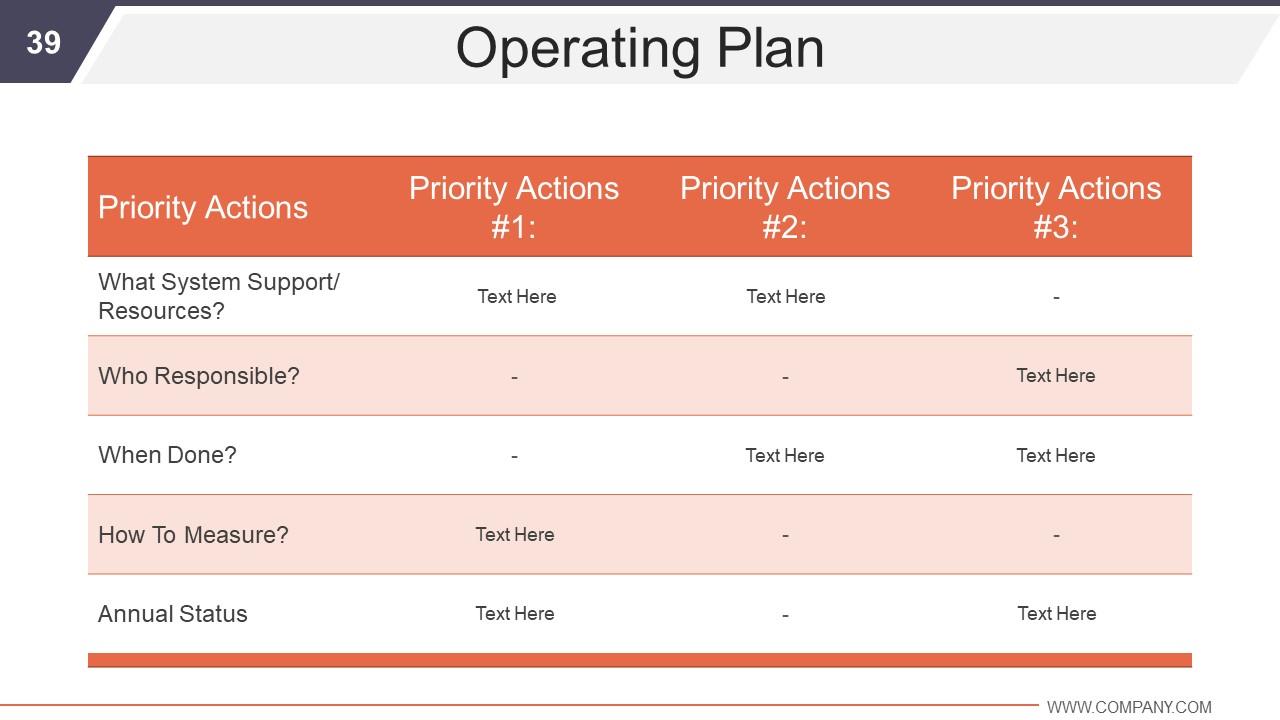
Slide 39: This slide states Operating Plan with priority actions.
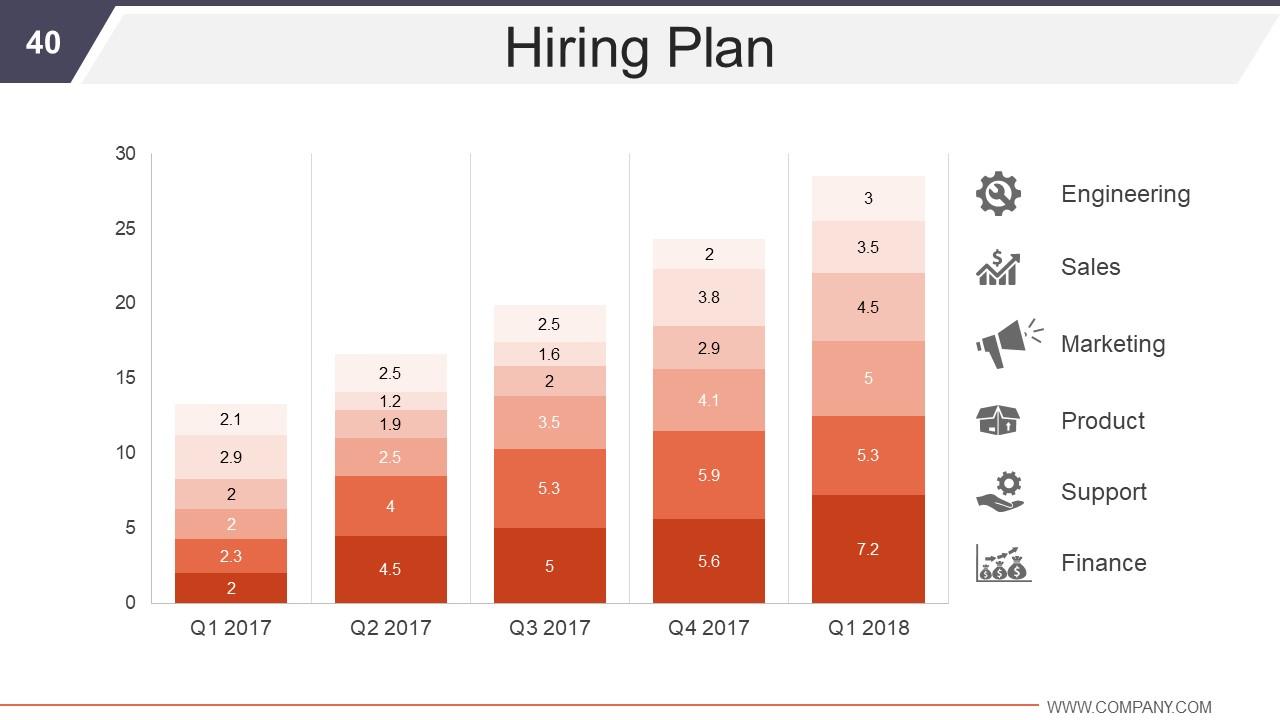
Slide 40: This slide showcases Hiring Plan with a bar graph image.
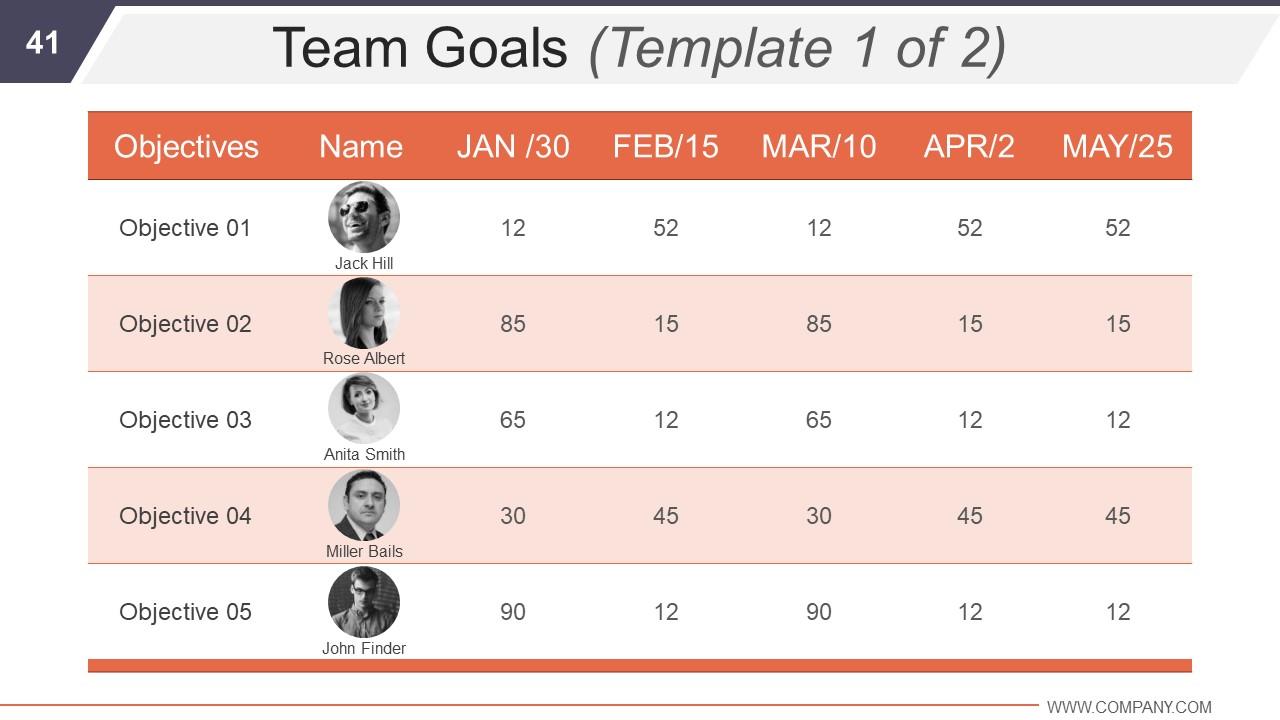
Slide 41: This slide presents Team Goals with name, objective etc. in a tabular form.
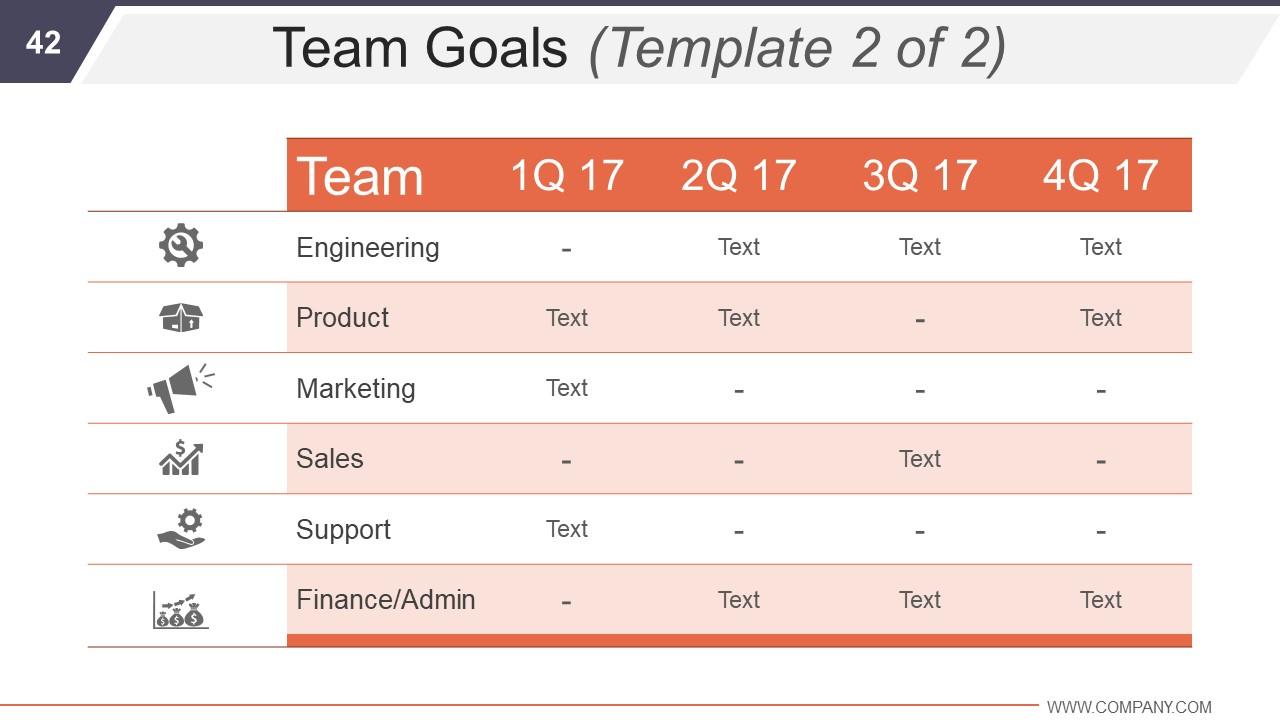
Slide 42: This is another slide showcasing Team Goals.
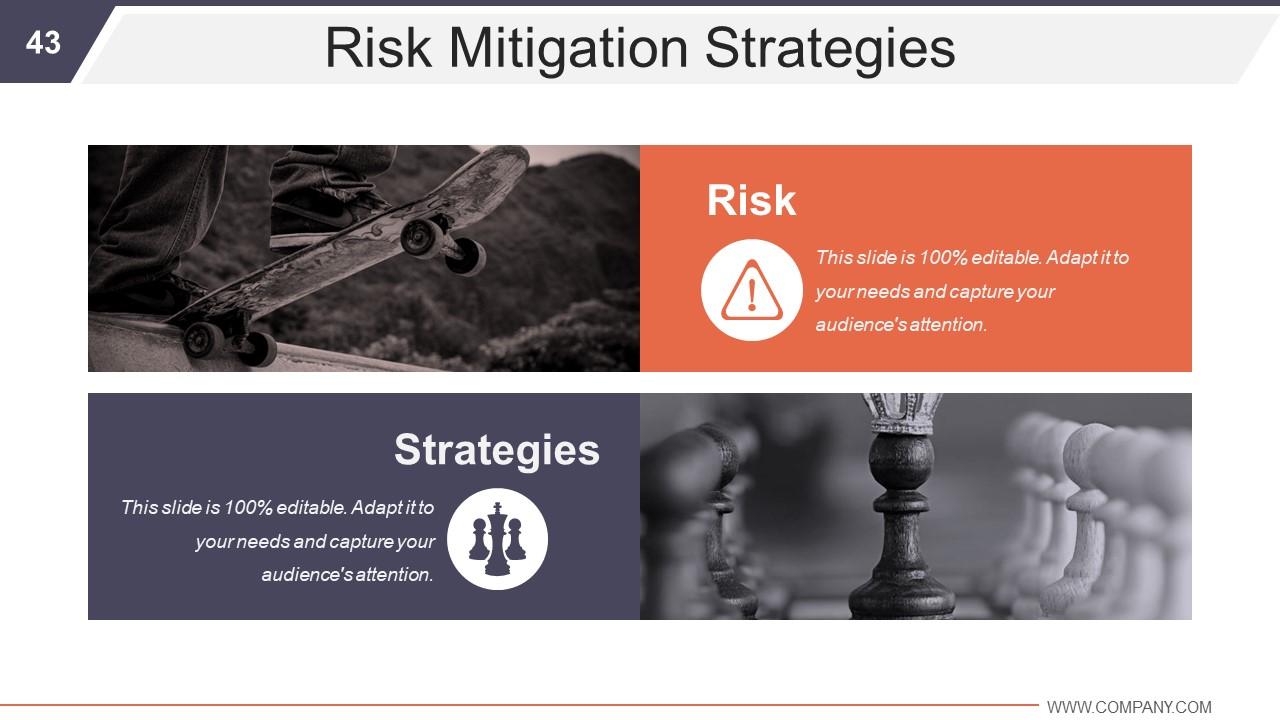
Slide 43: This slide states various Risk Mitigation Strategies. This slide which can be altered based on your requirement.
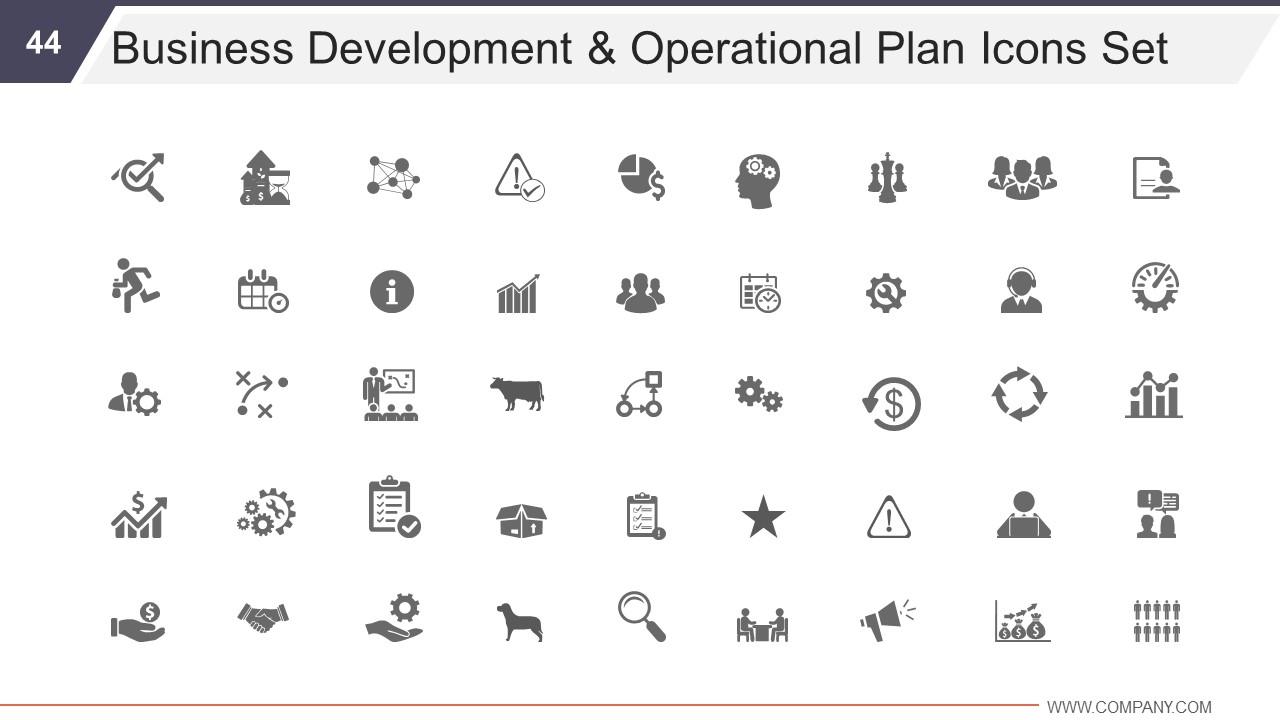
Slide 44: This slide presents Business Development & Operational Plan Icons Set. Use or alter icons as per need.
Slide 45: This slide forwards to Additional Slides. You can change/ alter content as per need.
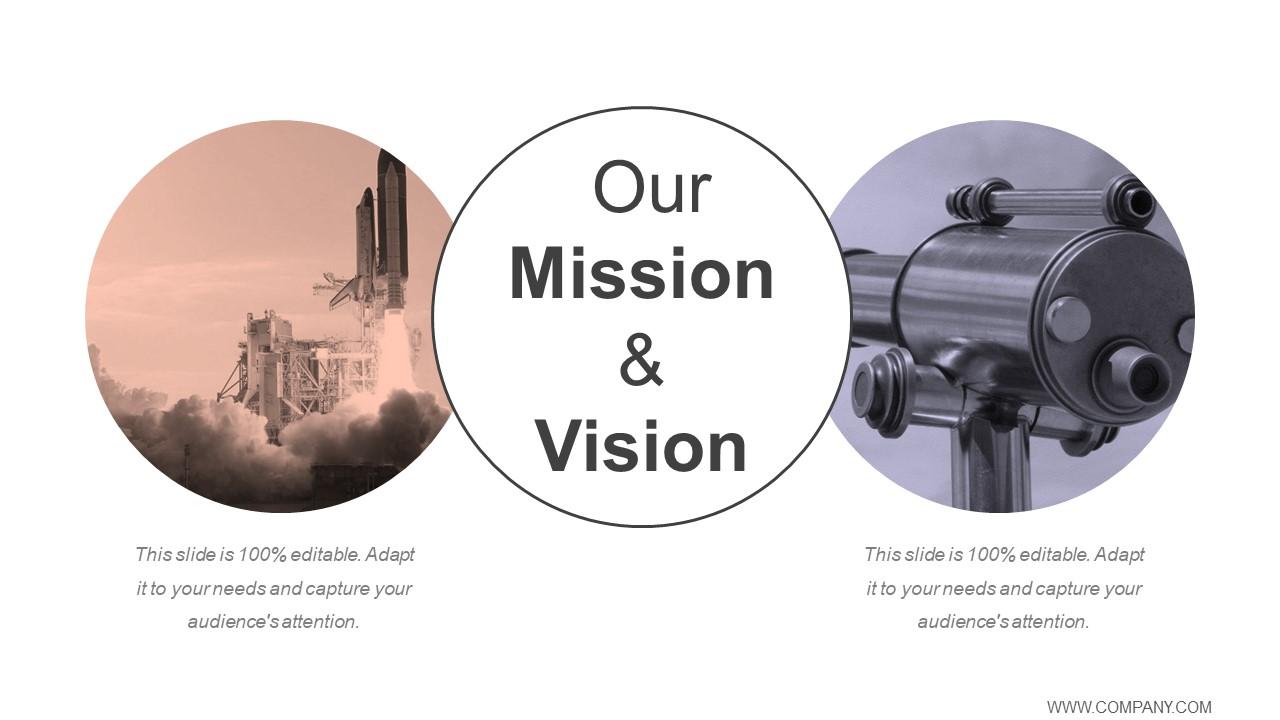
Slide 46: This is Our Mission & Vision slide with image and text boxes. Add your mission, vision etc. here
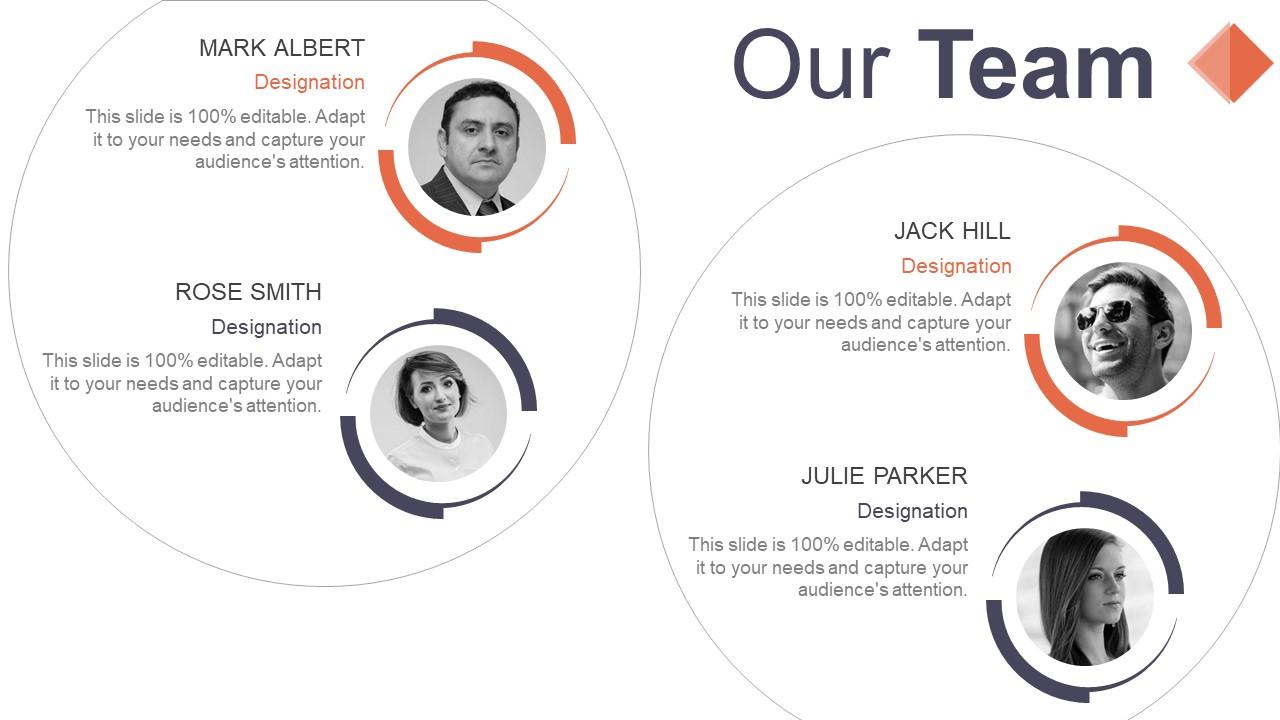
Slide 47: This slide introduces Our Team with name, designation, images and text boxes to be filled as desired.
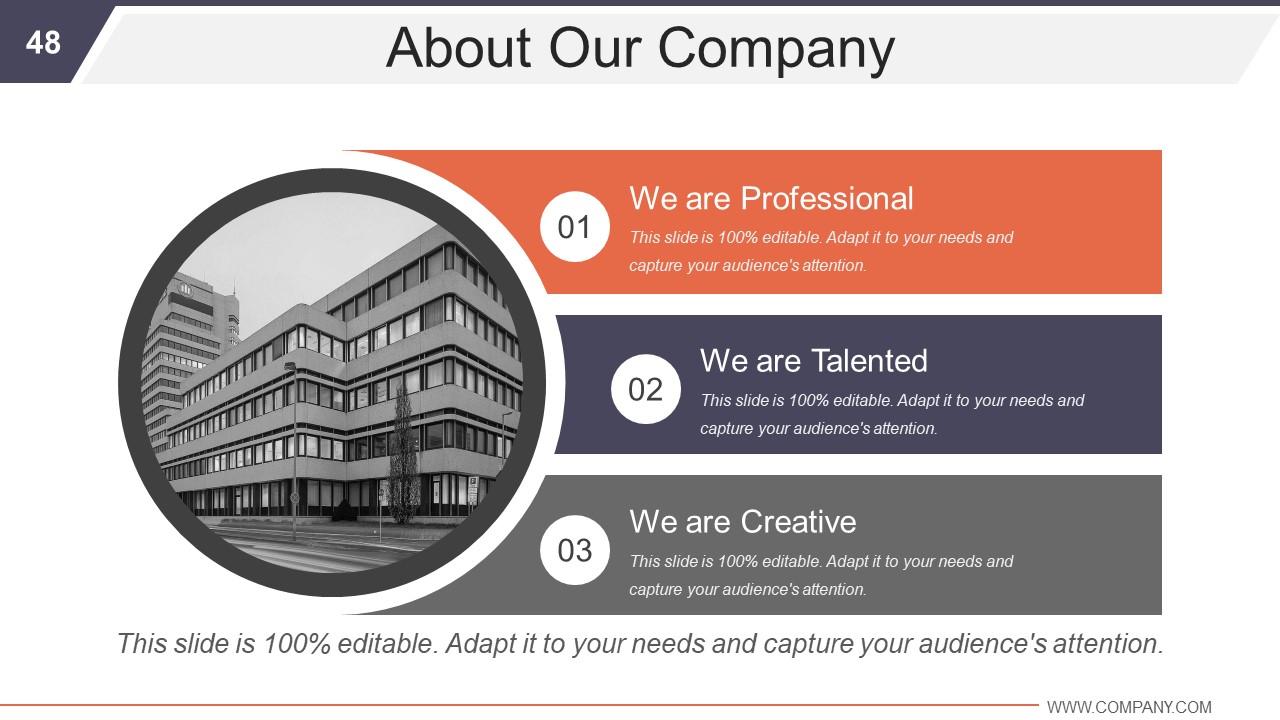
Slide 48: This is About Our Company slide showcasing- We are Professional, We are Talented, We are Creative.
Slide 49: This is Our Goals slide to state your goals, aspirations etc.
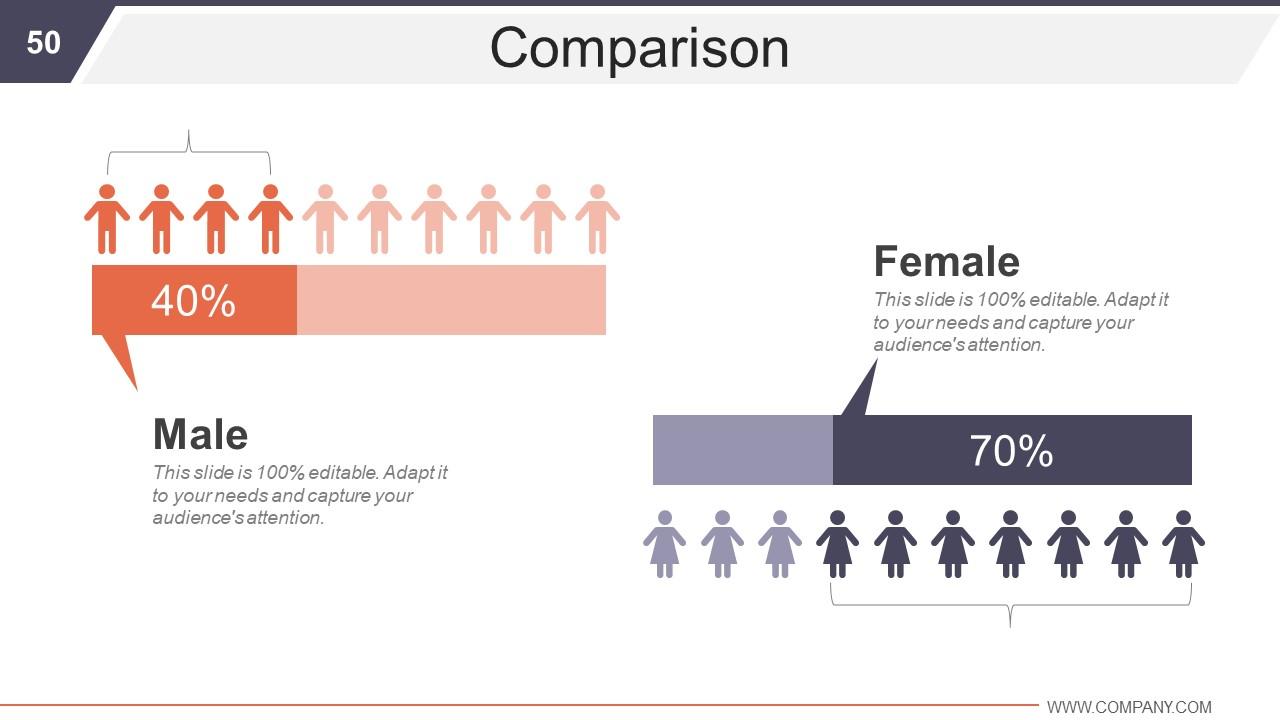
Slide 50: This slide displays Comparison on the basis of gender. It shows male and female image compared in terms of percentages.
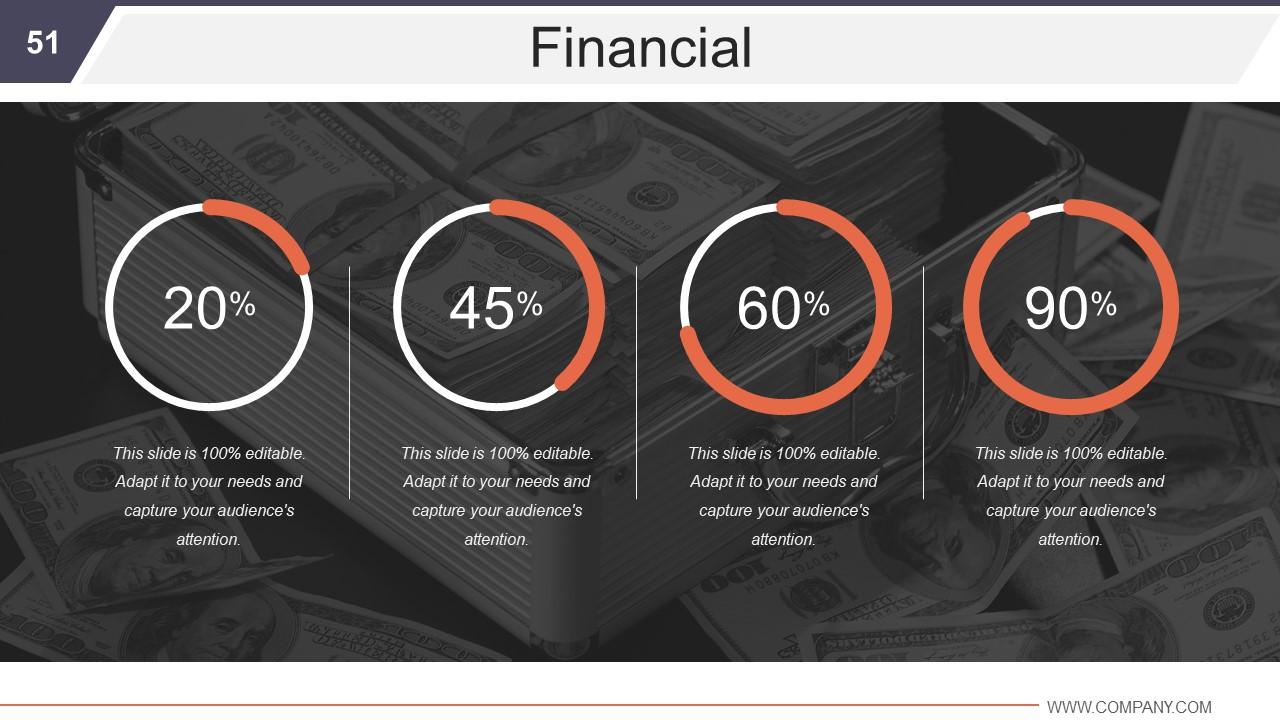
Slide 51: This is Financials slide to state your financial score with relevant imagery and text.
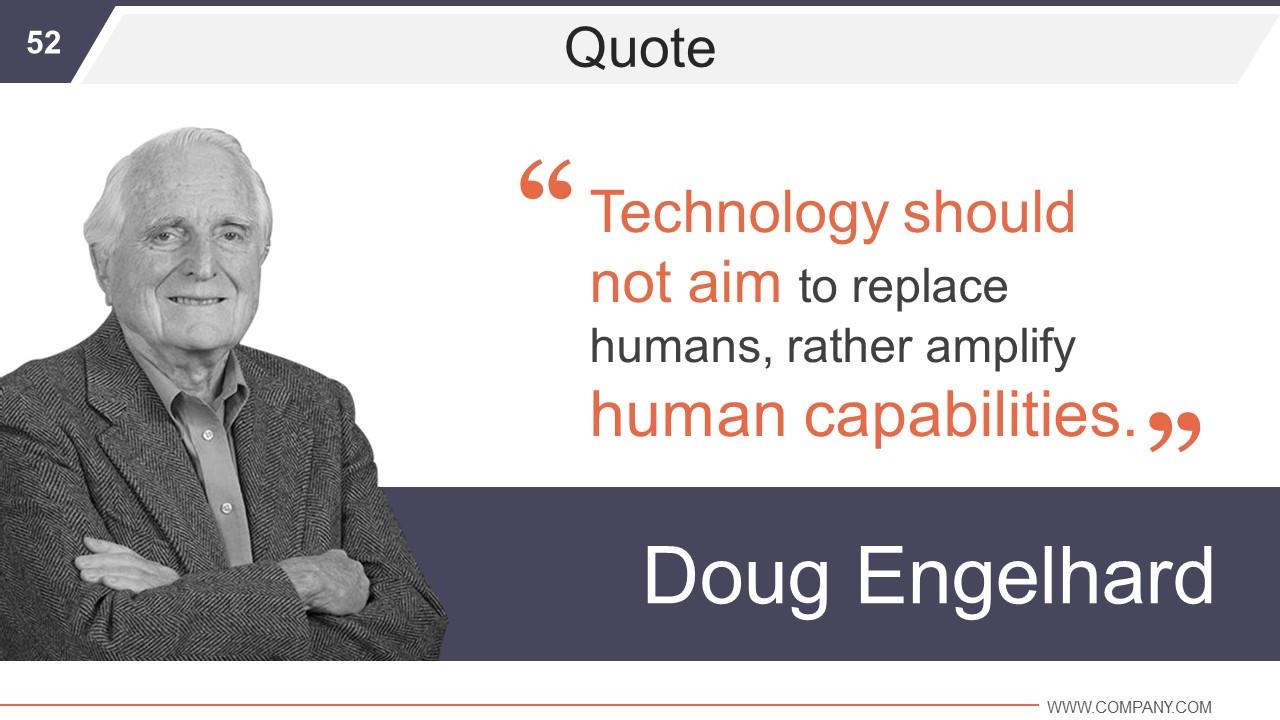
Slide 52: This is a Quotes slide. Insert your desired quote etc. here.
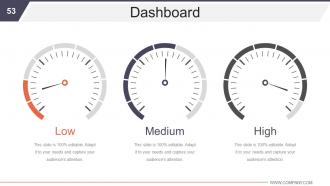
Slide 53: This slide presents a Dashboard with High, Medium and Low parameters.
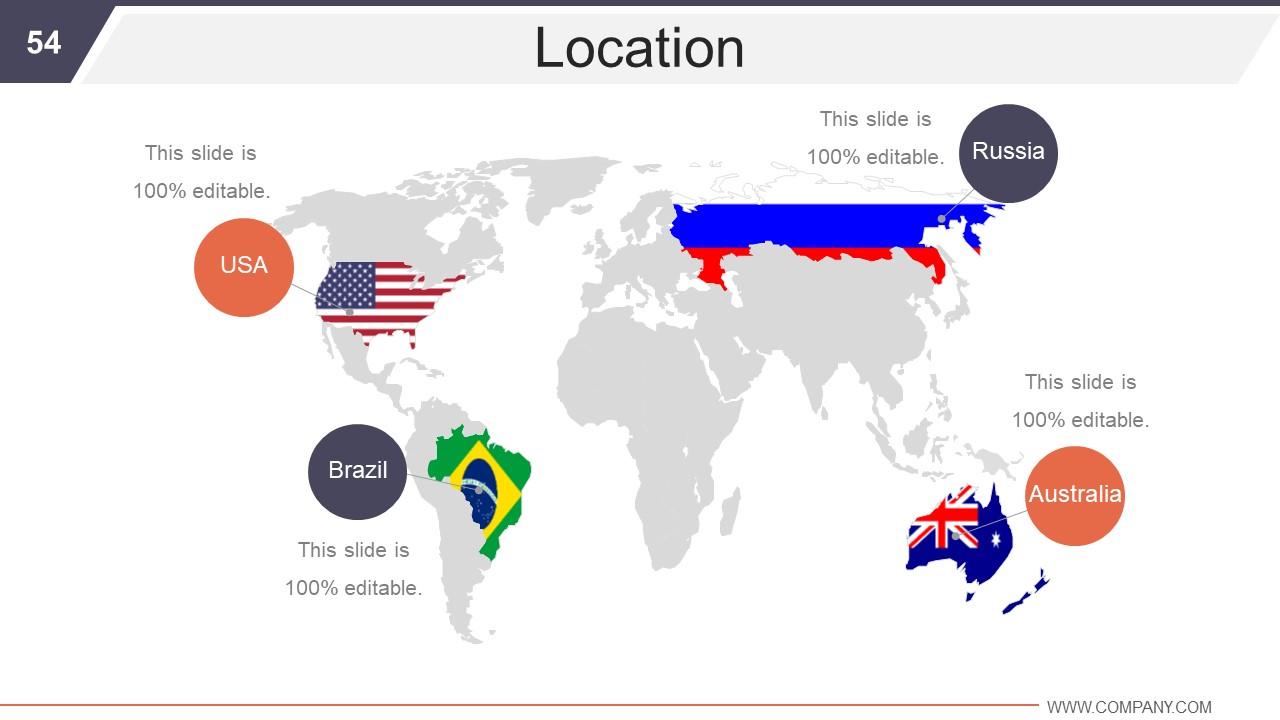
Slide 54: This slide showcases Locations with a World map and text boxes to make it explicit.
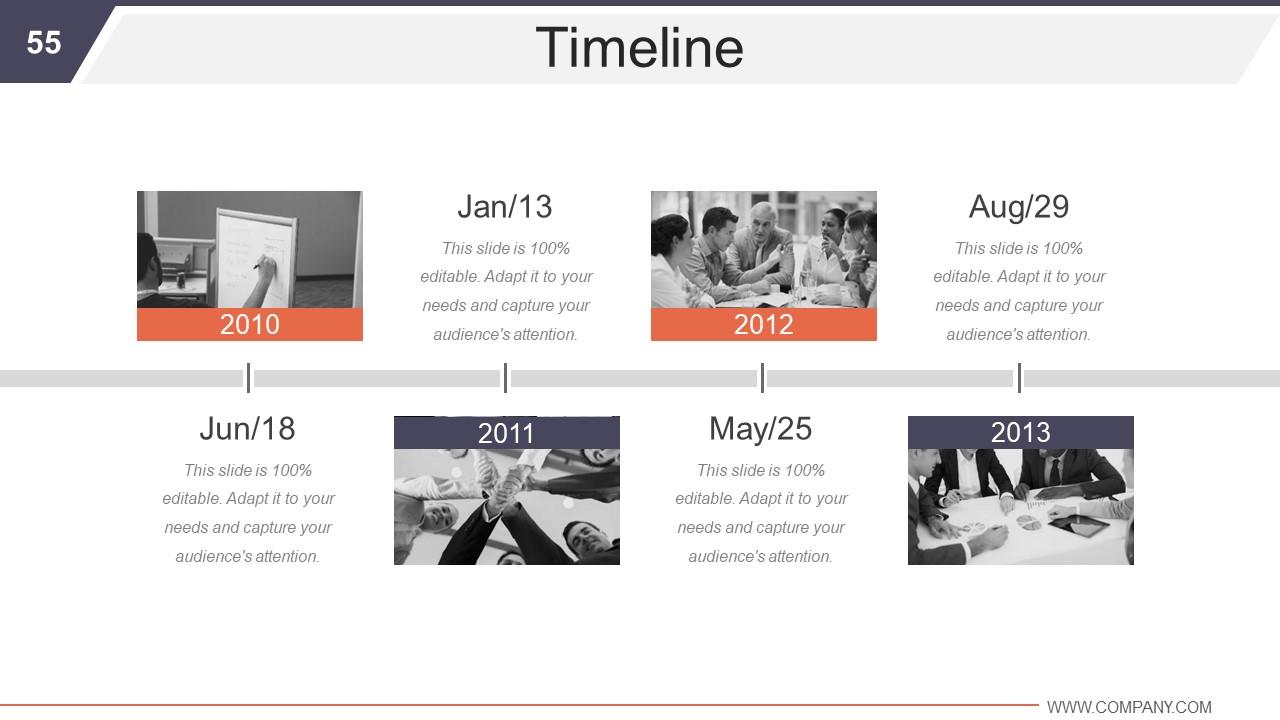
Slide 55: This is a Timeline slide. You can present yearly growth etc. with it.
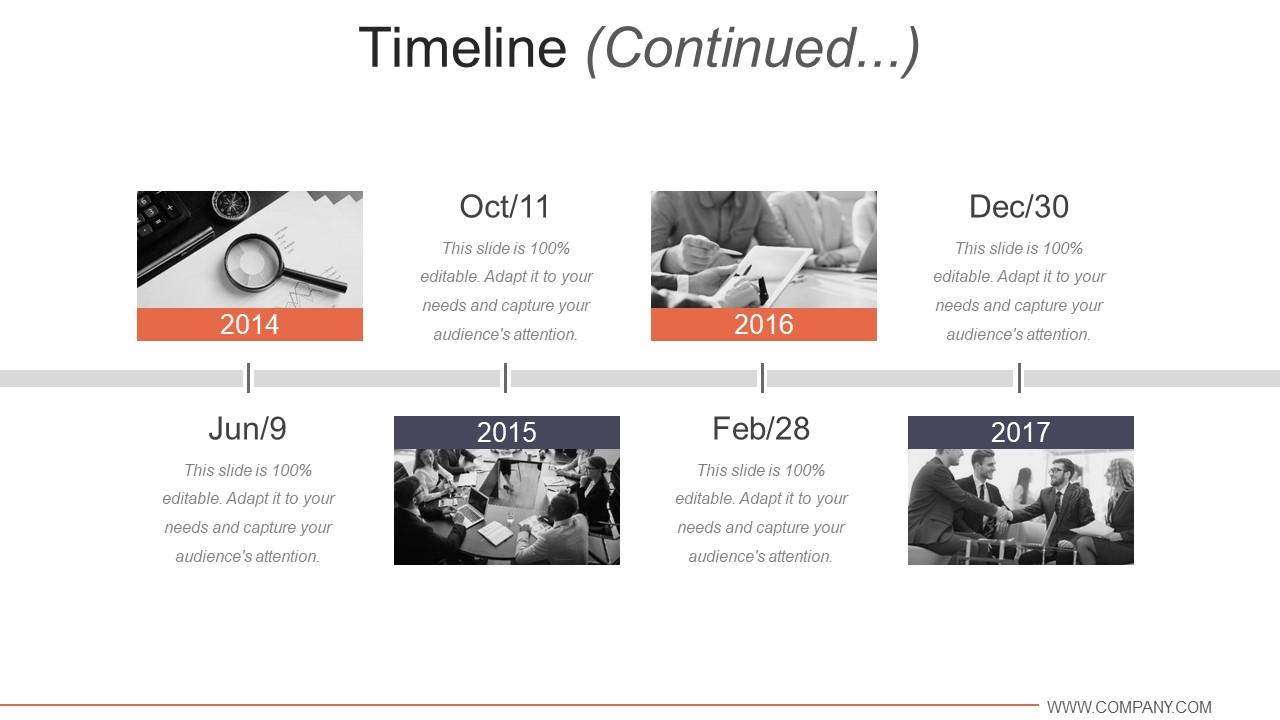
Slide 56: This is another Timeline slide.
Slide 57: This slide displays Post It for pinning important facts, notices etc. for the company.
Slide 58: This is a Newspaper slide to highlight important information or add memorabilia.
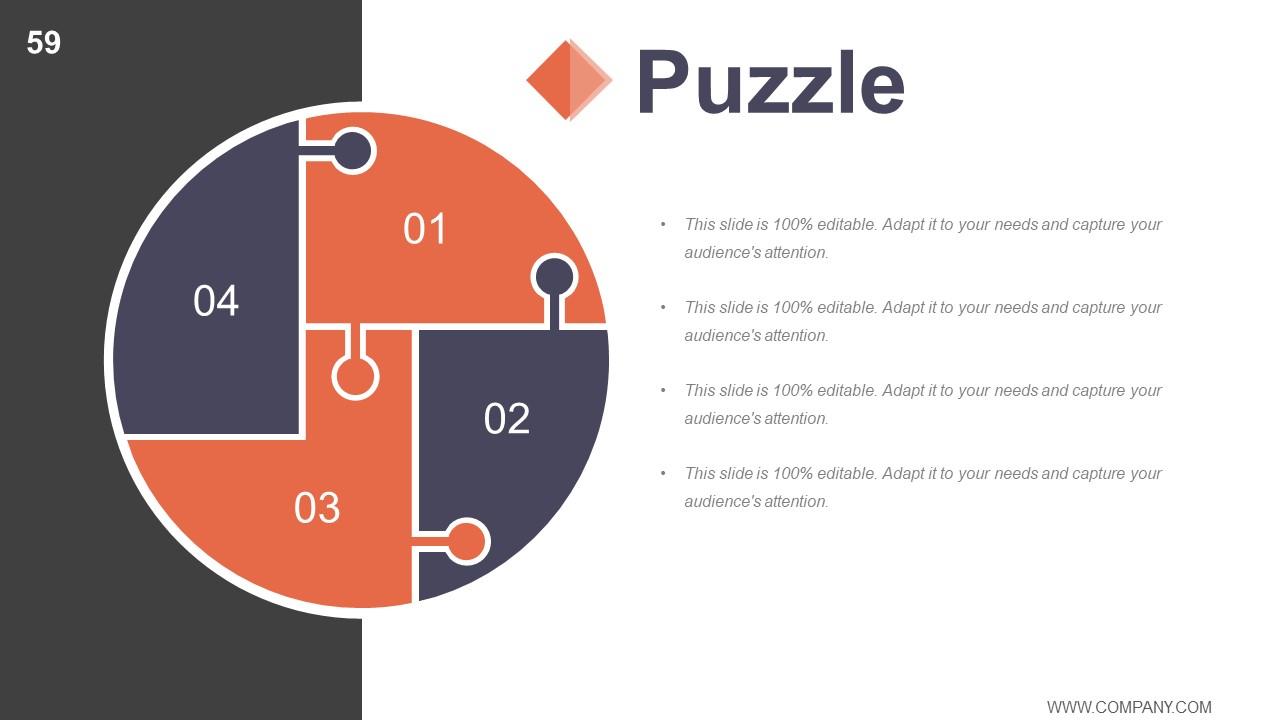
Slide 59: This is a Puzzle image slide to show information, specification etc.
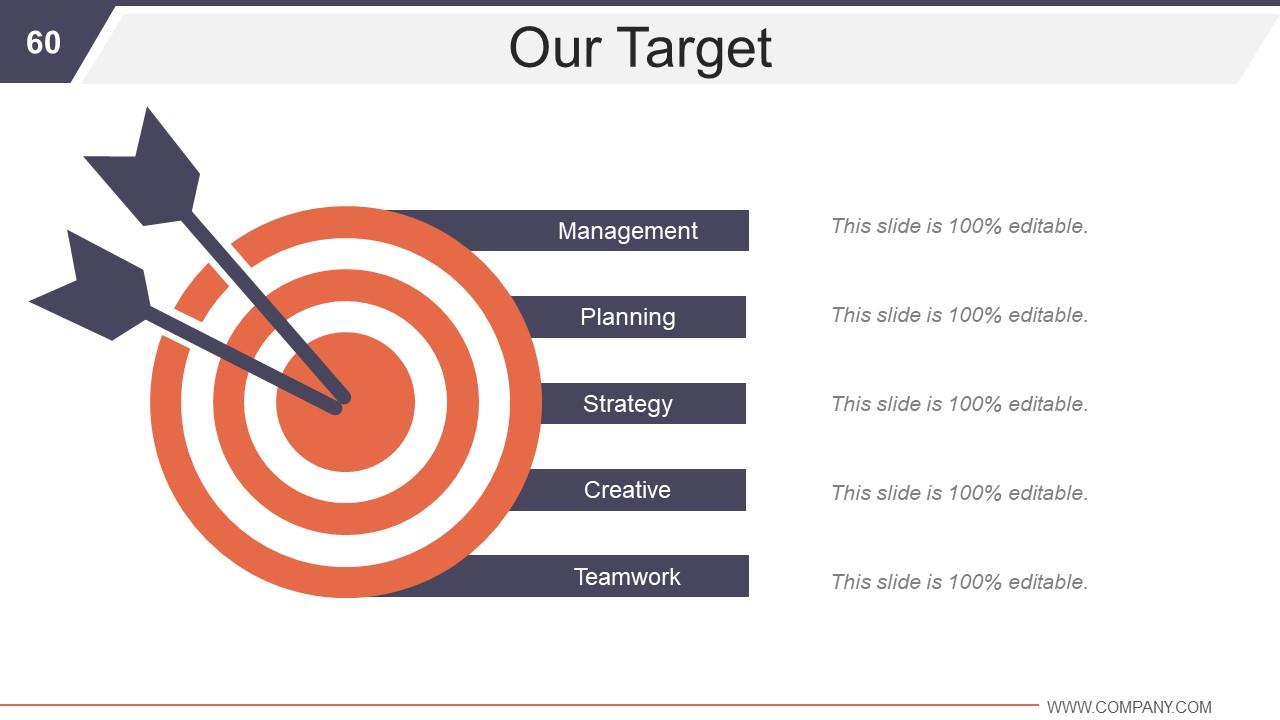
Slide 60: This is Our Target slide which consists of- Management, Planning, Strategy, Creative, Teamwork.
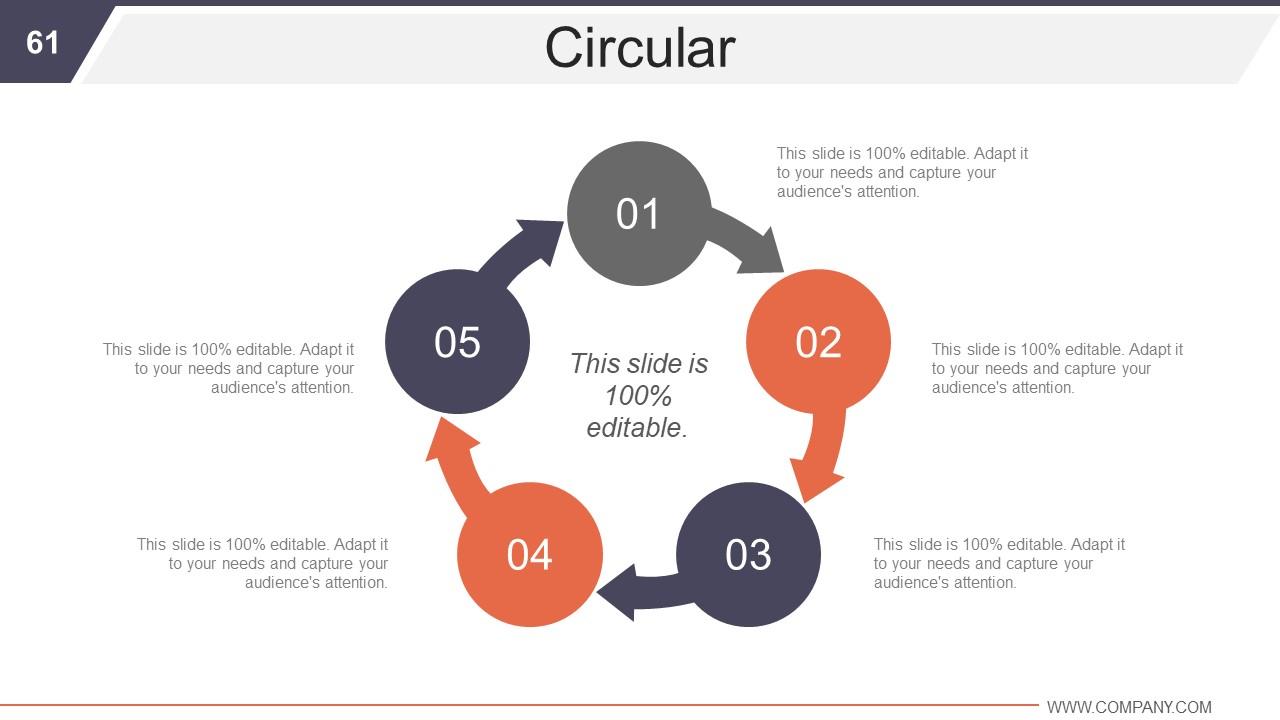
Slide 61: This slide represents a Circular image with icon imagery to fill texts.
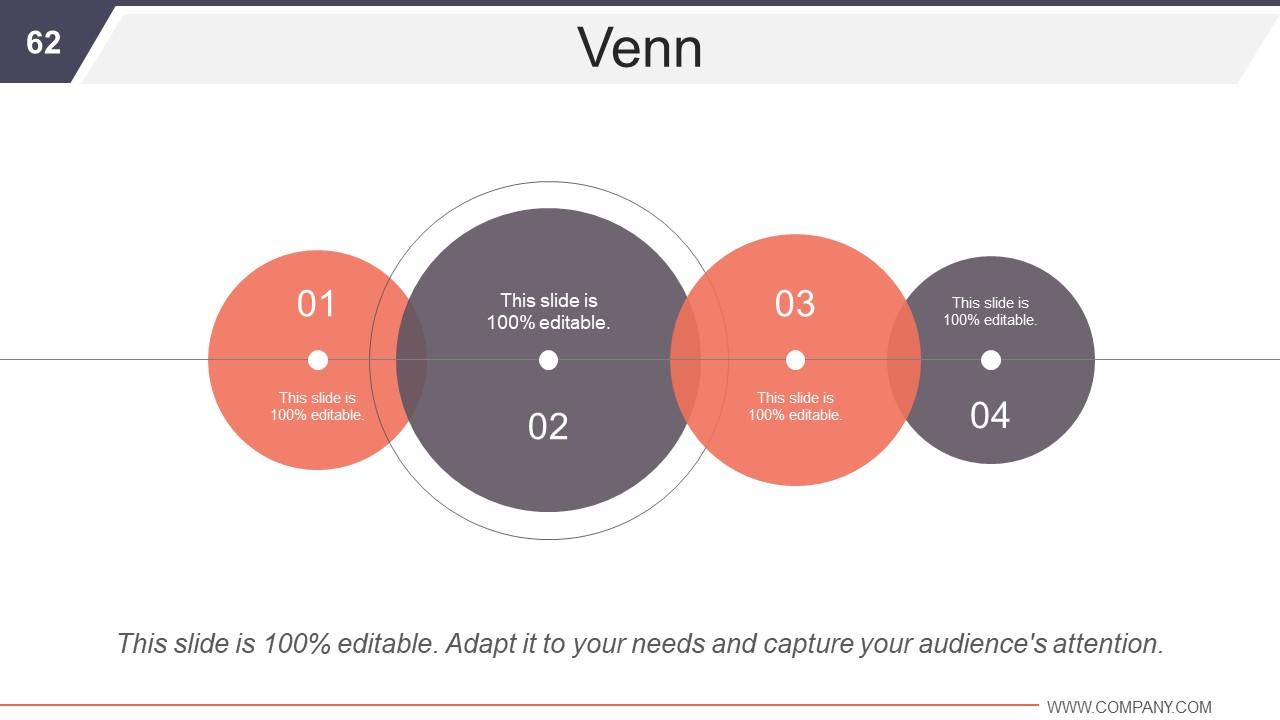
Slide 62: This is a Venn diagram slide. Showcase relations, information, specifications etc. here.
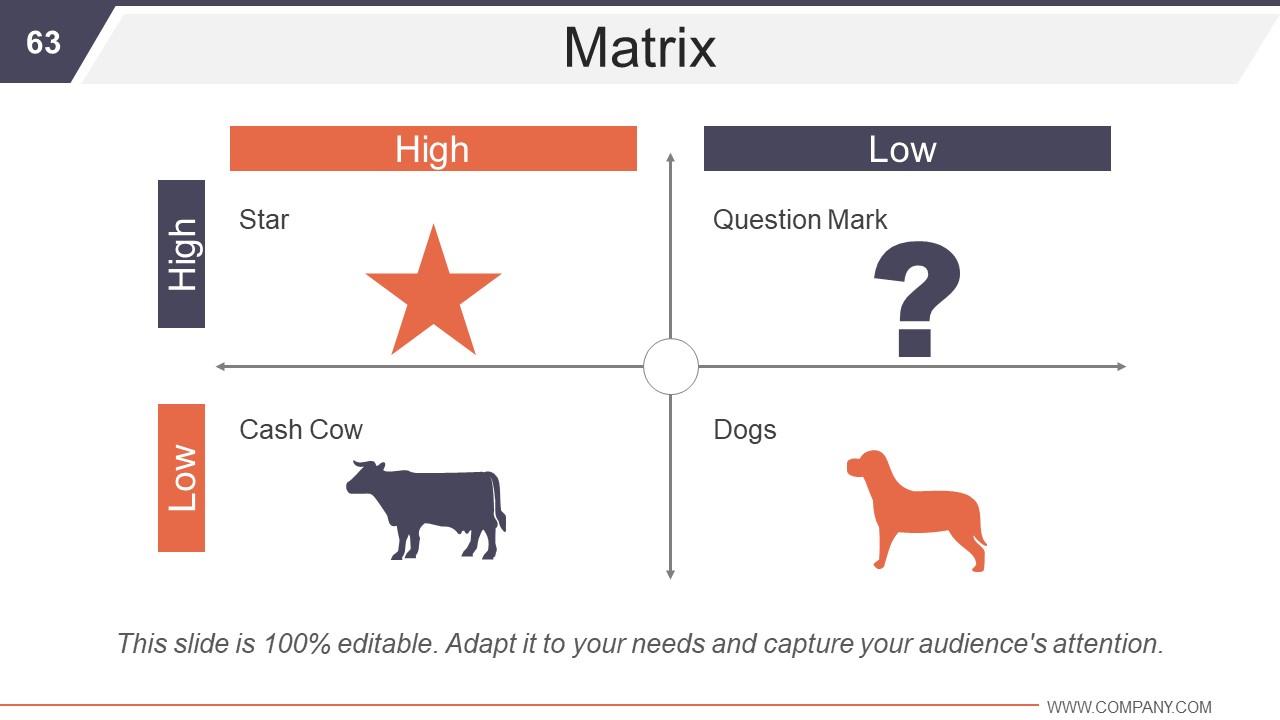
Slide 63: This is a Matrix image slide to be used as desired.
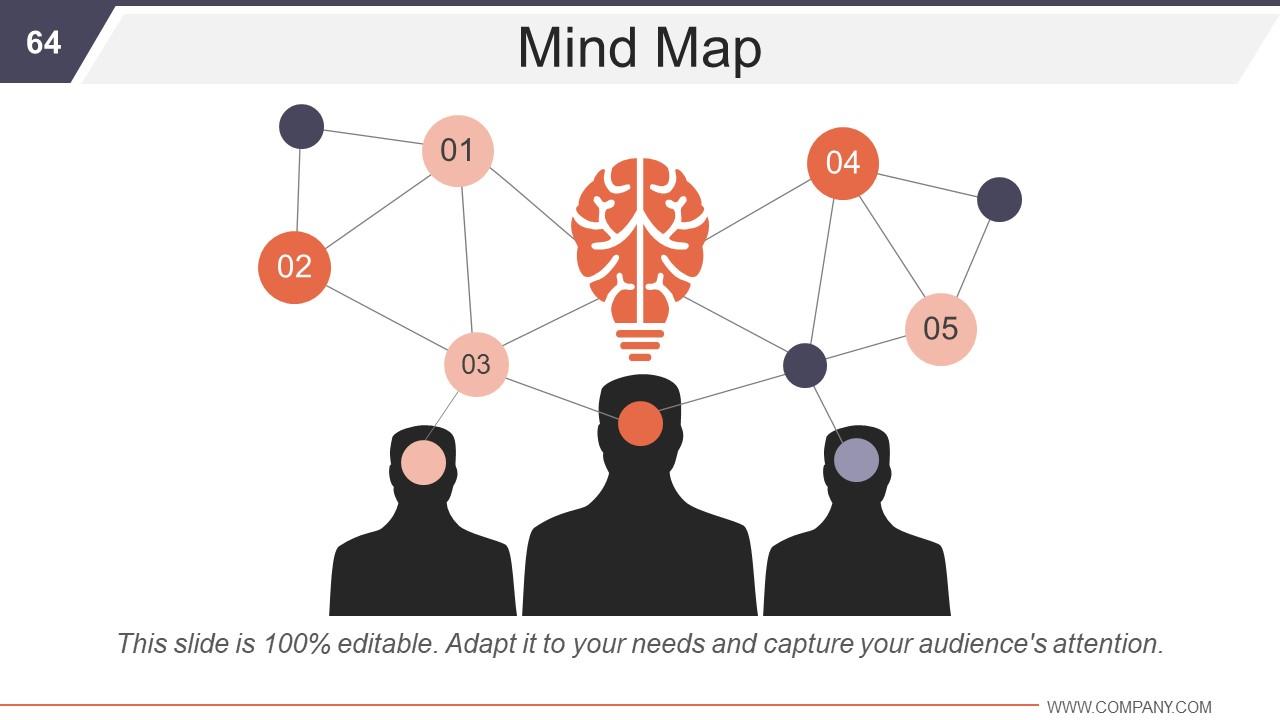
Slide 64: This is a Mind Map slide to showcase behavioural segmentation etc.
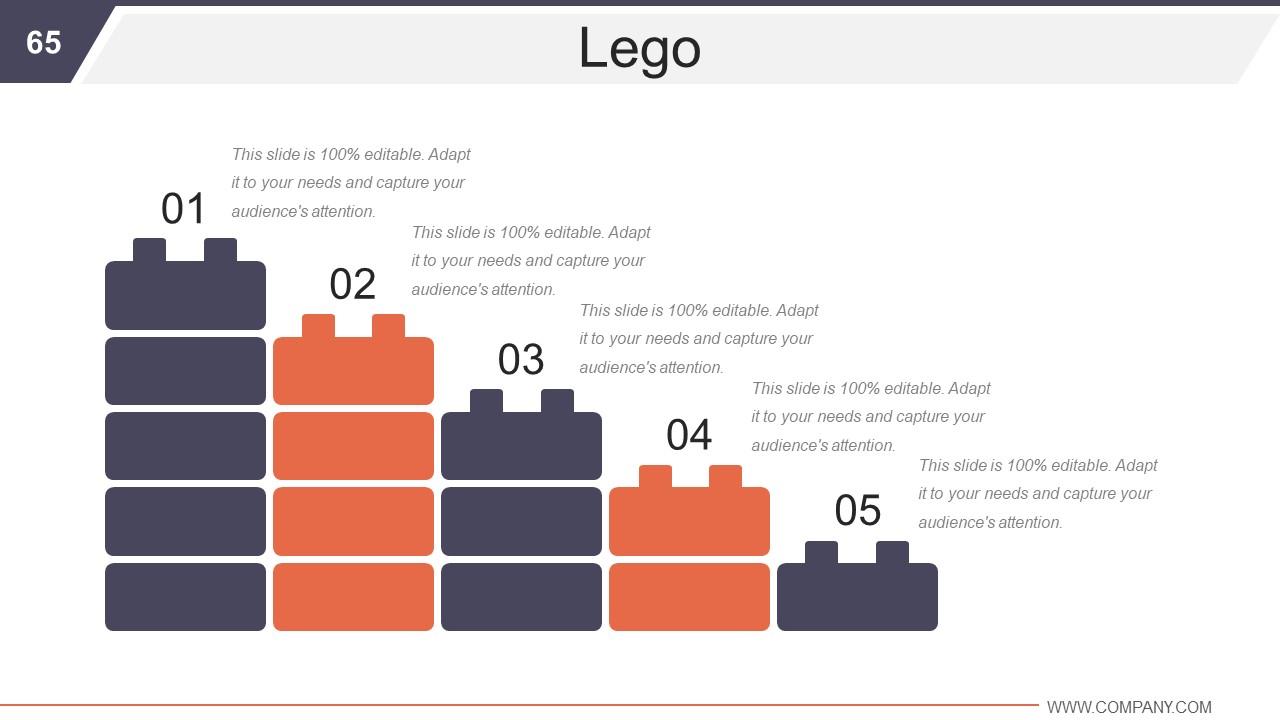
Slide 65: This is a Lego Blocks slide with text boxes to showcase specific information, sepcifications etc.
Slide 66: This is a people Silhouettes slide with text boxes to showcase people specific information etc.
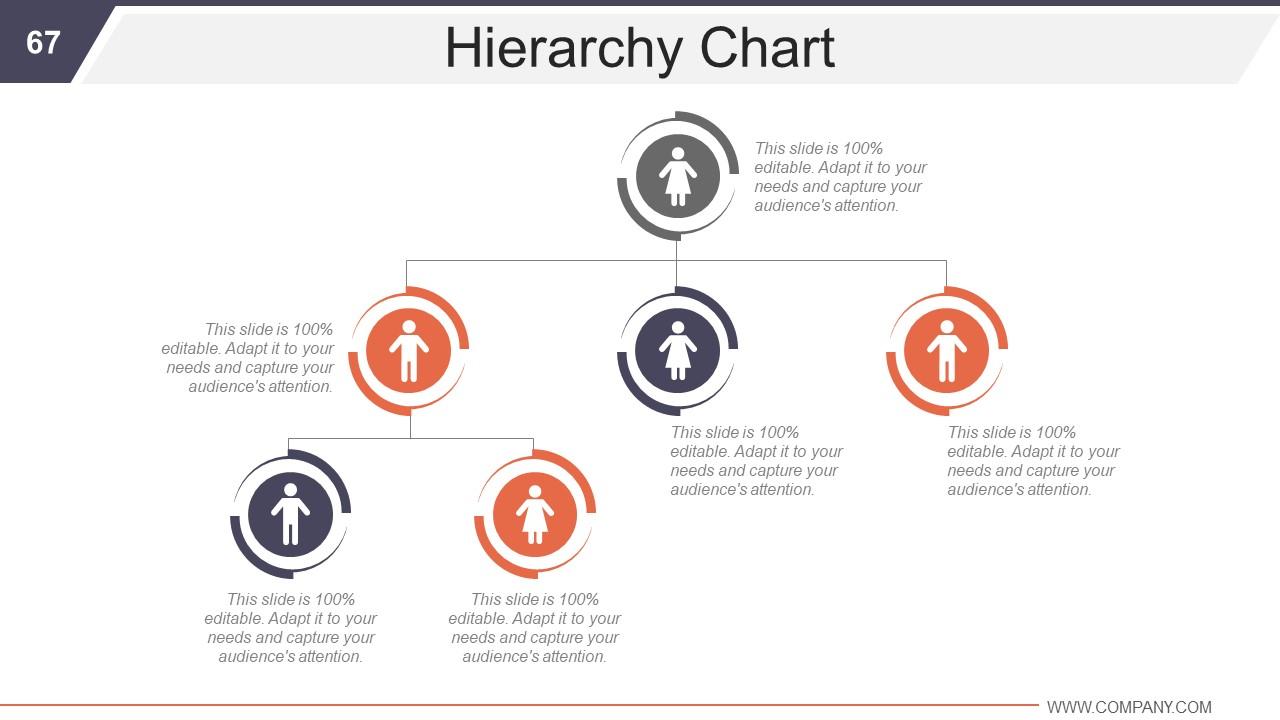
Slide 67: This slide presents a Hierarchy Chart to be filled as desired.
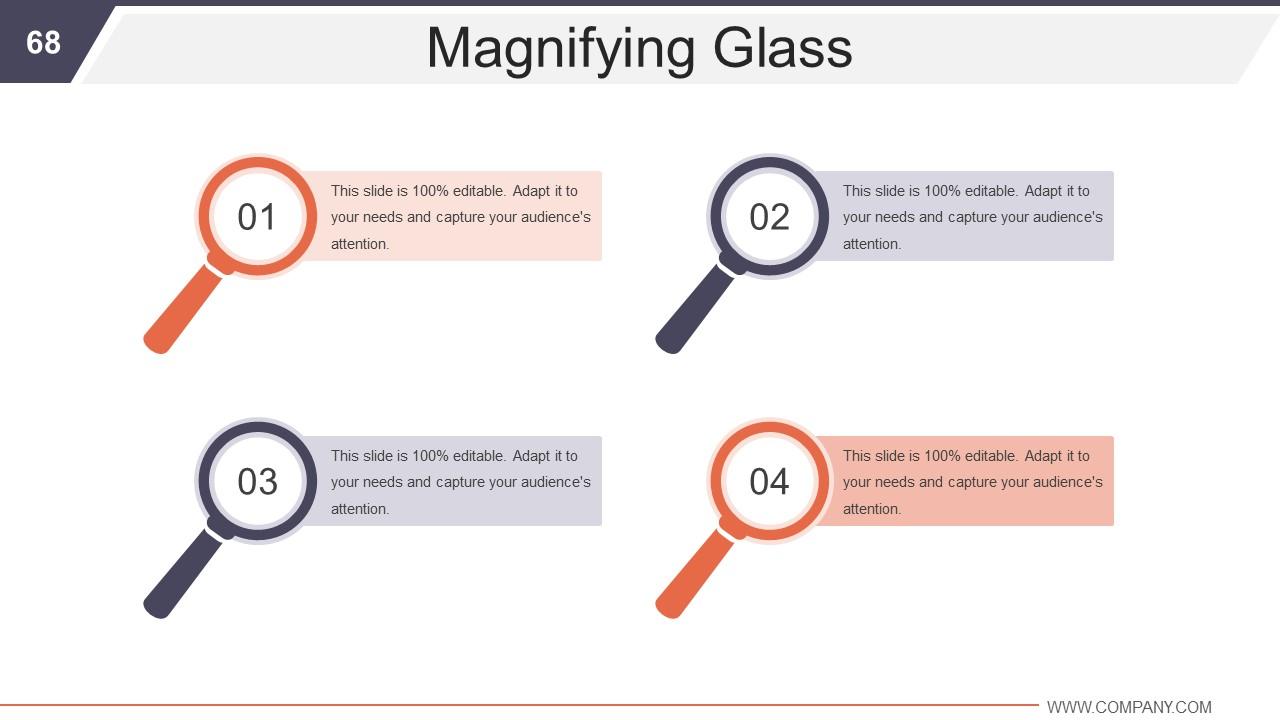
Slide 68: This is a Magnifying Glass slide with relevant imagery and text boxes.
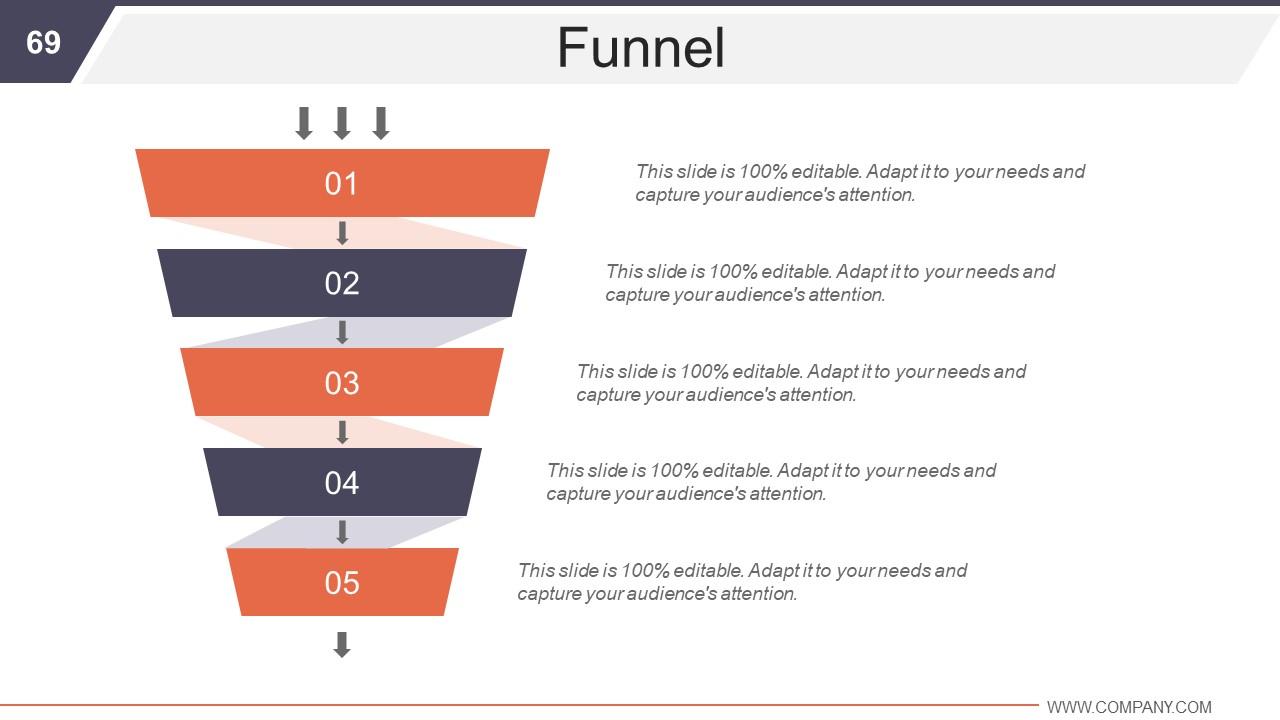
Slide 69: This is a Funnel diagram slide. Put information in funnel form here.
Slide 70: This is Our Charts slide to proceed. Change/ edit image as per need.
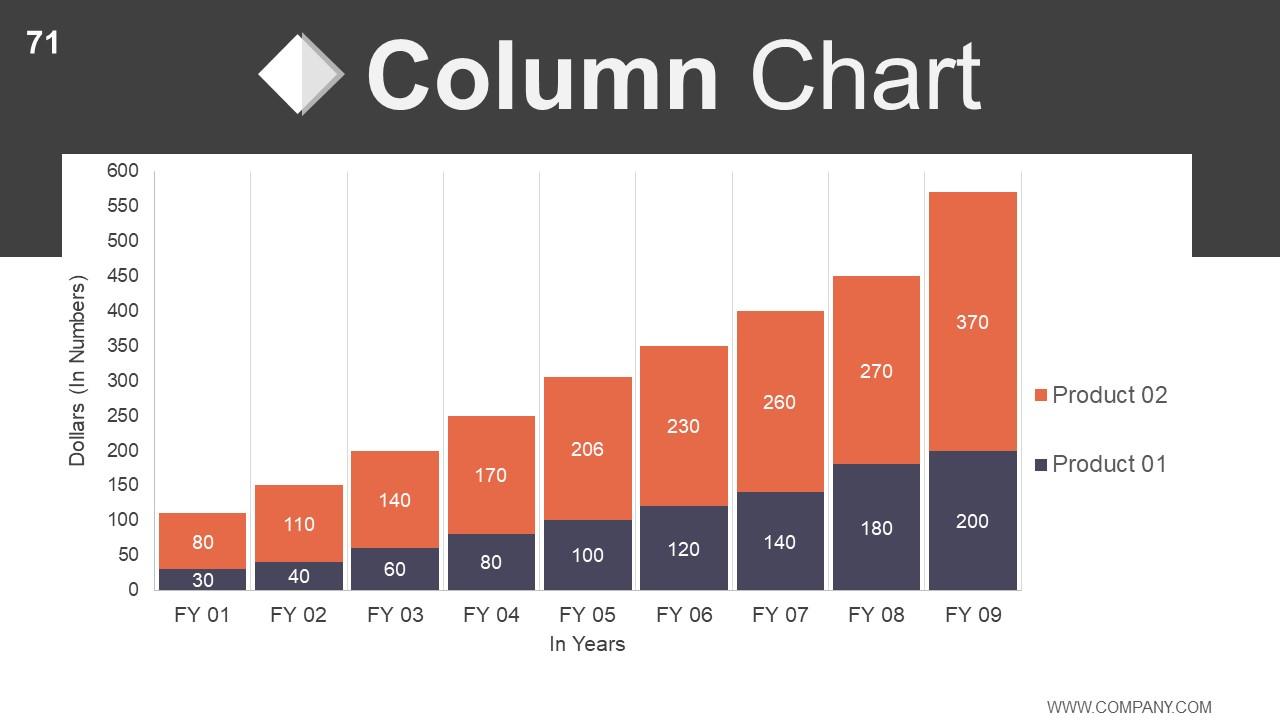
Slide 71: This is a Column Chart for showing product/entity comparison, information etc.
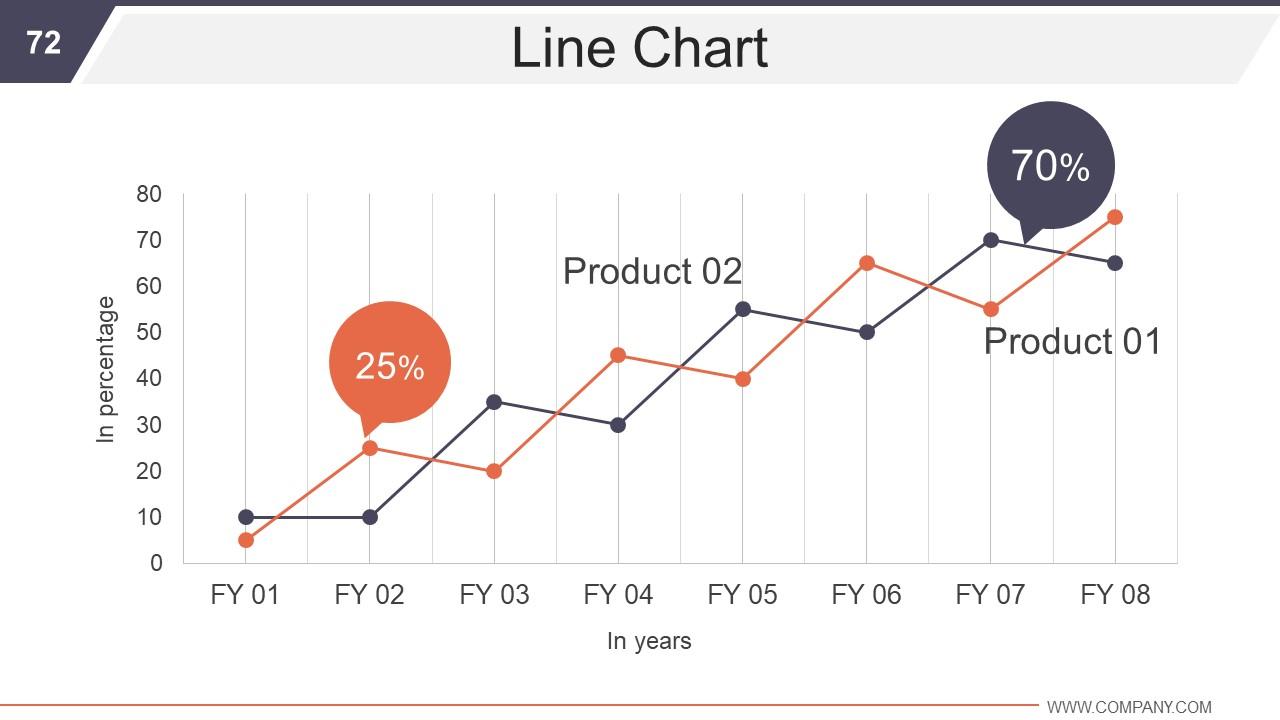
Slide 72: This slide contains a Line Chart. Product 01Product 02 can be shown in comparison.
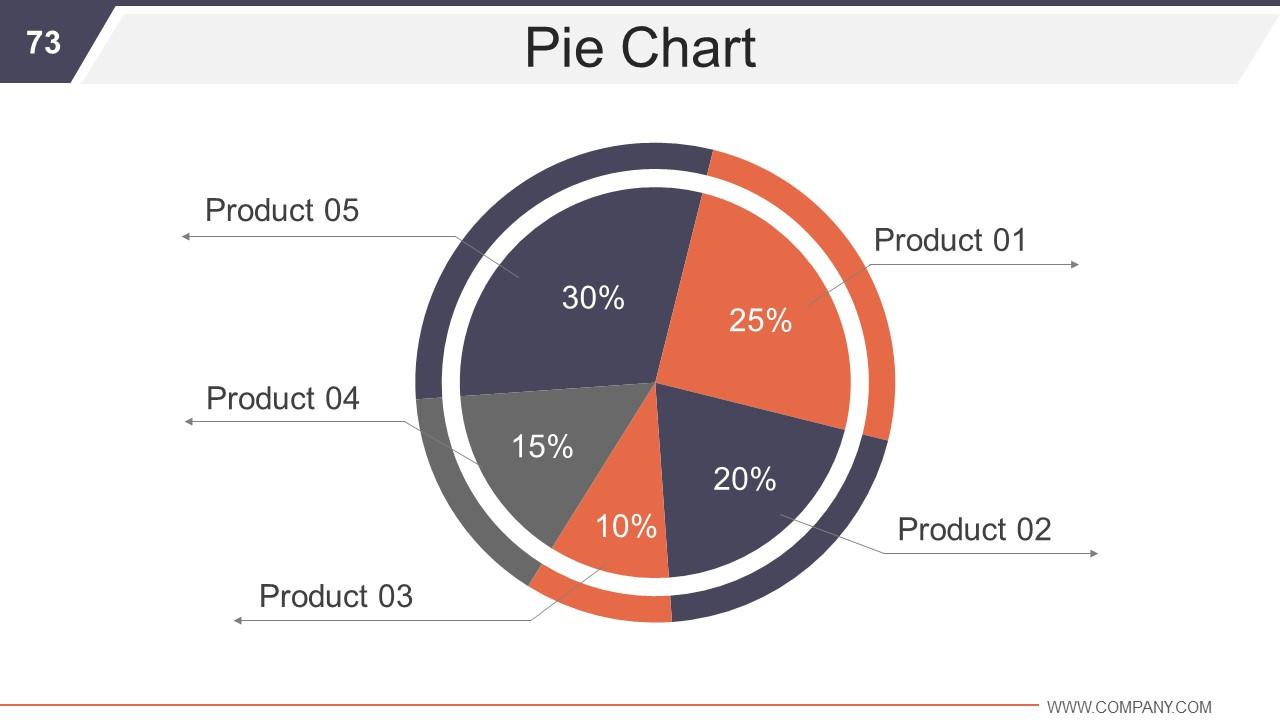
Slide 73: This is a Pie Chart slide to show product comparison etc.
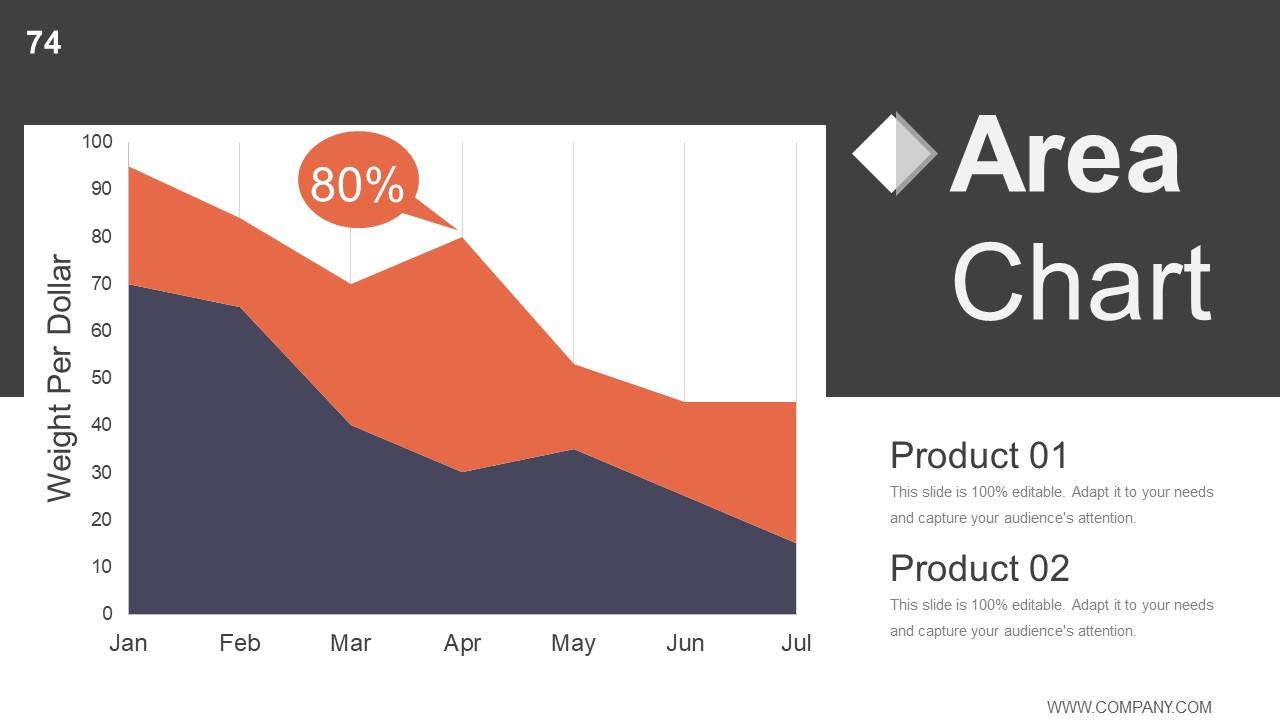
Slide 74: This is an Area Chart slide to show product comparison etc.
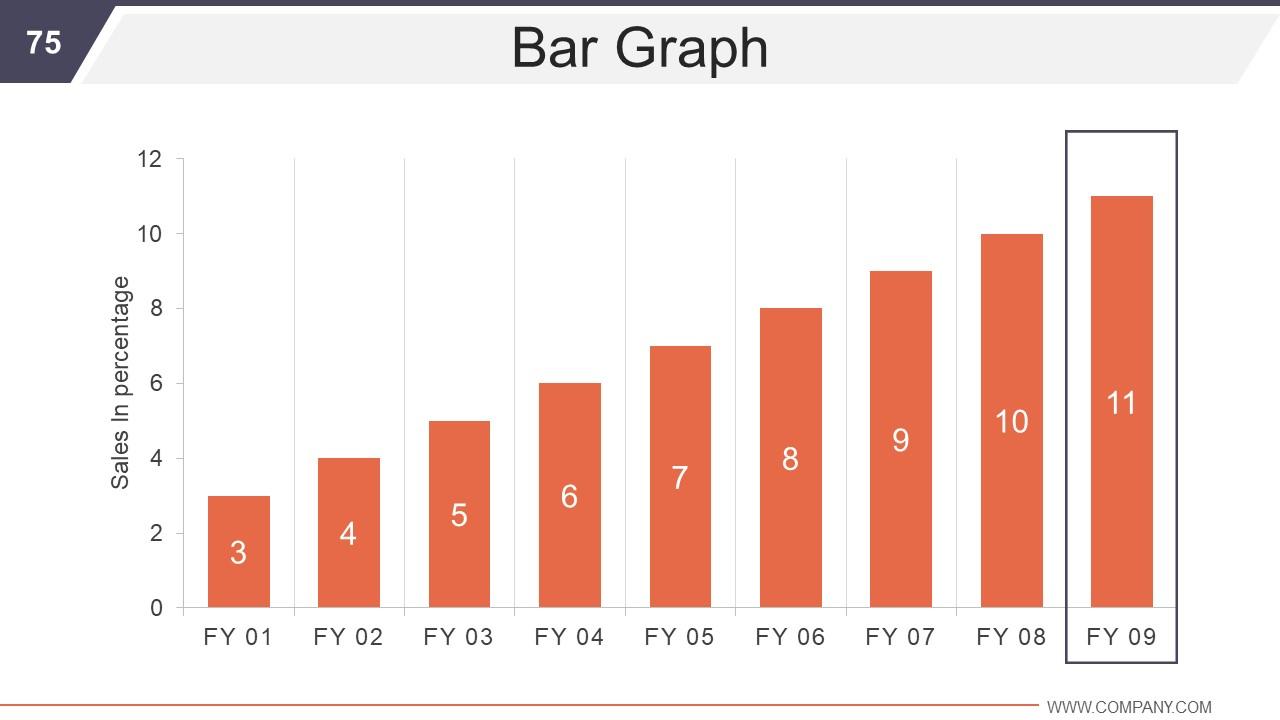
Slide 75: This is a Bar Graph image slide to show product comparison, growth etc.
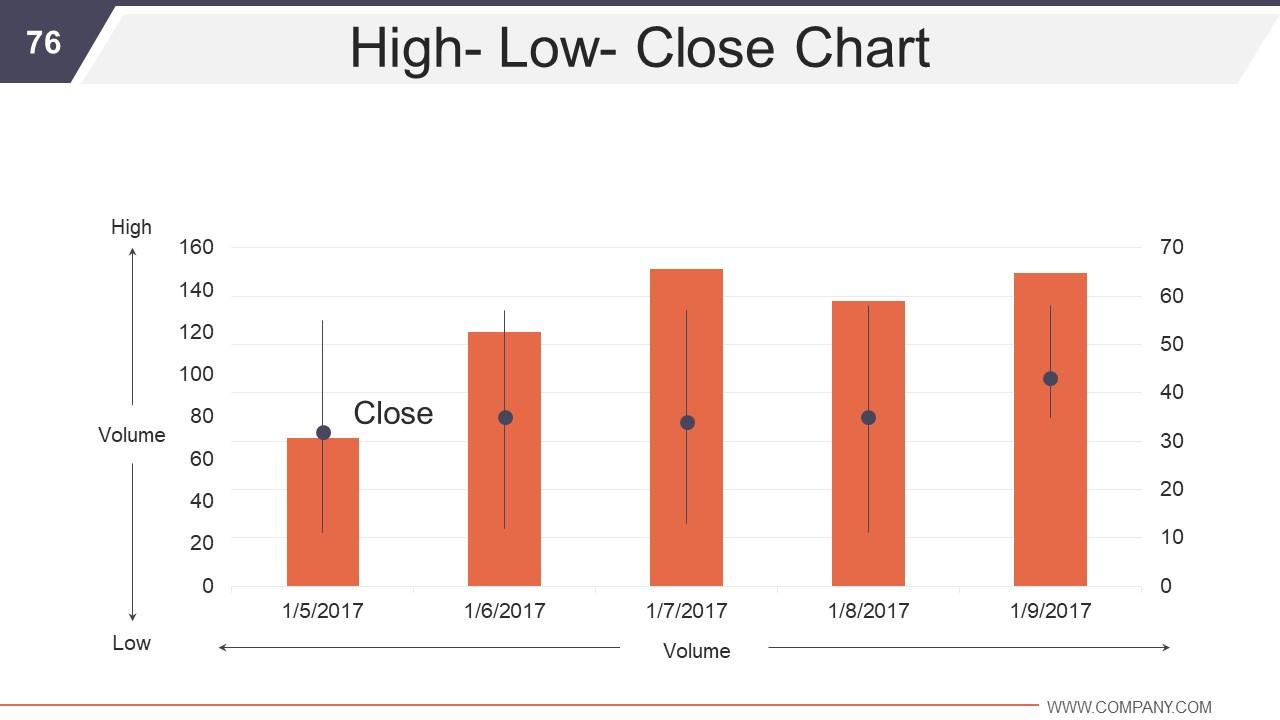
Slide 76: This is a High- Low- Close Chart slide presenting volume in High and Low terms.
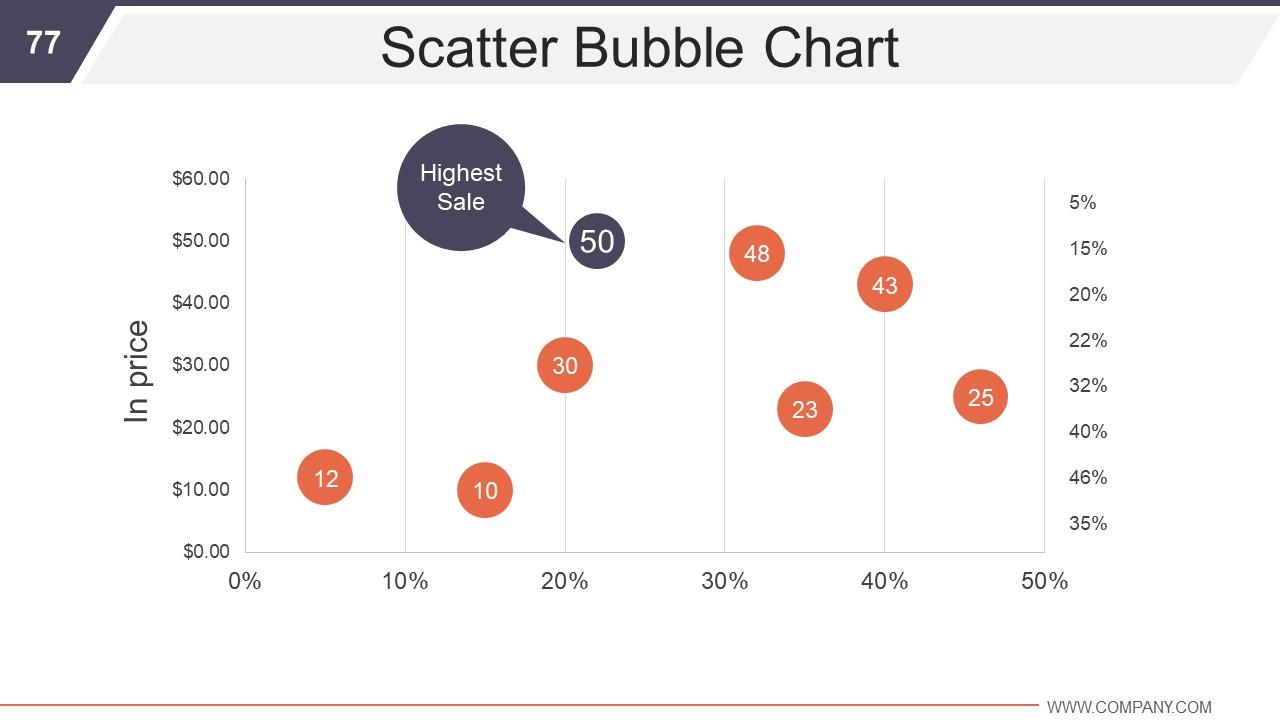
Slide 77: This is Scatter Bubble Chart slide show product comparison, growth etc.
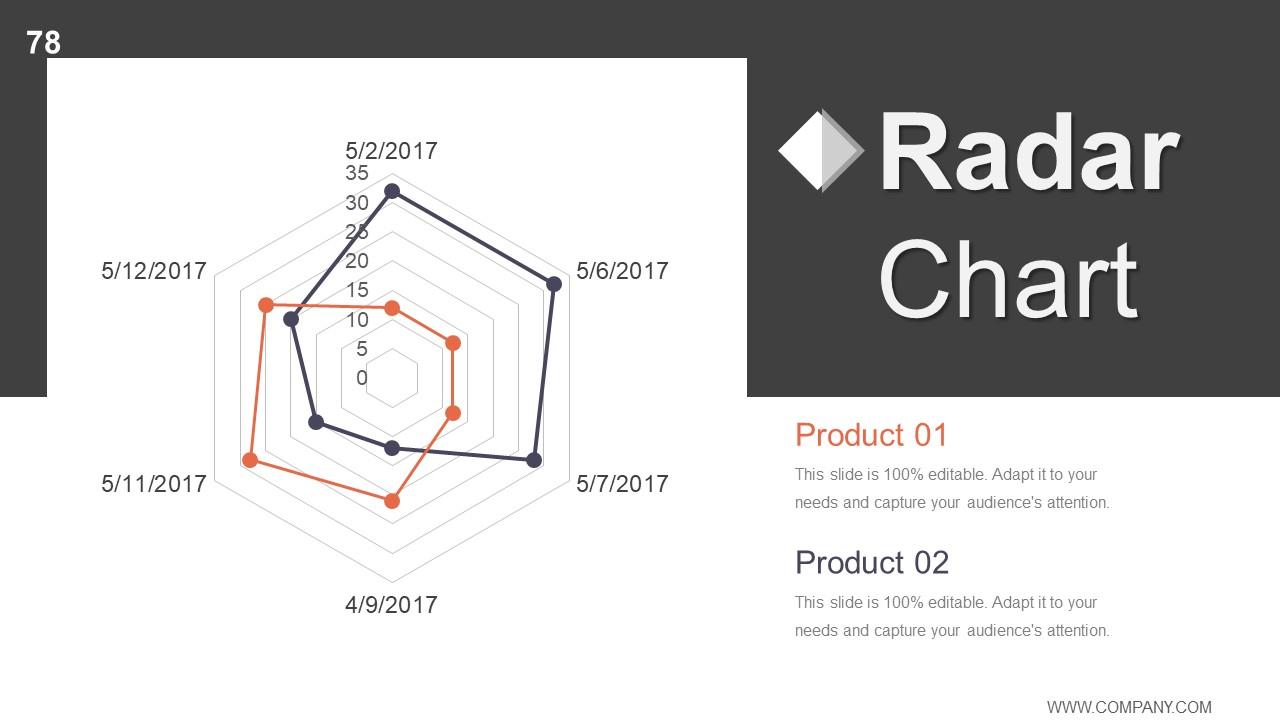
Slide 78: This is a Radar Chart slide to show product comparison etc.
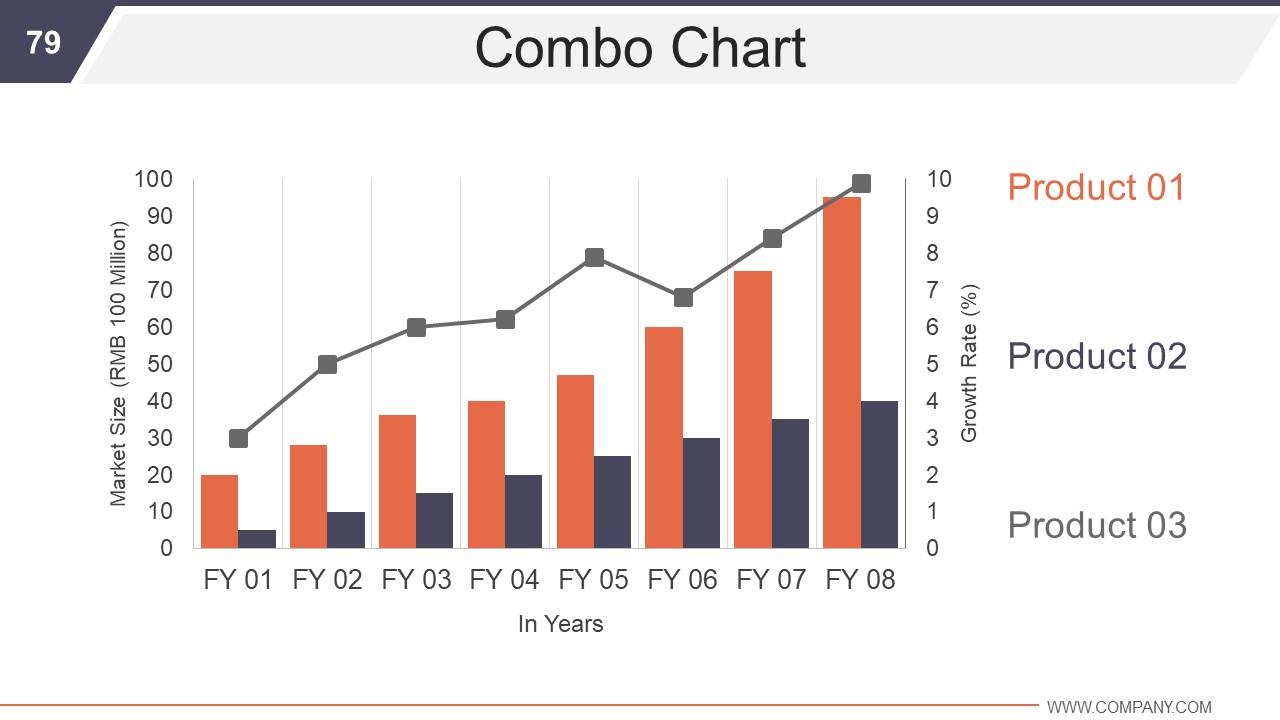
Slide 79: This is a Combo Chart for showing product/entity comparison, information etc.
Slide 80: This is a Thank You slide with Address# street number, city, state, Contact Numbers, Email Address.Business development and operational plan powerpoint presentation slides with all 80 slides:


