Business process optimization customer onboarding process powerpoint presentation slides
Introducing our business process optimization customer onboarding process PowerPoint presentation slides. Retain your customers with help of our business procedure optimization PowerPoint deck. Open up about the challenges and the remedial measures using our client onboarding PPT layout. Using this consumer orientation PowerPoint design helps in identifying the actions needed to increase customer interest. Incorporate this ready to use customer processing PPT theme to accurately measure the key onboarding metrics. Assimilating this business procedure PowerPoint set helps you in discovering new channels for advertising your product and generating new leads. Use this commerce boosting PPT template to deal with major challenges of customer engagement. Keep check on all your diligent efforts for sales marketing by incorporating this user processing PPT bundle. This customer incorporation PPT deck lets you create required variations to icons and colors, making this PPT more practical. Choose this user boosting process PowerPoint design to showcase organization and assurance. Download this PPT slide to explore true perfection.
- Google Slides is a new FREE Presentation software from Google.
- All our content is 100% compatible with Google Slides.
- Just download our designs, and upload them to Google Slides and they will work automatically.
- Amaze your audience with SlideTeam and Google Slides.
-
Want Changes to This PPT Slide? Check out our Presentation Design Services
- WideScreen Aspect ratio is becoming a very popular format. When you download this product, the downloaded ZIP will contain this product in both standard and widescreen format.
-

- Some older products that we have may only be in standard format, but they can easily be converted to widescreen.
- To do this, please open the SlideTeam product in Powerpoint, and go to
- Design ( On the top bar) -> Page Setup -> and select "On-screen Show (16:9)” in the drop down for "Slides Sized for".
- The slide or theme will change to widescreen, and all graphics will adjust automatically. You can similarly convert our content to any other desired screen aspect ratio.
Compatible With Google Slides

Get This In WideScreen
You must be logged in to download this presentation.
PowerPoint presentation slides
Presenting our business process optimization customer onboarding process PowerPoint presentation slides. This PowerPoint design contains fifty slides in it which can be completely customized and edited. It is available for both standard as well as for widescreen formats. This PowerPoint template is compatible with all the presentation software like Microsoft Office, Google Slides, etc. It can be downloaded in varying formats like JPEG, PDF, PNG, etc. You can download this PPT layout by clicking on the button below.
Content of this Powerpoint Presentation
Slide 1: This is the title slide for the Business Process Optimization Customer Onboarding Process.
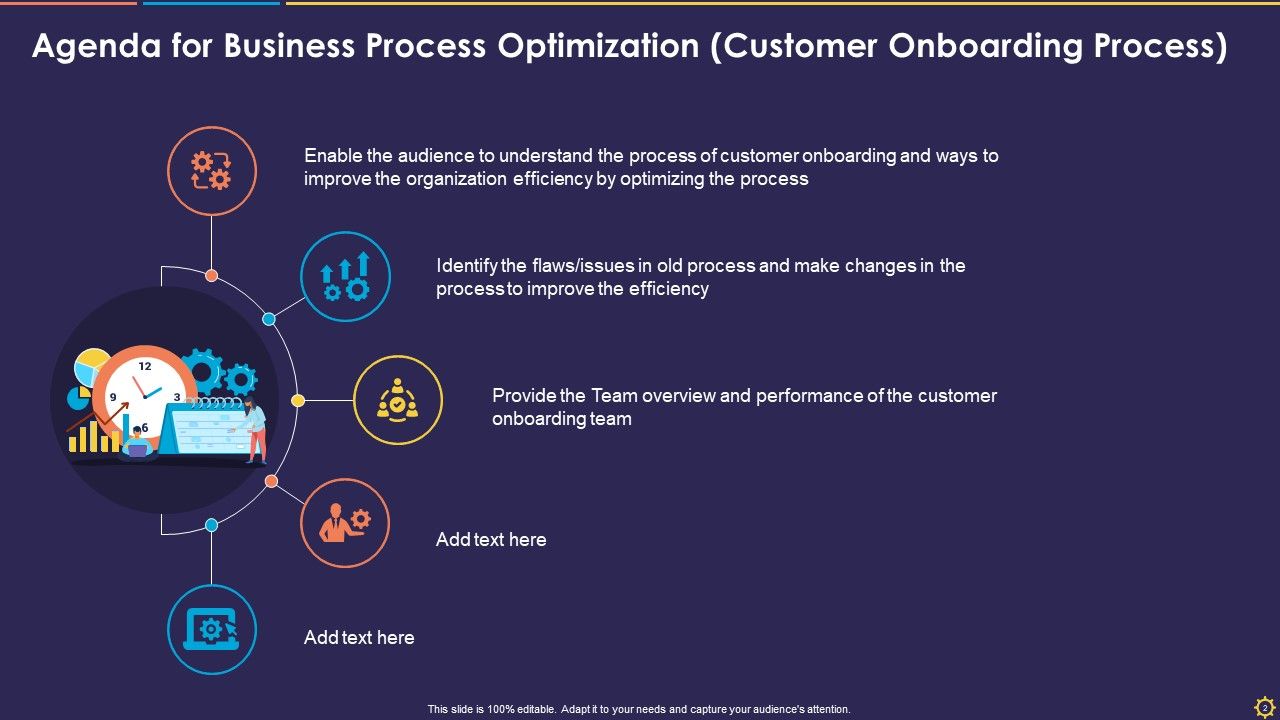
Slide 2: This slide shows the Agenda list for the Business Process Optimization Customer Onboarding Process with three additions already given.
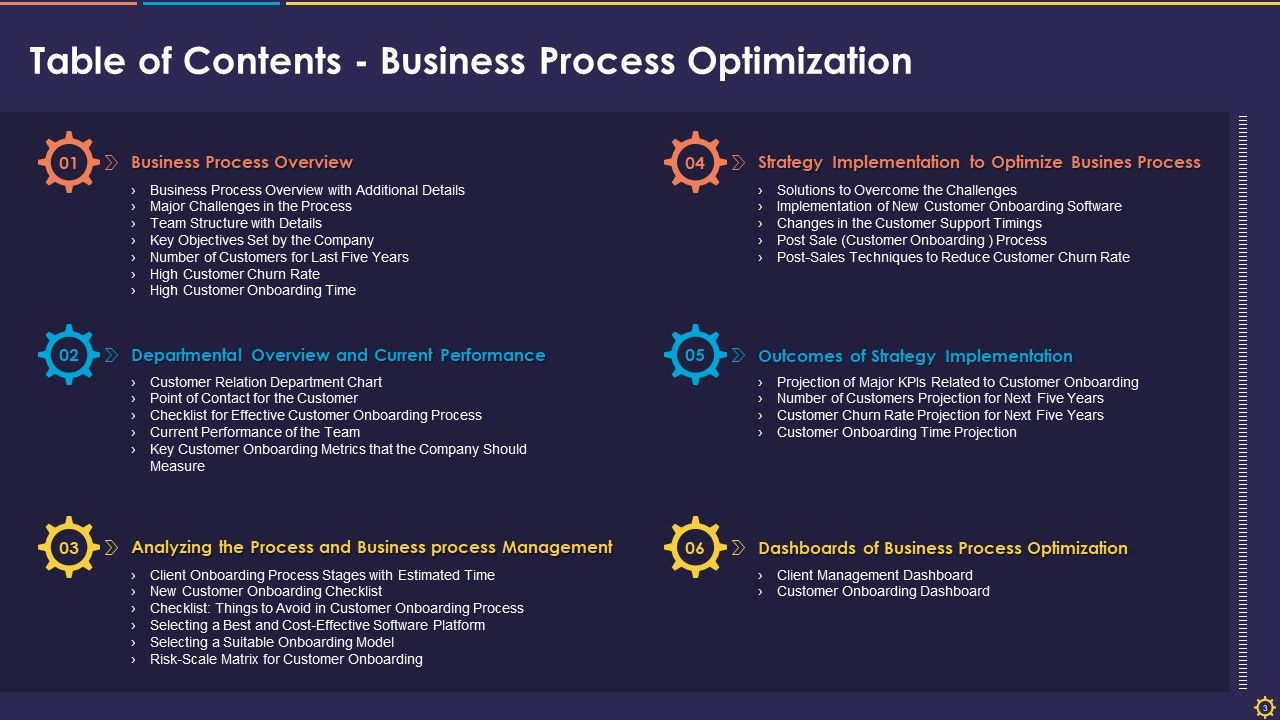
Slide 3: This slide displays the Table of Contents for Business Process Optimization covering Business Process Overview, Departmental Overview, and Current Performance, Analyzing the Process and Business Process Management, Dashboards of Business Process Optimization, Outcomes of Strategy Implementation, and Strategy Implementation to Optimize Business Process.
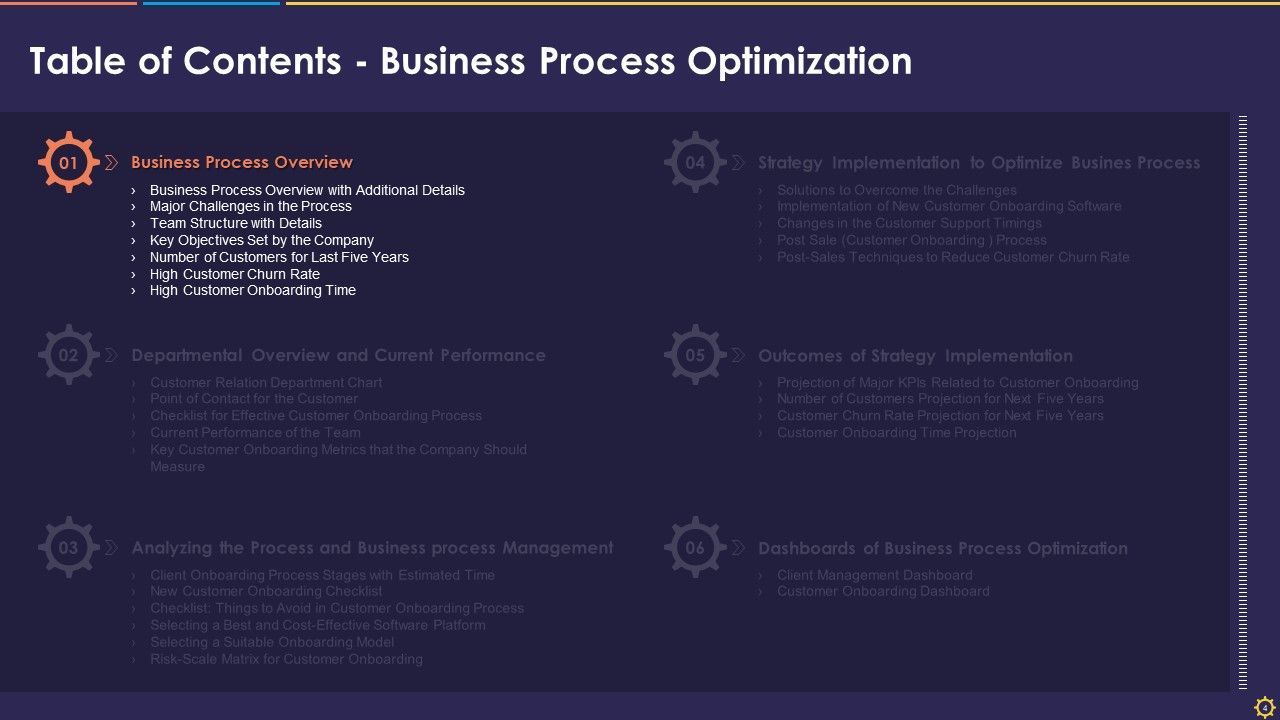
Slide 4: This slide introduces the Business Process Overview division of the presentation with Business Process Overview with Additional Details, Major Challenges in the Process, Team Structure with Details, Key Objectives Set by the Company, Number of Customers for Last Five Years, High Customer Churn Rate, and High Customer Onboarding Time.
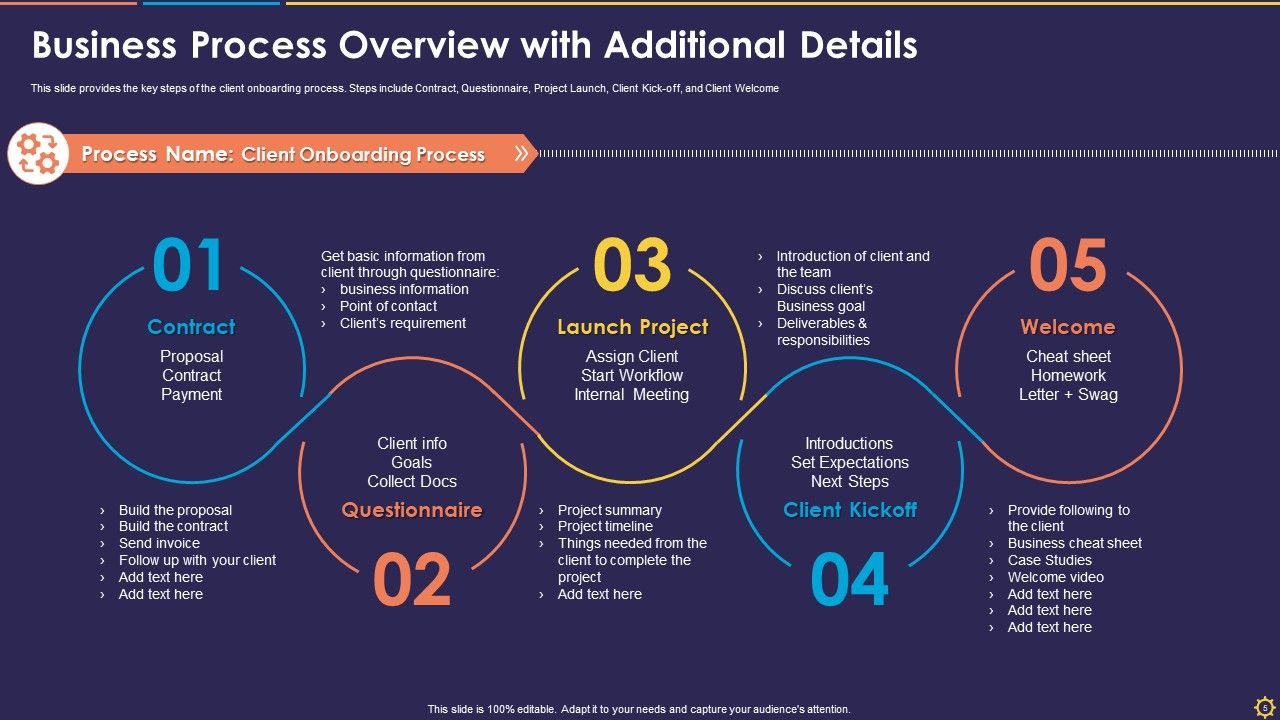
Slide 5: This slide shows the Business Process Overview with Additional Details. This slide provides the key steps of the client onboarding process including Contract, Questionnaire, Project Launch, Client Kick-off, and Client Welcome.
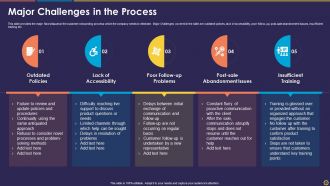
Slide 6: This slide provides the major challenges in the customer onboarding process which the company needs to eliminate. Major Challenges covered in the slide are outdated policies, lack of accessibility, poor follow-up, post-sale abandonment issues, insufficient training, etc.
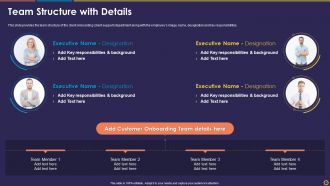
Slide 7: This slide presents the team structure of the client onboarding (client support) department along with the employee’s image, name, designation, and key responsibilities.
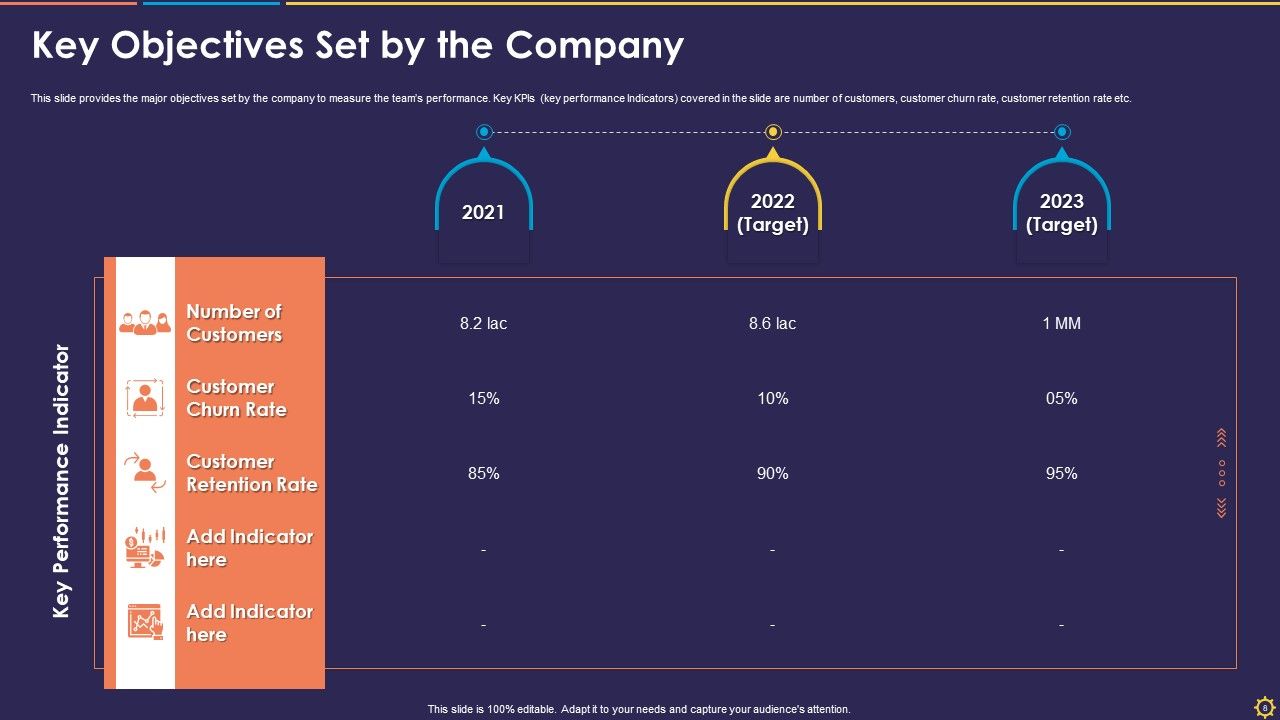
Slide 8: This slide shows the major objectives set by the company to measure the team’s performance. Key KPIs (key performance Indicators) covered in the slide are the number of customers, customer churn rate, and customer retention rate.
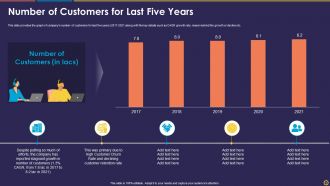
Slide 9: This slide displays a graph about the Number of Customers for the Last Five Years from 2017 to 2021 along with the key details such as CAGR growth rate, the reason behind the growth or decline, etc.
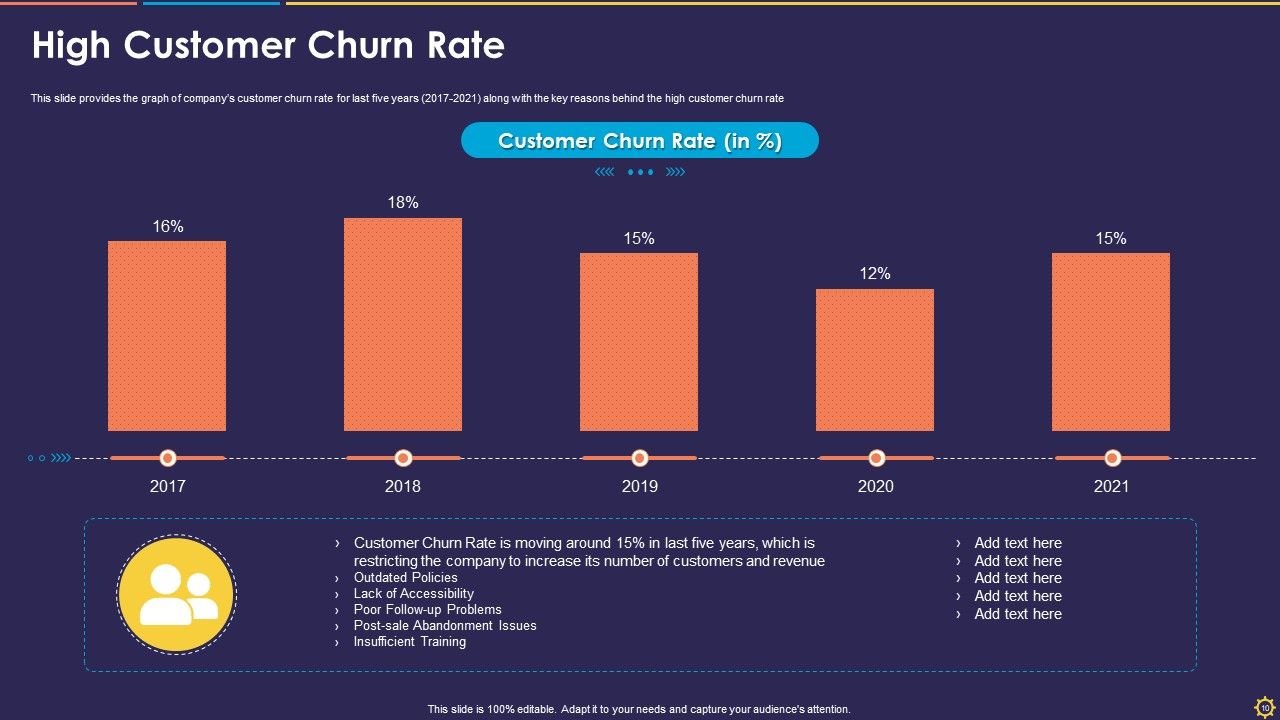
Slide 10: This slide provides the graph of the company’s customer churn rate for the last five years (2017-2021) along with the key reasons behind the high customer churn rate.
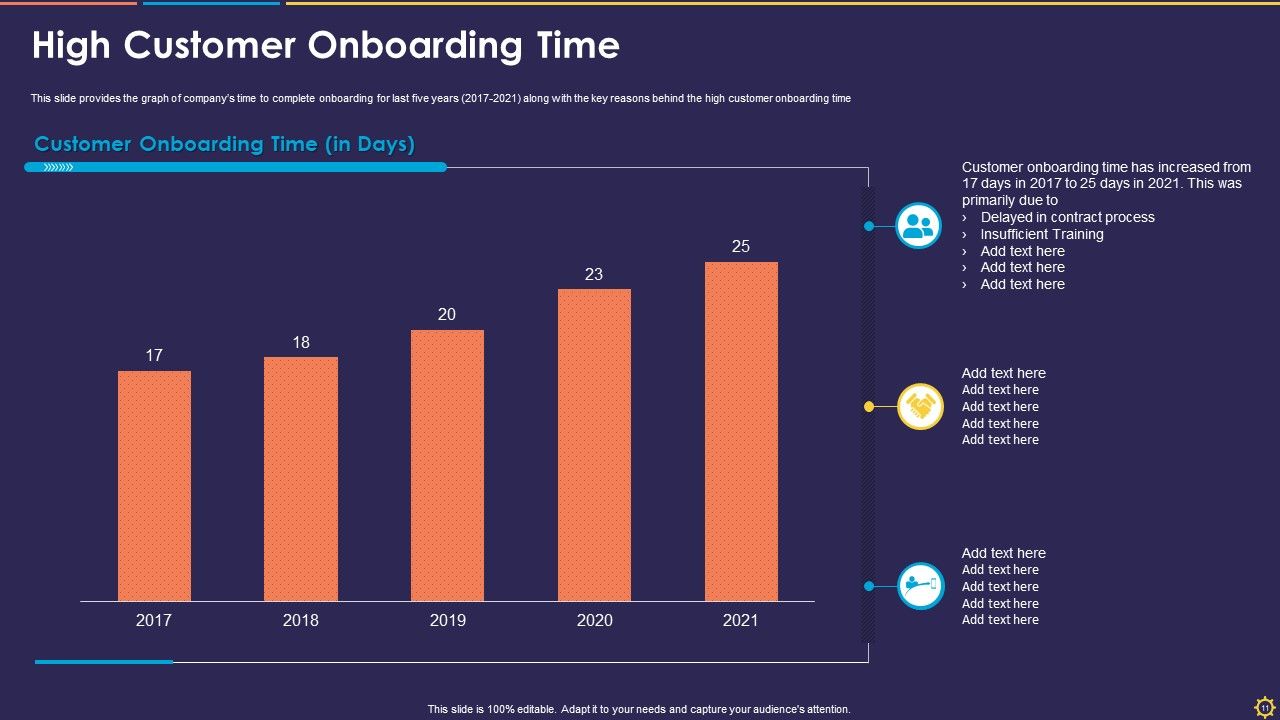
Slide 11: This slide illustrates High Customer Onboarding Time. It provides the graph of the company’s time to complete onboarding for the last five years (2017-2021) along with the key reasons behind the high customer onboarding time.
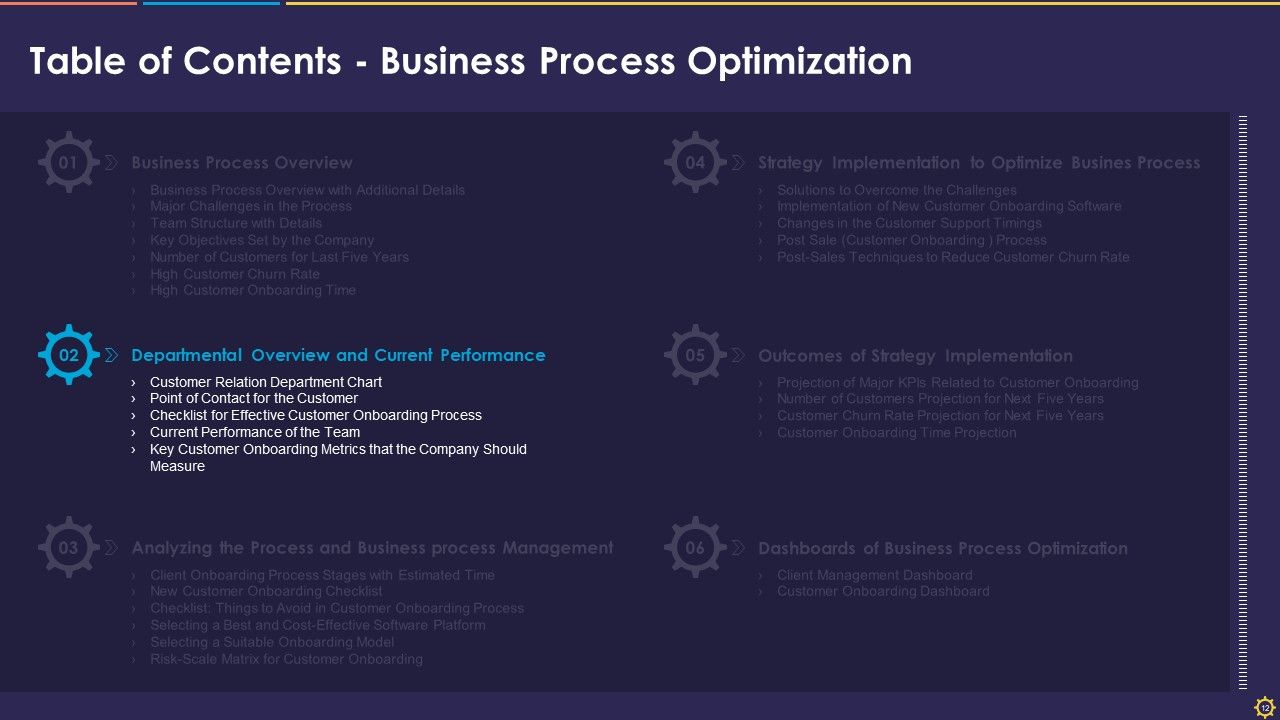
Slide 12: This slide introduces the Departmental Overview and Current Performance section of the presentation covering sub-topics such as Customer Relation Department Chart, Point of Contact for the Customer, Checklist for Effective Customer Onboarding Process, Current Performance of the Team, and Key Customer Onboarding Metrics that the Company Should Measure.
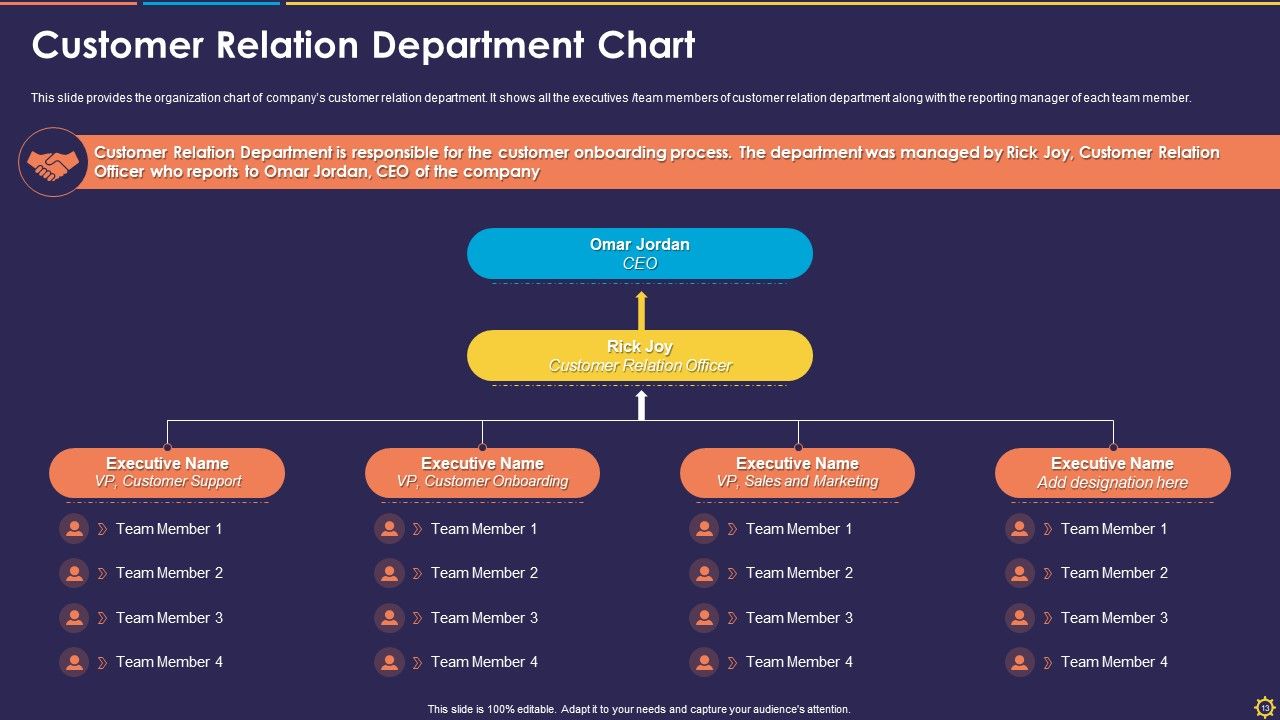
Slide 13: This slide provides the customer relation department organization chart of the company’s customer relation department. It shows all the executives /team members of the customer relations department along with the reporting manager of each team member.
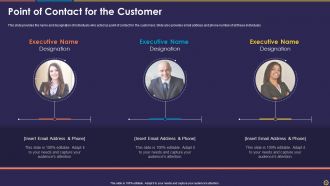
Slide 14: This slide shows the Point of Contact for the Customer. It provides the name and designation of individuals who acted as points of contact for the customers. The slide also provides the email addresses and phone numbers of all these individuals.
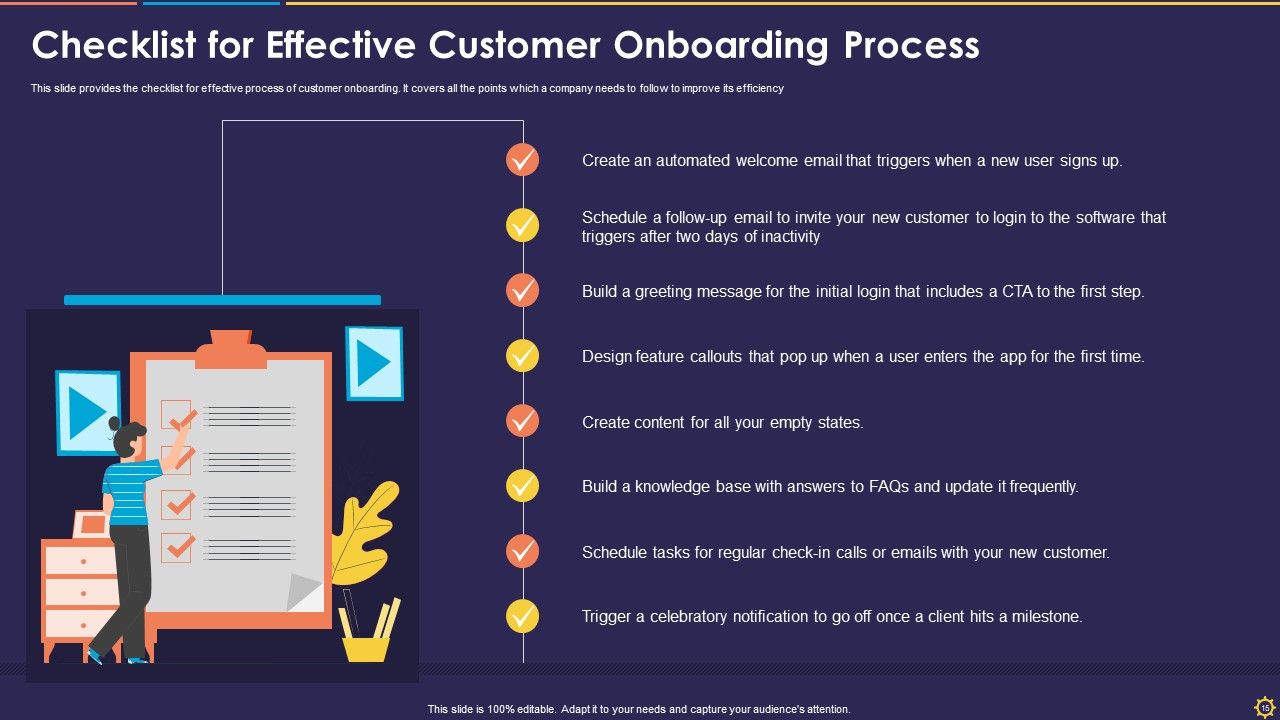
Slide 15: This slide displays a Checklist for Effective Customer Onboarding processes. It covers all the points which a company needs to follow to improve its efficiency Create an automated welcome email that triggers when a new user signs up.
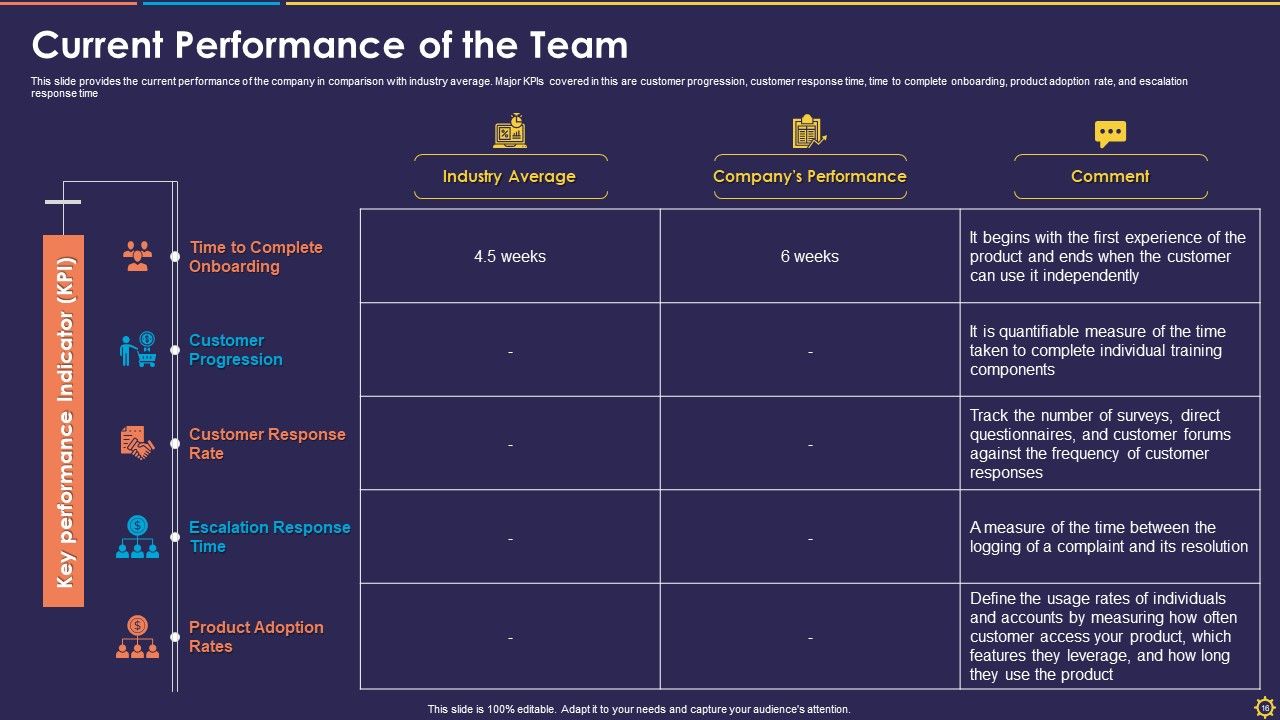
Slide 16: This slide showcases the Current Performance of the Team. It provides the current performance of the company in comparison with the industry average. Major KPIs covered in this are customer progression, customer response time, time to complete onboarding, product adoption rate, and escalation response time.
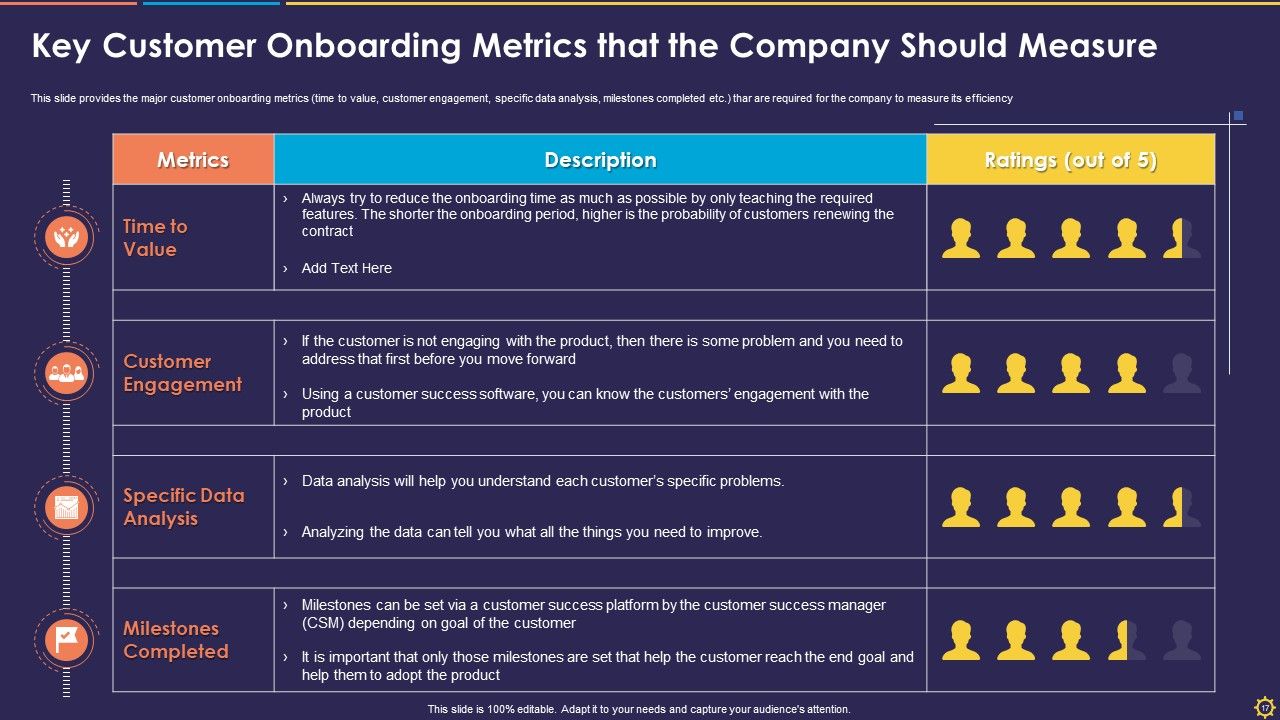
Slide 17: This slide gives insight into the Key Customer Onboarding Metrics that the Company Should Measure.
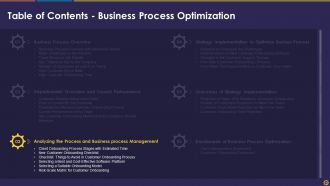
Slide 18: This slide introduces Analyzing the Process and Business process Management division of this presentation with sub-headings such as Client Onboarding Process Stages with Estimated Time, New Customer Onboarding Checklist, Checklist: Things to Avoid in Customer Onboarding Process, Selecting a Best and Cost-Effective Software Platform, Selecting a Suitable Onboarding Model, and Risk-Scale Matrix for Customer Onboarding.
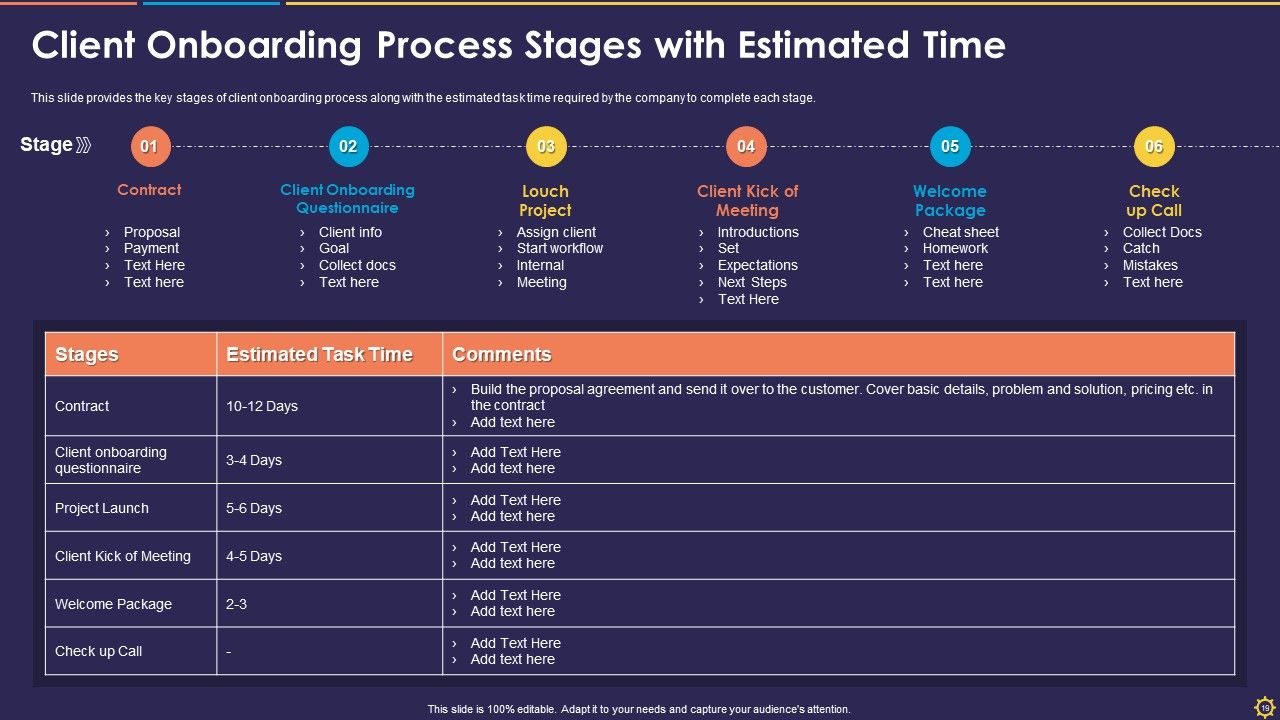
Slide 19: This slide shows the Client Onboarding Process Stages with Estimated Time such as Contract, Client Onboarding Questionnaire, Launch Project, Client Kick-off Meeting, Welcome Package, and Check-up Call.
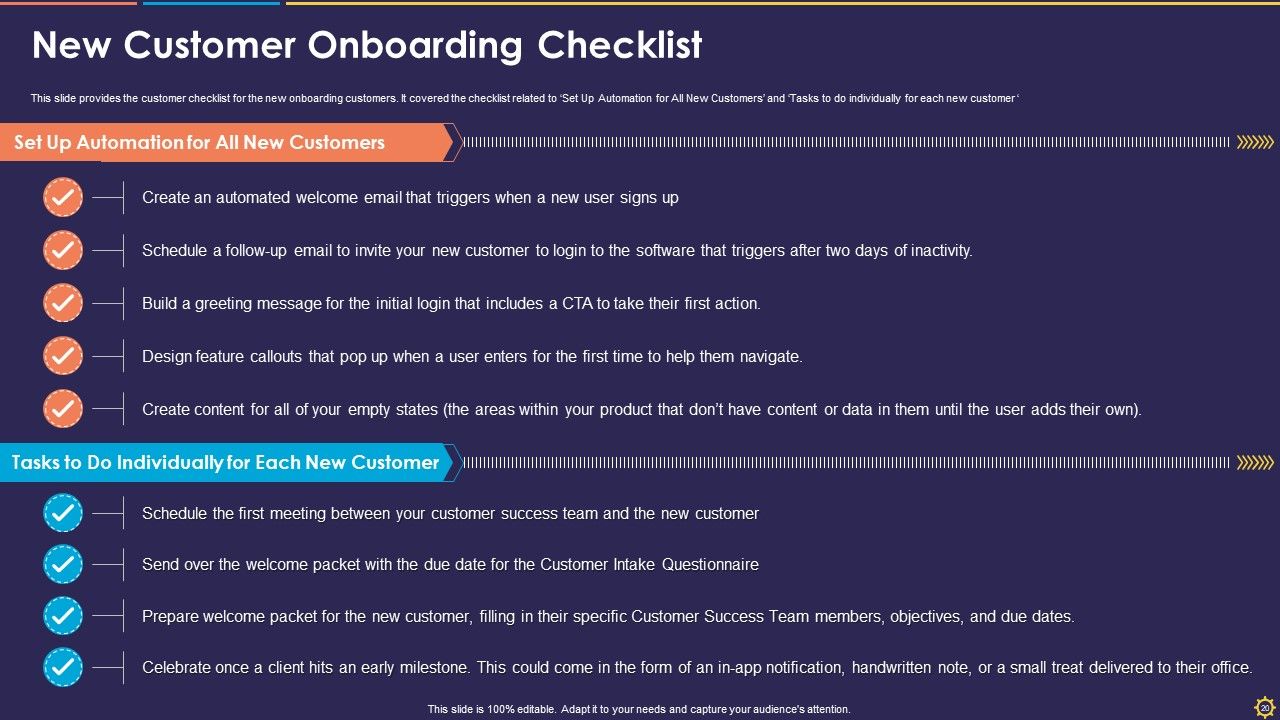
Slide 20: This slide provides a New Customer Onboarding Checklist. It covers the checklist related to ‘Set Up Automation for All-New Customers’ and ‘Tasks to do individually for each new customer'.
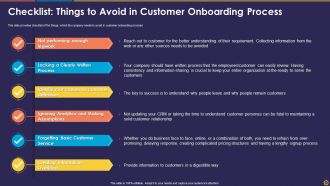
Slide 21: This slide provides a checklist of the things, which the company needs to avoid in the customer onboarding process.
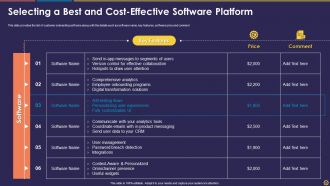
Slide 22: This slide displays Selecting the Best and Cost-Effective Software Platform. It provides the list of customer onboarding software along with the details such as software name, key features, software price, and comments.
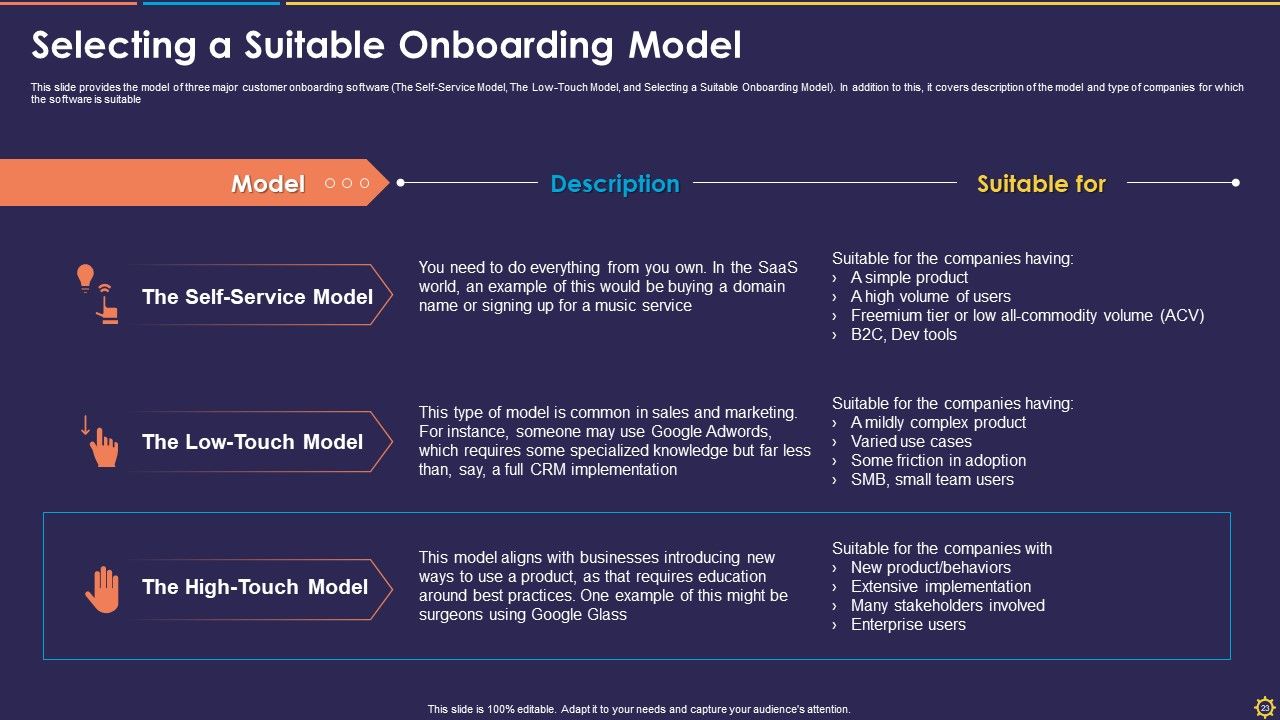
Slide 23: This slide shows the model of three major customer onboarding software (The Self-Service Model, The Low-Touch Model, and Selecting a Suitable Onboarding Model). In addition to this, it covers the description of the model and the type of companies for which the software is suitable.
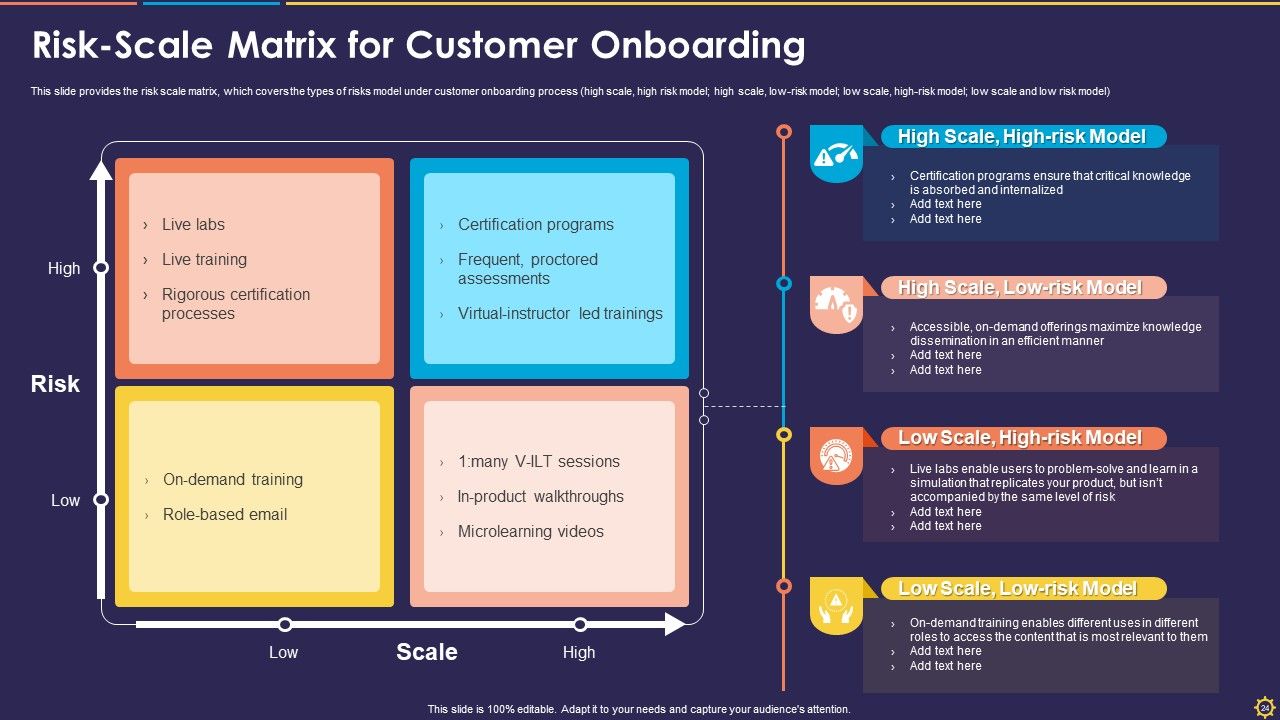
Slide 24: This slide provides the risk scale matrix for customer onboarding, which covers the types of risks model under the customer onboarding process (high scale, high-risk model; high scale, low-risk model; low scale, high-risk model; low scale and low-risk model).
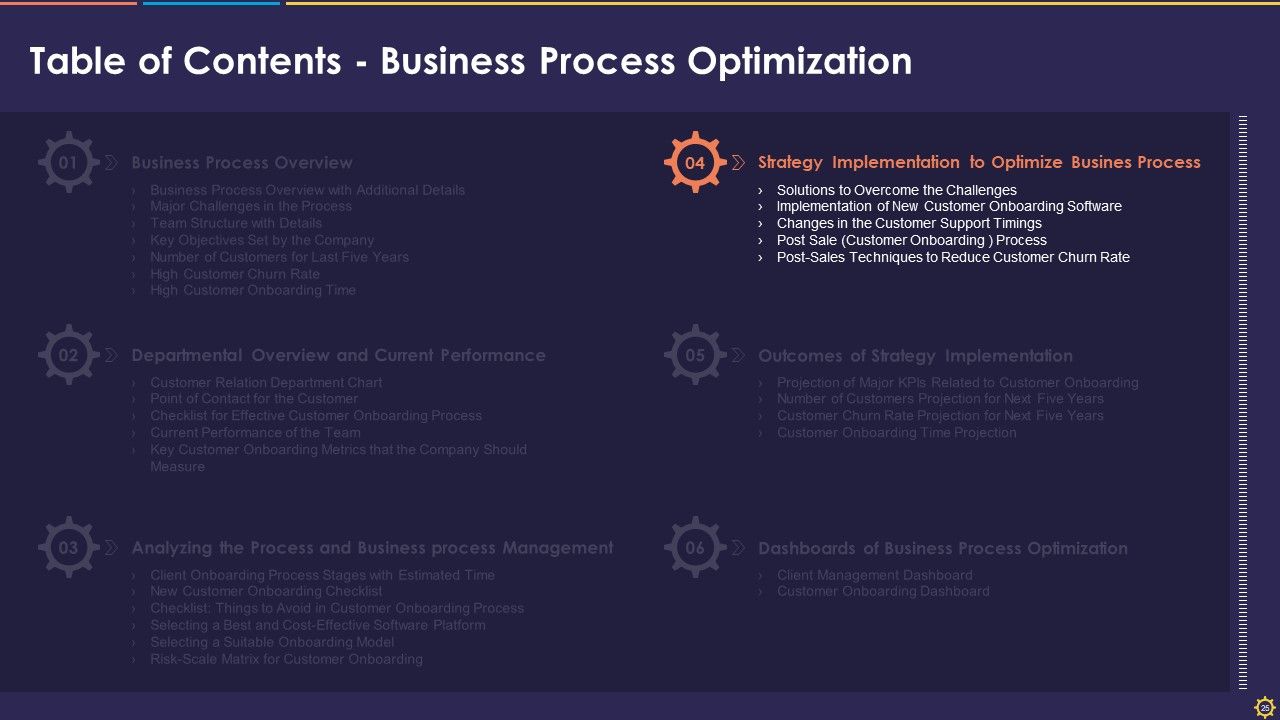
Slide 25: This slide introduces the Strategy Implementation to Optimize Business Process section of the deck with the following divisions. Solutions to Overcome the Challenges, Implementation of New Customer Onboarding Software, Changes in the Customer Support Timings, Post Sale (Customer Onboarding ) Process, and Post-Sales Techniques to Reduce Customer Churn Rate.
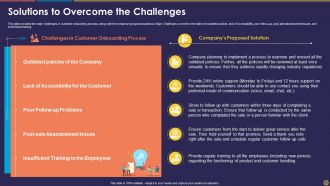
Slide 26: This slide shows the Solutions to Overcome the Challenges in the customer onboarding process, along with the company’s proposed solutions. Major Challenges covered in the slide are outdated policies, lack of accessibility, poor follow-up, post-sale abandonment issues, and insufficient training.
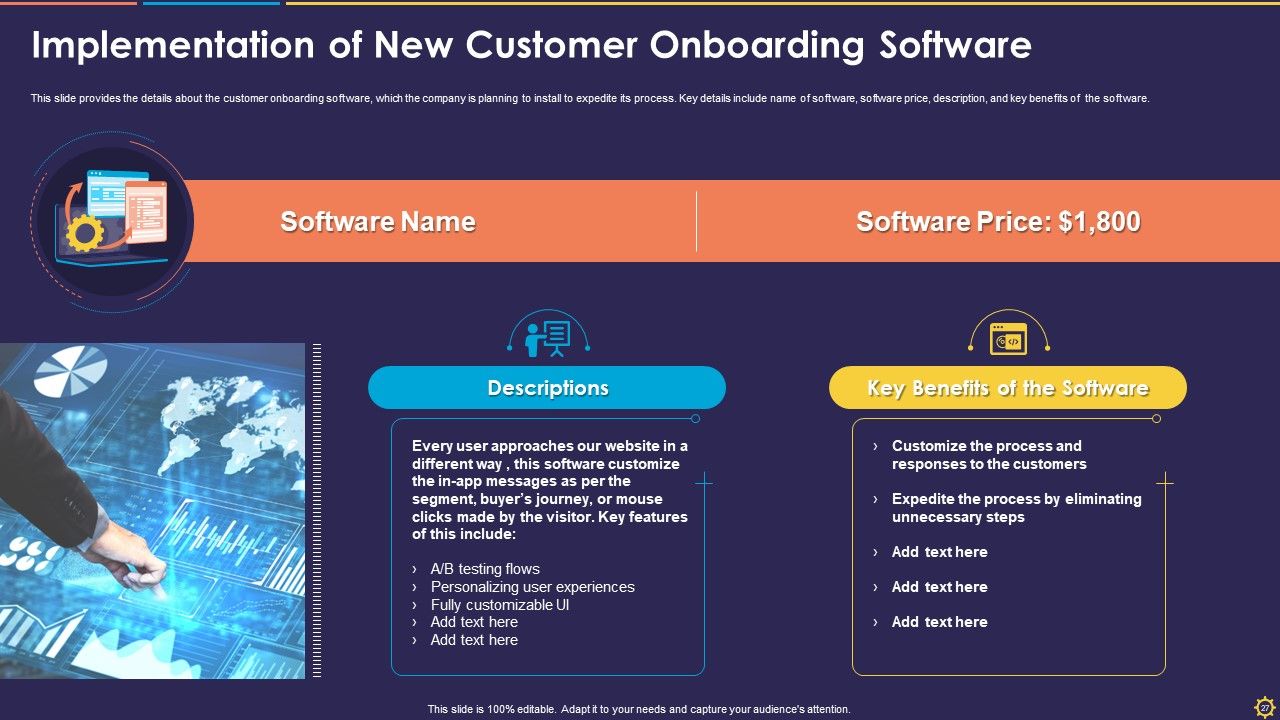
Slide 27: This slide displays the details about the Implementation of New Customer Onboarding Software which the company is planning to install to expedite its process. Key details include the name of the software, software price, description, and key benefits of the software.
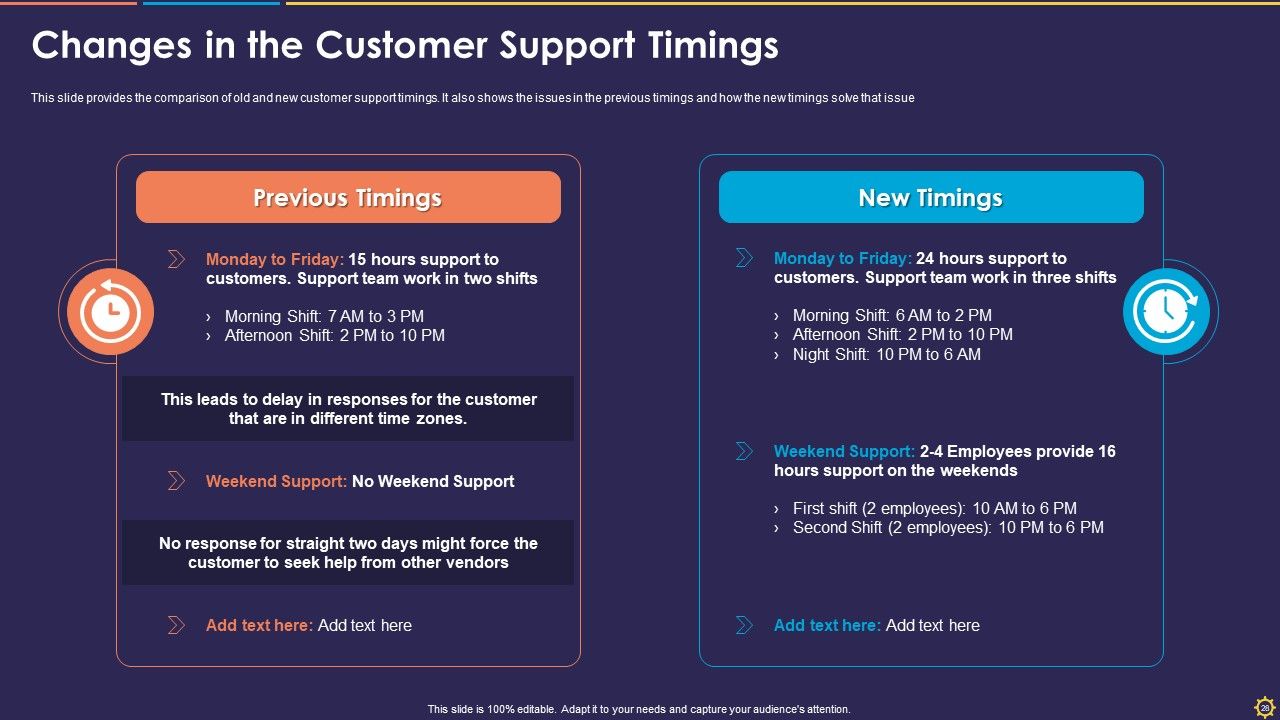
Slide 28: This slide showcases the Changes in the Customer Support Timings. It also shows the issues in the previous timings and how the new timings solve that issue.
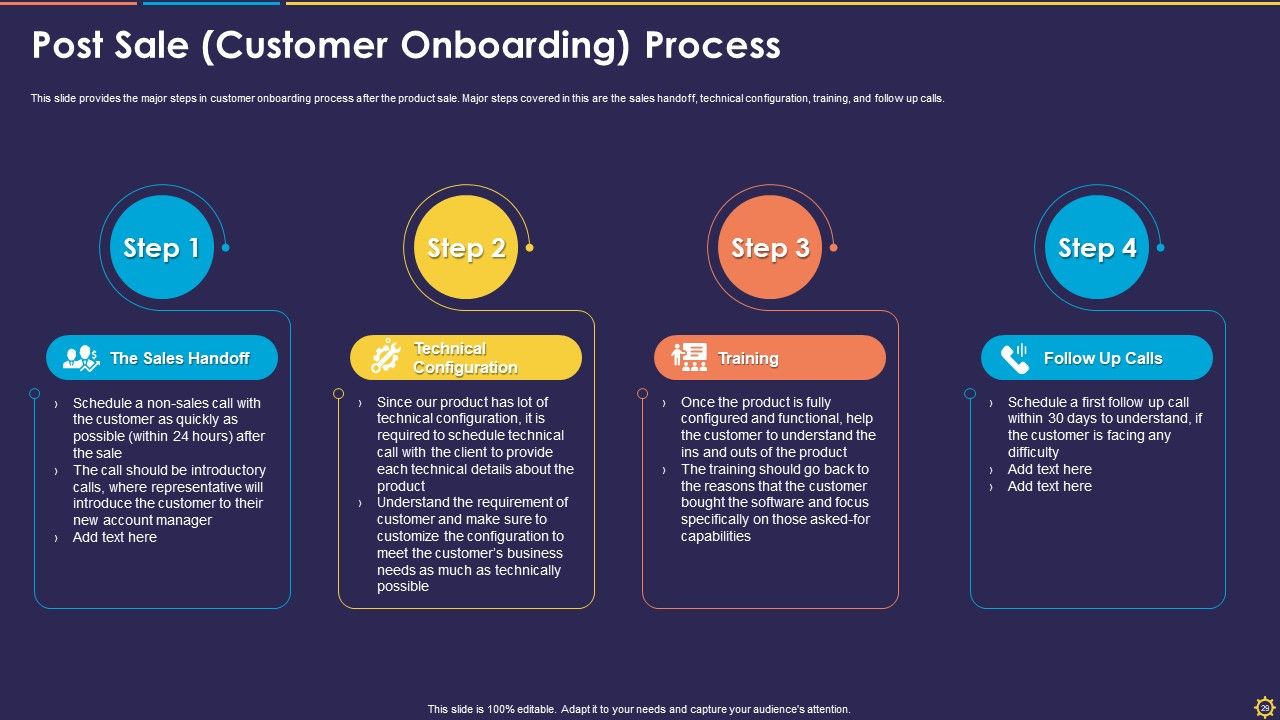
Slide 29: This slide provides the major steps in the customer onboarding process after the product sale. Major steps covered in this are the sales handoff, technical configuration, training, and follow-up calls.
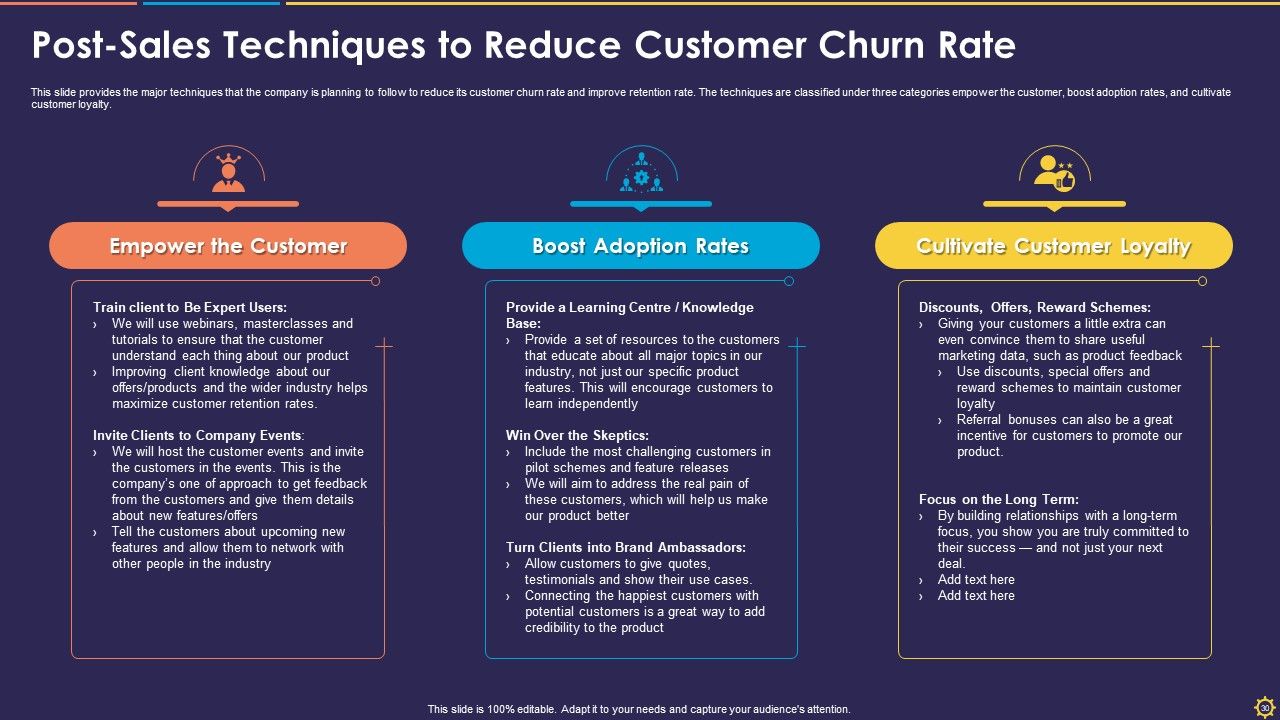
Slide 30: This slide demonstrates the Post-Sales Techniques to Reduce Customer Churn Rate. The techniques are classified under three categories empower the customer, boost adoption rates, and cultivate customer loyalty.
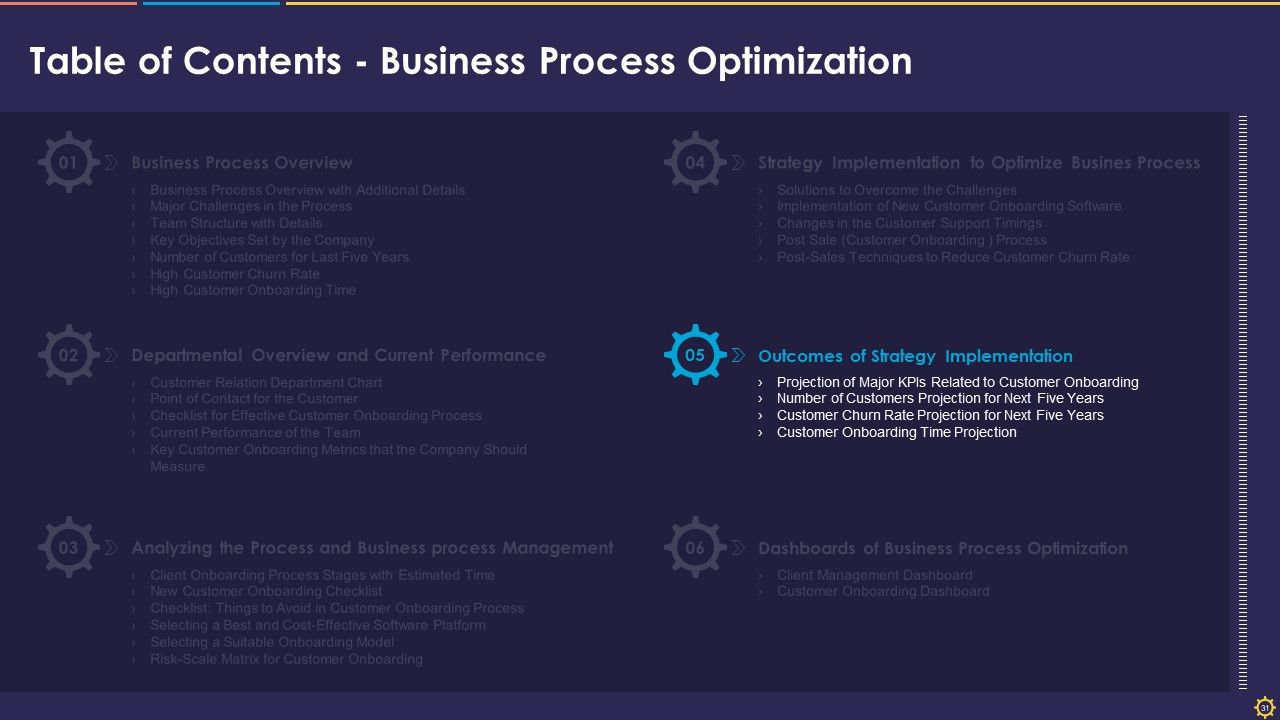
Slide 31: This slide introduces the Outcomes of the Strategy Implementation division of the presentation with the following sub-sections - Projection of Major KPIs Related to Customer Onboarding, Number of Customers Projection for Next Five Years, Customer Churn Rate Projection for Next Five Years, and Customer Onboarding Time Projection.
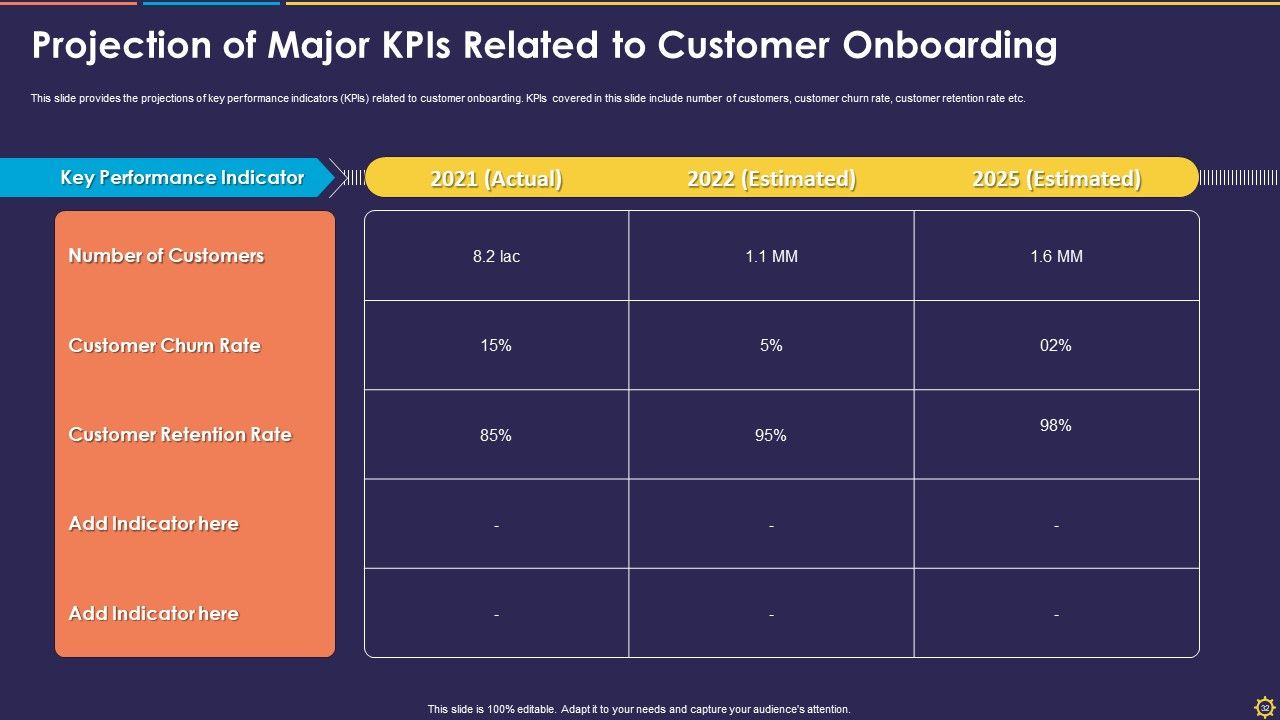
Slide 32: This slide shows the Projection of Major KPIs Related to Customer Onboarding. KPIs covered in this slide include number of customers, customer churn rate, customer retention rate.
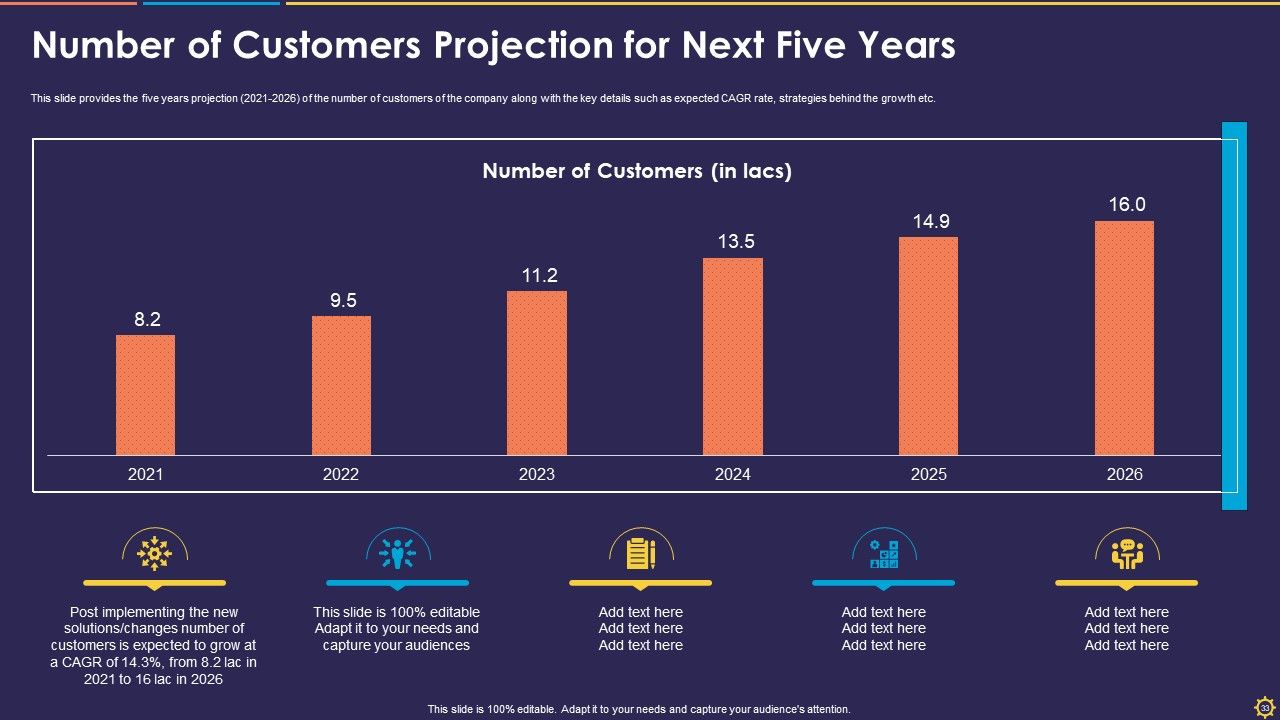
Slide 33: This slide displays the Number of Customers Projection for the Next Five Years from 2021 to 2026 along with the key details such as expected CAGR rate, strategies behind the growth, etc.
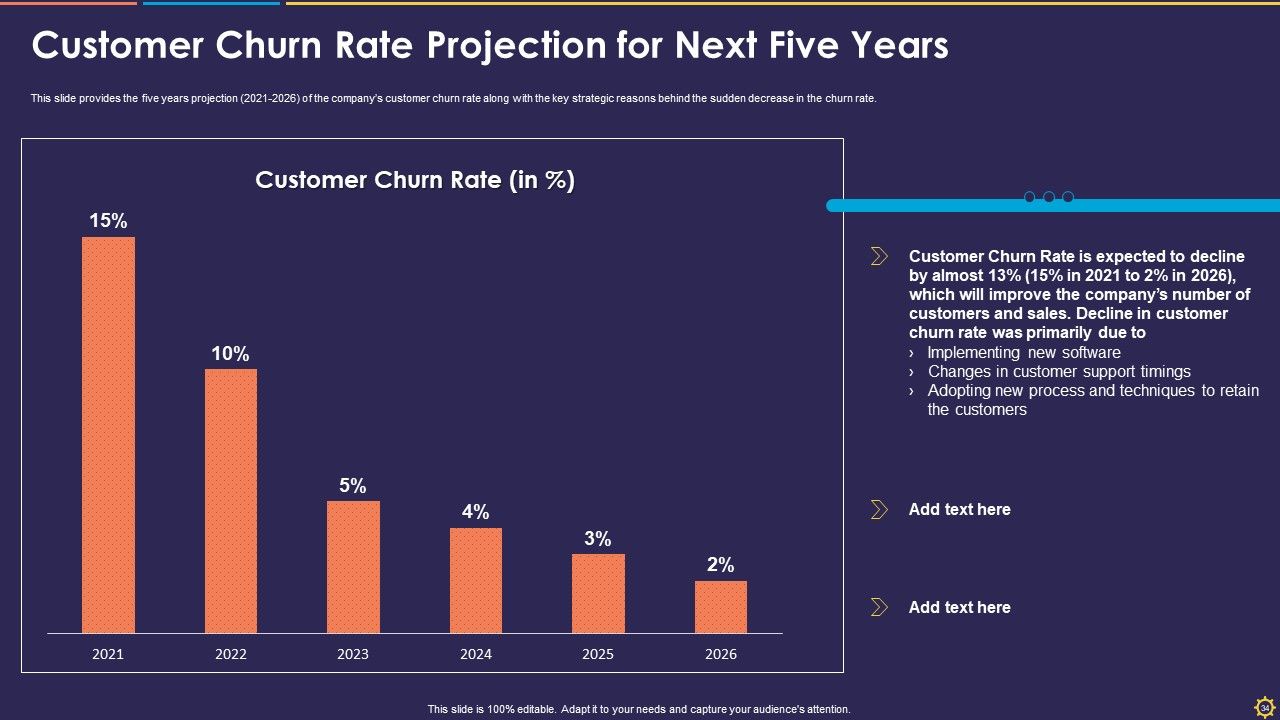
Slide 34: This slide provides the five years projection (2021-2026) of the company’s customer churn rate along with the key strategic reasons behind the sudden decrease in the churn rate.
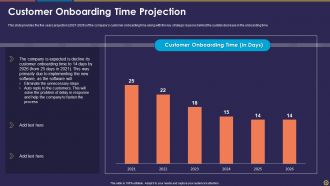
Slide 35: This slide illustrates the five years projection (2021-2026) of the company’s customer onboarding time along with the key strategic reasons behind the sudden decrease in the onboarding time.
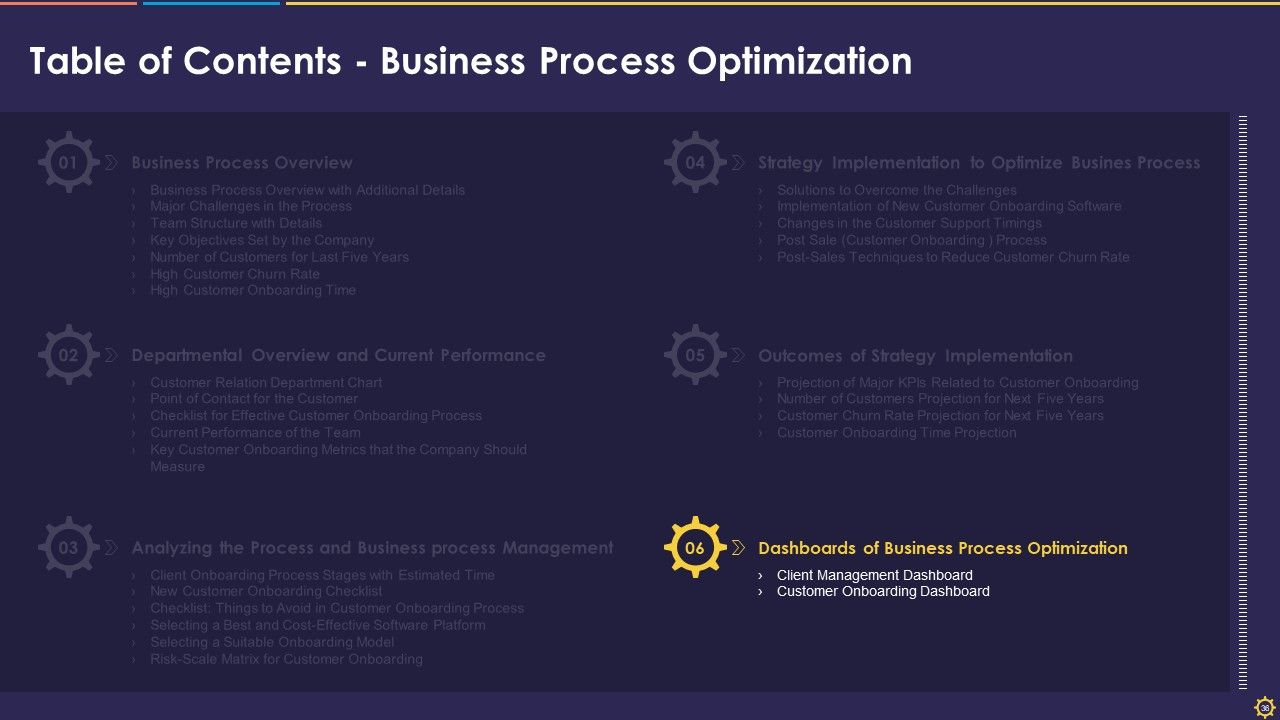
Slide 36: This slide introduces the Dashboards of Business Process Optimization division of this presentation with two subtopics including Client Management Dashboard, and Customer Onboarding Dashboard.
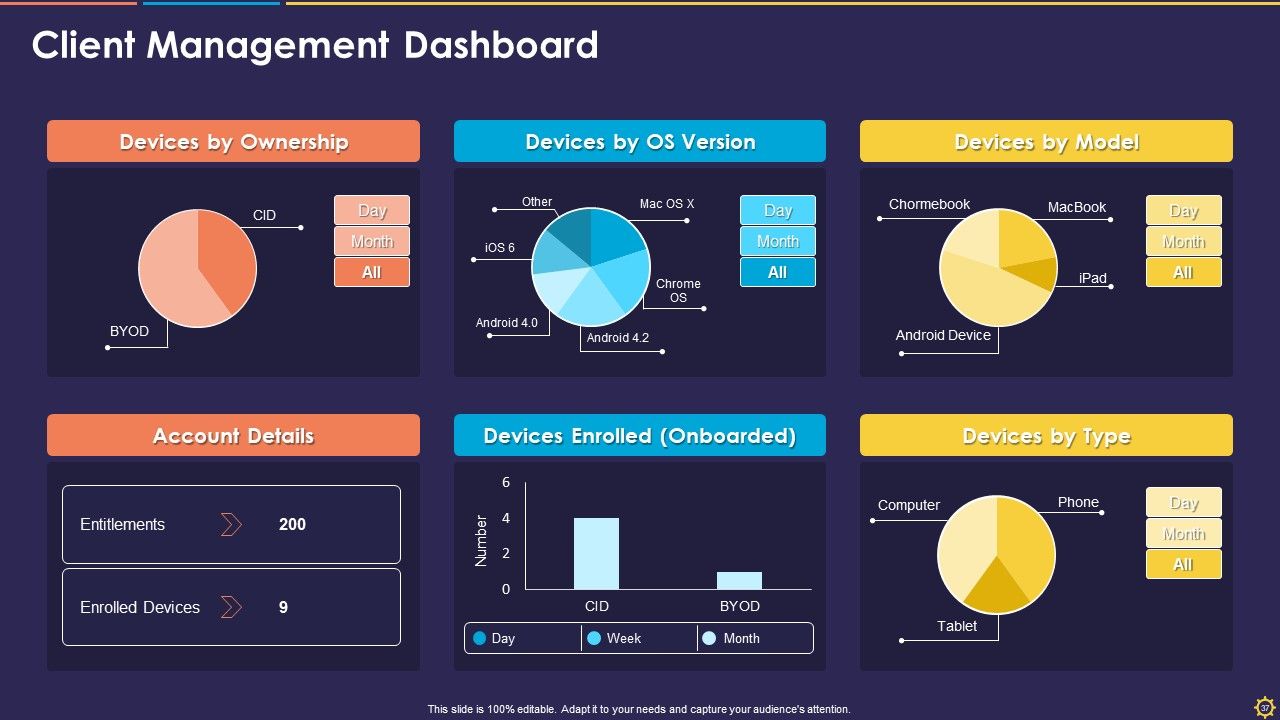
Slide 37: This slide shows the Client Management Dashboard covering Account Details, Devices by Ownership, Devices by OS Version, Devices by Type, Devices Enrolled (Onboarded), and Devices by Model.
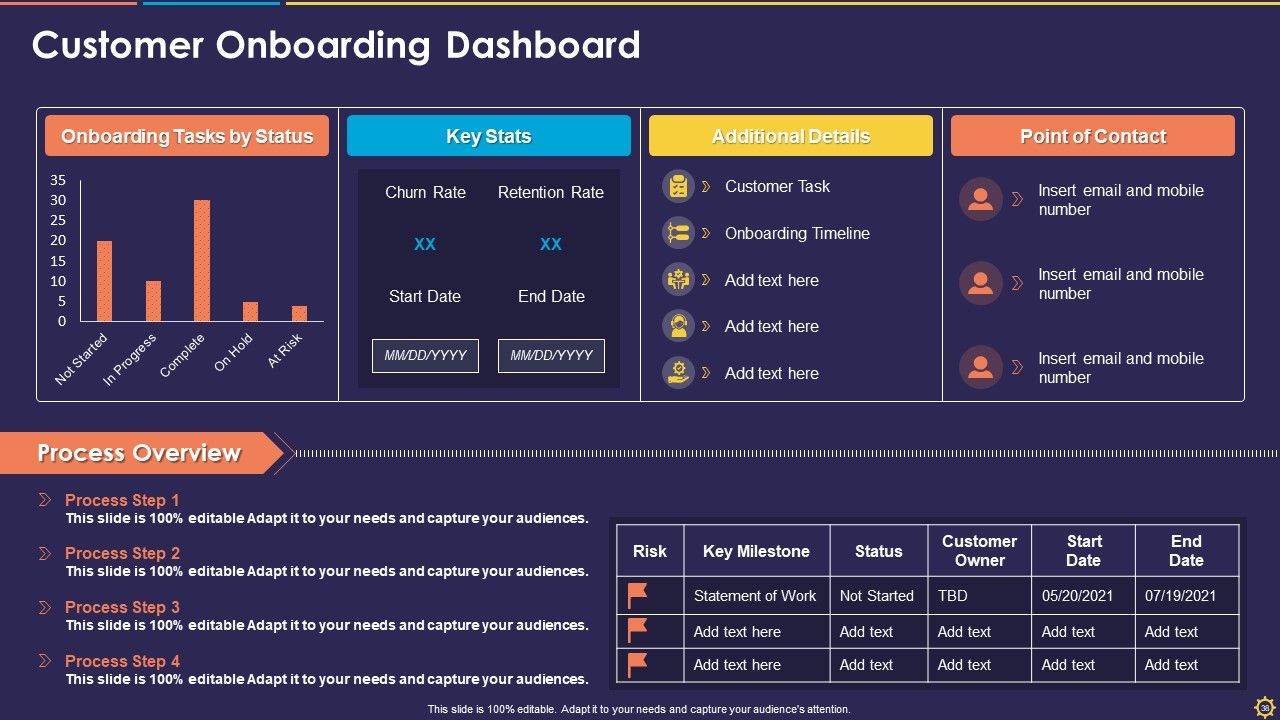
Slide 38: This slide displays the Customer Onboarding Dashboard with details about Onboarding Tasks by Status, Point of Contact, Additional Details, Key Stats, and Process Overview.
Slide 39: This slide illustrates the additional icons provided with the presentation on the Business Process Optimization Customer Onboarding Process.
Slide 40: This slide introduces the Additional Slides given with this presentaiton.
Slide 41: This slide is titled 'Our Mission' with sections on Vision, Mission, and Goal.
Slide 42: This slide shows our team with their names, designation, images, and profiles.
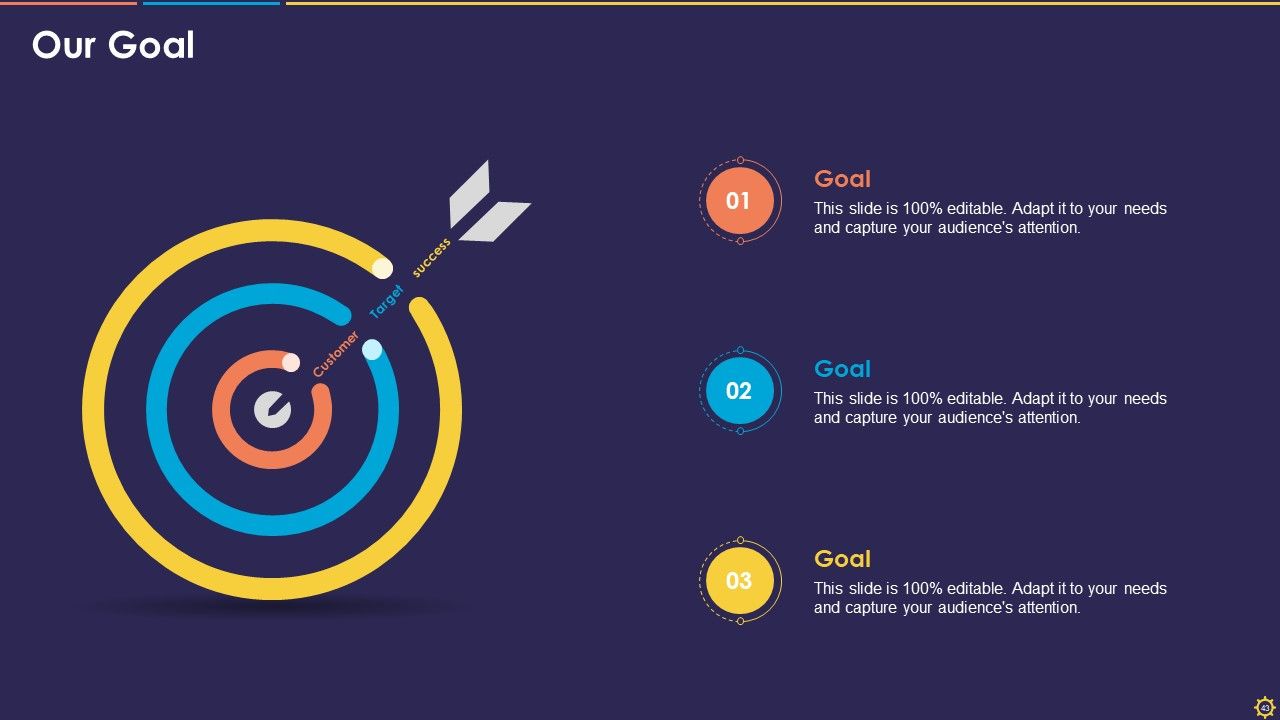
Slide 43: This slide displays Our Goals with a dartboard icon highlighting Customer, Target, and success.
Slide 44: This slide highlights key points About Us such as Target Audience, Premium Services, and Values Client.
Slide 45: This slide illustrates 4 Post It Notes text boxes to present important facts.
Slide 46: This slide shows a Venn diagram with four divisons.
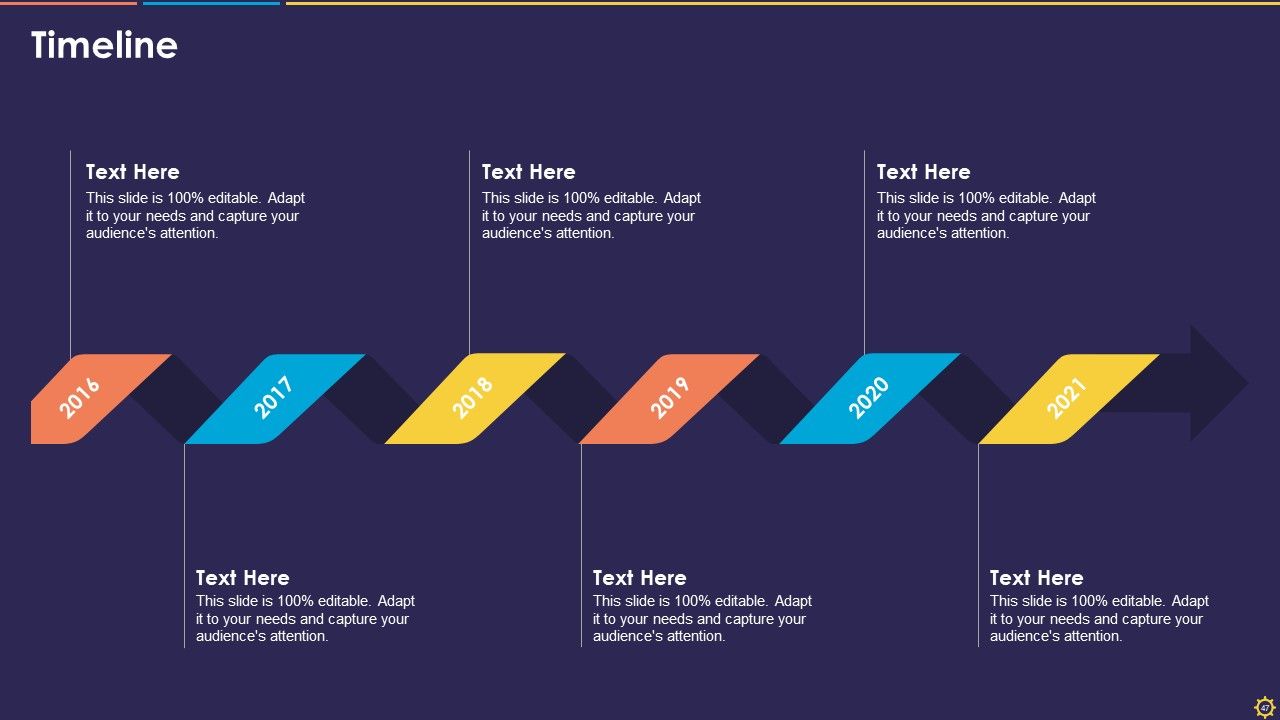
Slide 47: This slide displays a Timeline for six years from 2016 to 2021.
Slide 48: This slide shows four-part jigsaw Puzzle iconsto highlight data.
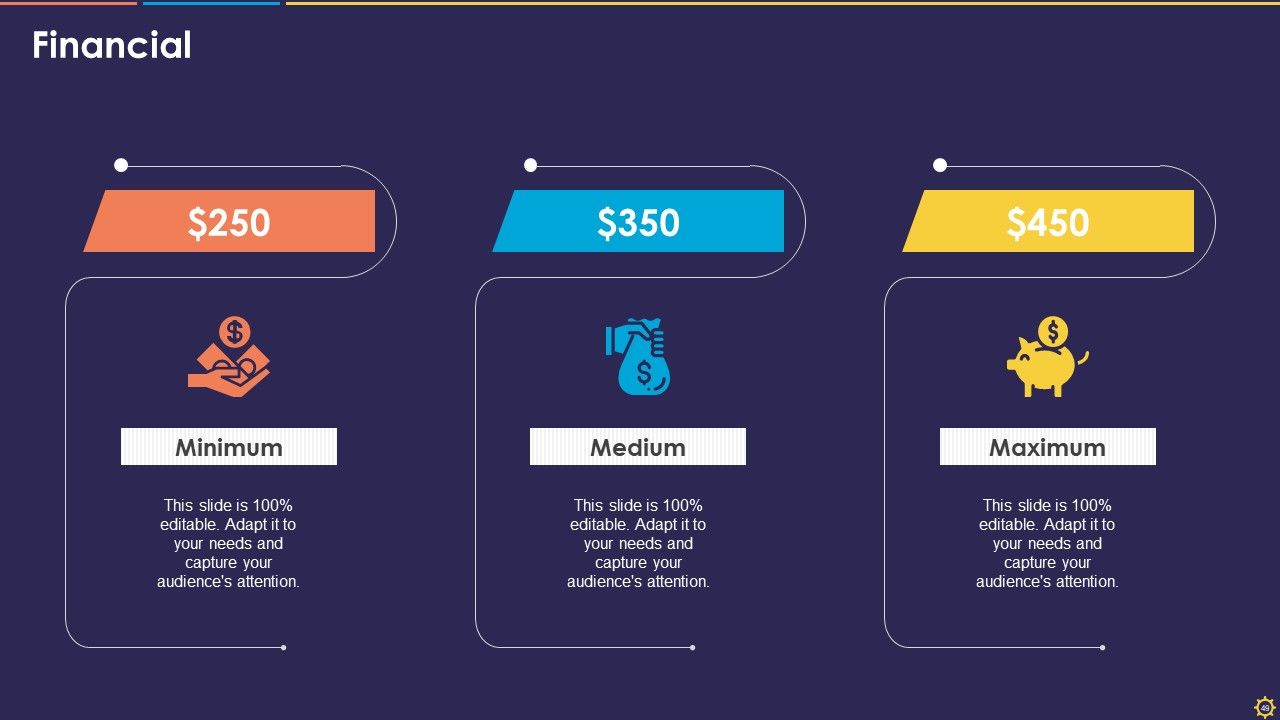
Slide 49: This slide presents the Financial stages for the company under Maximum, Medium, and Minimum levels.
Slide 50: This is the conclusive slide for this presentation with Thank You, Contact Number, Email Address, and Address.
Business process optimization customer onboarding process powerpoint presentation slides with all 50 slides:
Use our Business Process Optimization Customer Onboarding Process Powerpoint Presentation Slides to effectively help you save your valuable time. They are readymade to fit into any presentation structure.
No Reviews


