17499362 style essentials 2 compare 2 piece powerpoint presentation diagram infographic slide
Handle different factions with our Performance Comparison Ppt Infographics. Bring them around to acting for the common good.
Handle different factions with our Performance Comparison Ppt Infographics. Bring them around to acting for the common good.
- Google Slides is a new FREE Presentation software from Google.
- All our content is 100% compatible with Google Slides.
- Just download our designs, and upload them to Google Slides and they will work automatically.
- Amaze your audience with SlideTeam and Google Slides.
-
Want Changes to This PPT Slide? Check out our Presentation Design Services
- WideScreen Aspect ratio is becoming a very popular format. When you download this product, the downloaded ZIP will contain this product in both standard and widescreen format.
-

- Some older products that we have may only be in standard format, but they can easily be converted to widescreen.
- To do this, please open the SlideTeam product in Powerpoint, and go to
- Design ( On the top bar) -> Page Setup -> and select "On-screen Show (16:9)” in the drop down for "Slides Sized for".
- The slide or theme will change to widescreen, and all graphics will adjust automatically. You can similarly convert our content to any other desired screen aspect ratio.
Compatible With Google Slides

Get This In WideScreen
You must be logged in to download this presentation.
PowerPoint presentation slides
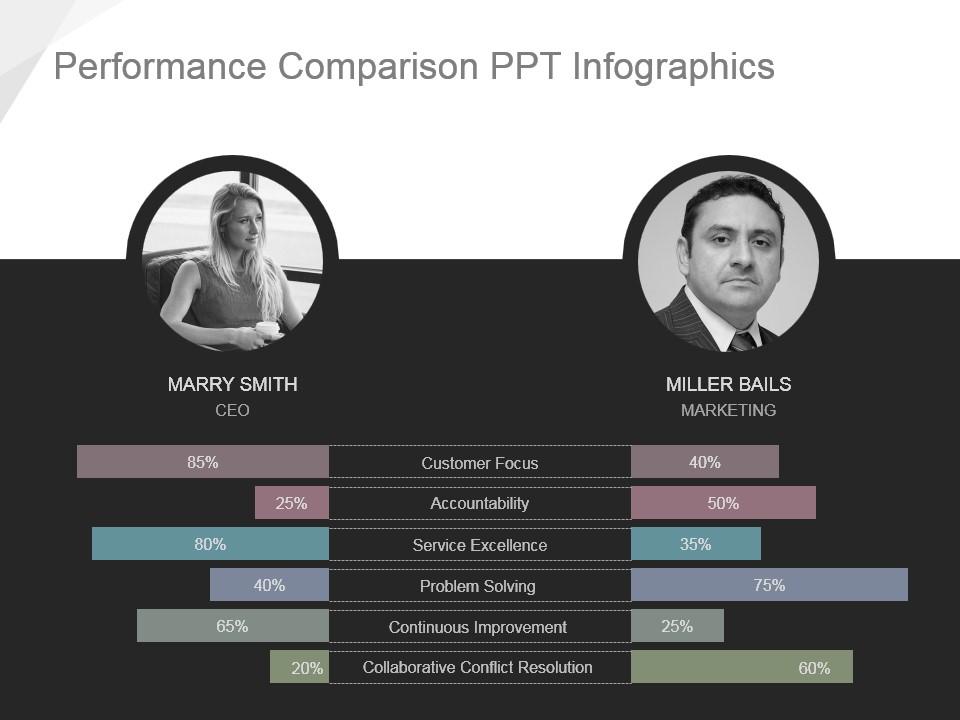
Presenting performance comparison ppt infographics. This is a performance comparison ppt infographics. This is a two stage. The Stages in this process are customer focus, accountability, service excellence, problem solving, continuous improvement, collaborative conflict resolution.
17499362 style essentials 2 compare 2 piece powerpoint presentation diagram infographic slide with all 4 slides:
Be congratulated with our Performance Comparison Ppt Infographics. Get handshakes from all around.
-
Designs have enough space to add content.
-
Visually stunning presentation, love the content.


