30184107 style division donut 3 piece powerpoint presentation diagram infographic slide
Don't allow arrogance to blind you with our Profit And Expenses Percentage Circle. They ensure you are always grounded.
Don't allow arrogance to blind you with our Profit And Expenses Percentage Circle. They ensure you are always grounded.
- Google Slides is a new FREE Presentation software from Google.
- All our content is 100% compatible with Google Slides.
- Just download our designs, and upload them to Google Slides and they will work automatically.
- Amaze your audience with SlideTeam and Google Slides.
-
Want Changes to This PPT Slide? Check out our Presentation Design Services
- WideScreen Aspect ratio is becoming a very popular format. When you download this product, the downloaded ZIP will contain this product in both standard and widescreen format.
-

- Some older products that we have may only be in standard format, but they can easily be converted to widescreen.
- To do this, please open the SlideTeam product in Powerpoint, and go to
- Design ( On the top bar) -> Page Setup -> and select "On-screen Show (16:9)” in the drop down for "Slides Sized for".
- The slide or theme will change to widescreen, and all graphics will adjust automatically. You can similarly convert our content to any other desired screen aspect ratio.
Compatible With Google Slides

Get This In WideScreen
You must be logged in to download this presentation.
PowerPoint presentation slides
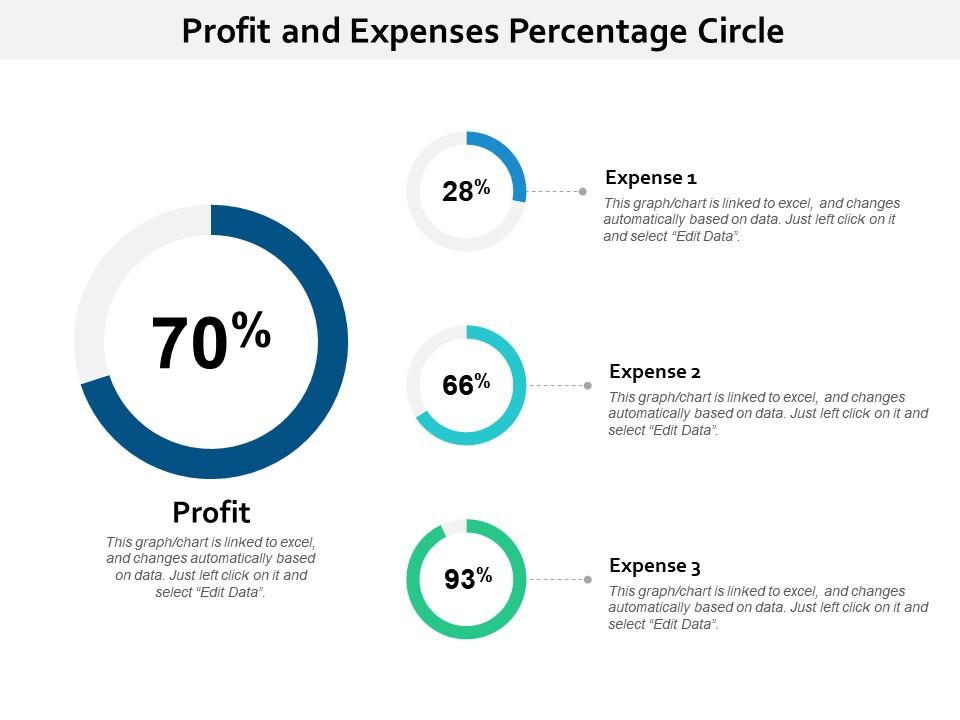
Presenting this set of slides with name - Profit And Expenses Percentage Circle. This is a three stage process. The stages in this process are Percentage Circle, Percentage Round, Pie Chart.
Content of this Powerpoint Presentation
Description:
The image displays a presentation slide titled "Profit and Expenses Percentage Circle." The slide contains four donut charts, each chart representing a percentage value. The largest chart in the center represents 'Profit' annotated with a significant 70%. Around it are three smaller charts indicating 'Expense 1' at 28%, 'Expense 2' at 66%, and 'Expense 3' at 93%. Below each donut chart, there is a text box explaining that the graph or chart is linked to Excel and can be dynamically updated by clicking on it and selecting "Edit Data." This functionality allows real-time data synchronization and an easier update process for the presenter, reflecting changes in the underlying dataset without manually adjusting the chart.
Use Cases:
Now, let's explore seven potential industries where this type of presentation slide could be utilized:
1. Financial Services:
Use: Visualizing financial performance and expense management
Presenter: Financial analyst
Audience: Investors and company management
2. Retail:
Use: Showcasing profit margins and categorizing different operational costs
Presenter: Store manager or retail operations analyst
Audience: Retail executives and stakeholders
3. Healthcare:
Use: Illustrating cost breakdown of healthcare services and profit ratios
Presenter: Hospital administrator or financial officer
Audience: Hospital board members and department heads
4. Real Estate:
Use: Representing profit on sales and various expenses involved in property management
Presenter: Real estate developer or financial consultant
Audience: Investors and real estate business owners
5. Education:
Use: Demonstrating financial ratios between educational institution earnings and expenditures such as facilities, staff, and materials
Presenter: School financial officer
Audience: School board and educational committee
6. Manufacturing:
Use: Detailing contribution to profits from manufacturing processes and expenses across different departments or processes
Presenter: Operations manager
Audience: Company executives and department managers
7. Information Technology:
Use: Displaying profit from software or service sales and associated expenses like R&D, marketing, and support
Presenter: Chief Financial Officer or financial analyst
Audience: Shareholders and senior management team
30184107 style division donut 3 piece powerpoint presentation diagram infographic slide with all 6 slides:
Formulate a contract that is to your advantage with our Profit And Expenses Percentage Circle. Be able to extract a favorable deal.
No Reviews


