Strategic workforce planning model powerpoint presentation slides
Our content-ready strategic workforce planning PowerPoint presentation has pre-designed templates that provide fact-based methods of understanding workforce behavior. This human resource management PPT presentation contain varied range of PowerPoint templates on organizational development, employee plan, vision mission and values, goals and objectives, performance requirements, core skills and competencies, industry trends external analysis, labor market forecast, demographic makeup of customers, human resource trends, levels of employee performance, current staff composition, managing future workforce needs, gap analysis, gap closing strategies, and employee action management. Our workforce developments strategies framework PowerPoint template can impress your viewers and leave an impact on your audiences. Create the impact you wish to deserve. Download our impressive human capital presentation design for topics like succession planning, workforce management, staffing and personnel, human resource management, human capital, capacity building, workload analysis, supply and demand forecasting and business transformation. This strategic workforce planning model PPT slides can make your presentation look even more impressive. Give off confidence with our Strategic Workforce Planning Model Powerpoint Presentation Slides. Display an attitude of self assurance.
- Google Slides is a new FREE Presentation software from Google.
- All our content is 100% compatible with Google Slides.
- Just download our designs, and upload them to Google Slides and they will work automatically.
- Amaze your audience with SlideTeam and Google Slides.
-
Want Changes to This PPT Slide? Check out our Presentation Design Services
- WideScreen Aspect ratio is becoming a very popular format. When you download this product, the downloaded ZIP will contain this product in both standard and widescreen format.
-

- Some older products that we have may only be in standard format, but they can easily be converted to widescreen.
- To do this, please open the SlideTeam product in Powerpoint, and go to
- Design ( On the top bar) -> Page Setup -> and select "On-screen Show (16:9)” in the drop down for "Slides Sized for".
- The slide or theme will change to widescreen, and all graphics will adjust automatically. You can similarly convert our content to any other desired screen aspect ratio.
Compatible With Google Slides

Get This In WideScreen
You must be logged in to download this presentation.
PowerPoint presentation slides
This PowerPoint presentation includes 67 Slides. All content given in our PowerPoint slides are 100 % editable. PPT slides are accessible in both widescreen and standard format. Presentation templates are useful for business organizations to monitor and measure the impact of strategic workforce planning on business outcomes. All PowerPoint slides are compatible with Google Slides. The stages in this process are workforce planning, human resource management, strategic management etc.
Content of this Powerpoint Presentation
Slide 1: This slide introduces Strategic Workforce Planning Model with relevant imagery.
Slide 2: This is a WELCOME slide.
Slide 3: This is Our Agenda slide to state.
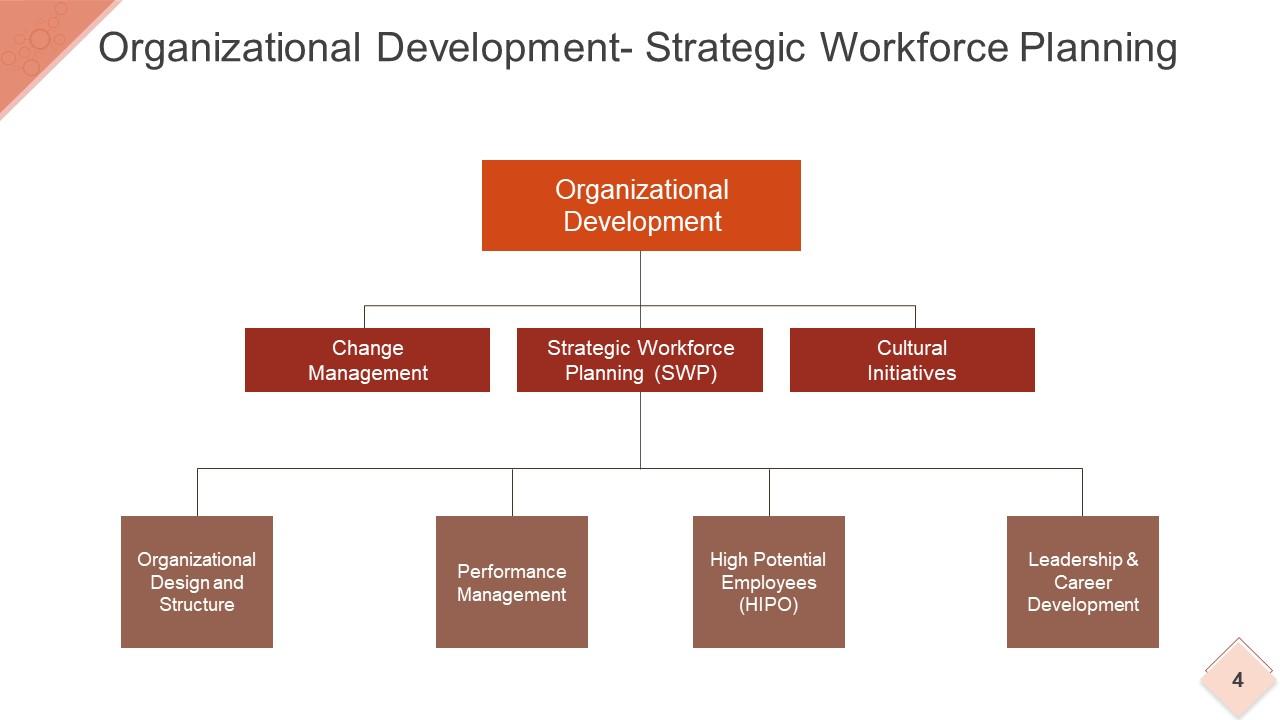
Slide 4: This slide showcases Organizational Development- Strategic Workforce Planning in a hierarchy chart form.
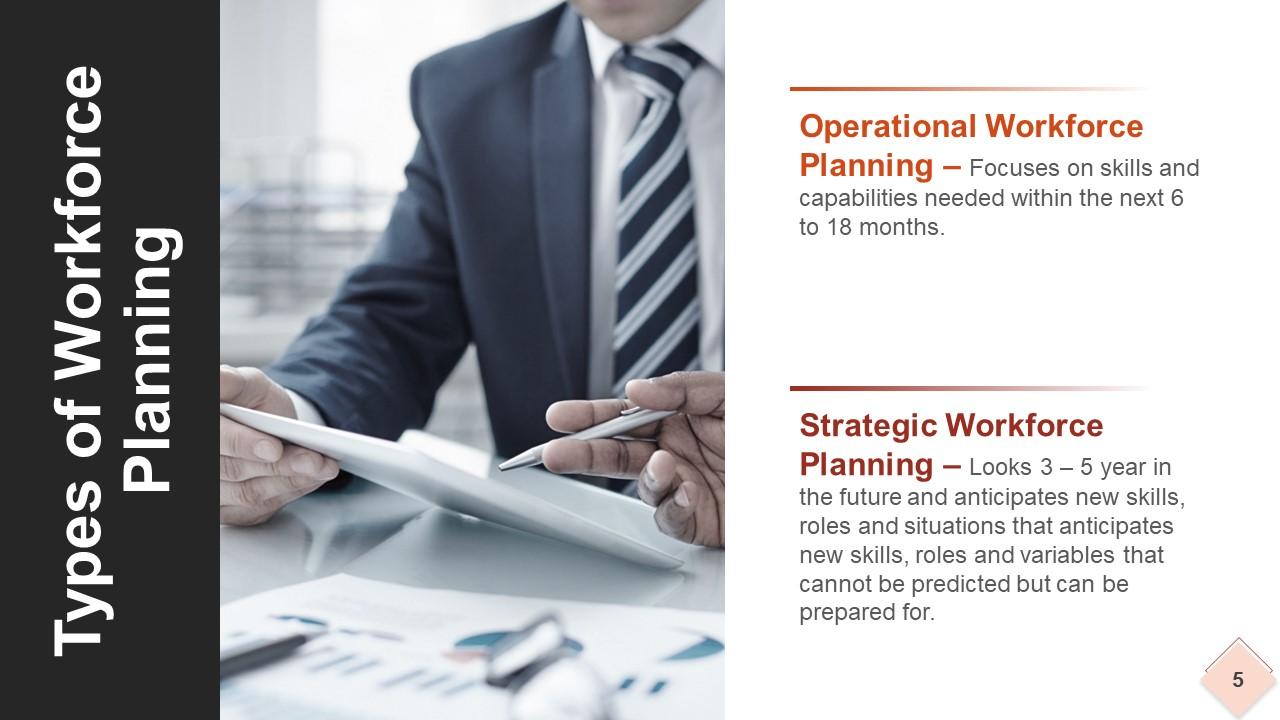
Slide 5: This slide states the Types of Workforce Planning. These are- Operational Workforce Planning – Focuses on skills and capabilities needed within the next 6 to 18 months, Strategic Workforce Planning – Looks 3 – 5 year in the future and anticipates new skills, roles and situations that anticipates new skills, roles and variables that cannot be predicted but can be prepared for.
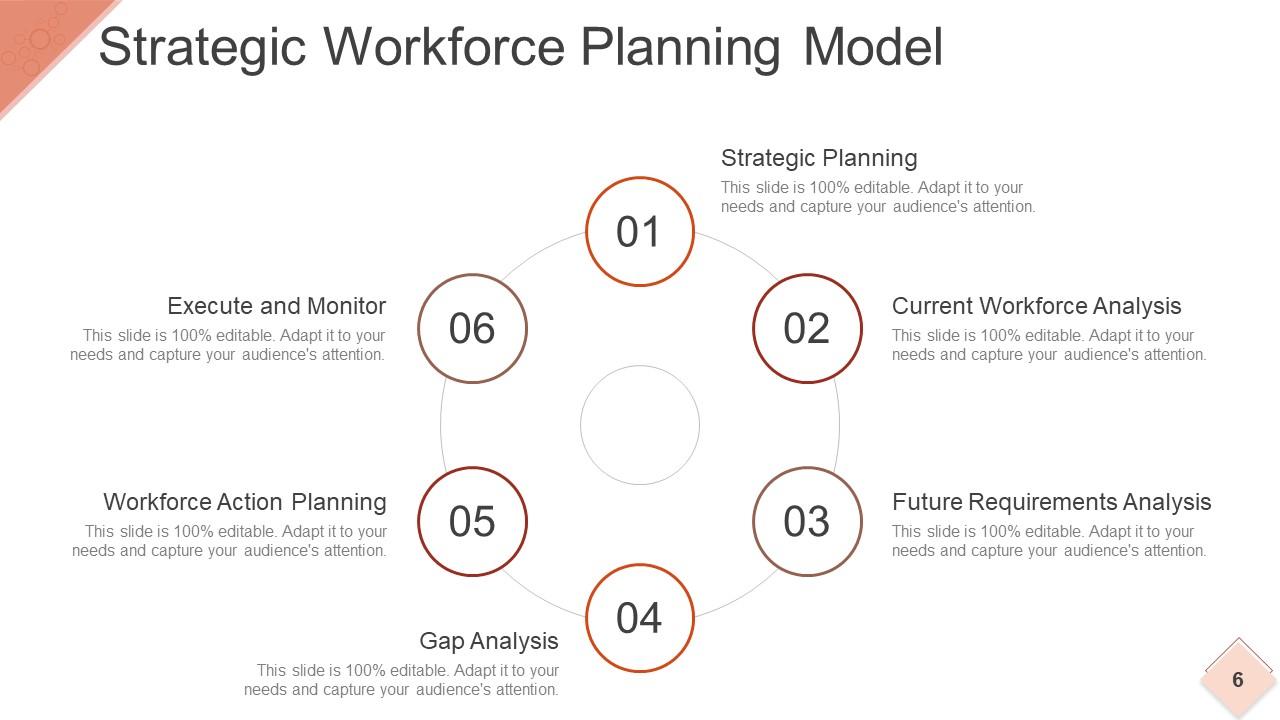
Slide 6: This slide showcases Strategic Workforce Planning Model with the following steps- Strategic Planning, Current Workforce Analysis, Future Requirements Analysis, Gap Analysis, Workforce Action Planning, Execute and Monitor.
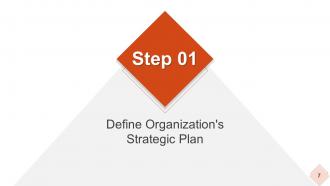
Slide 7: This slide states Step 01 Define Organization's Strategic Plan.
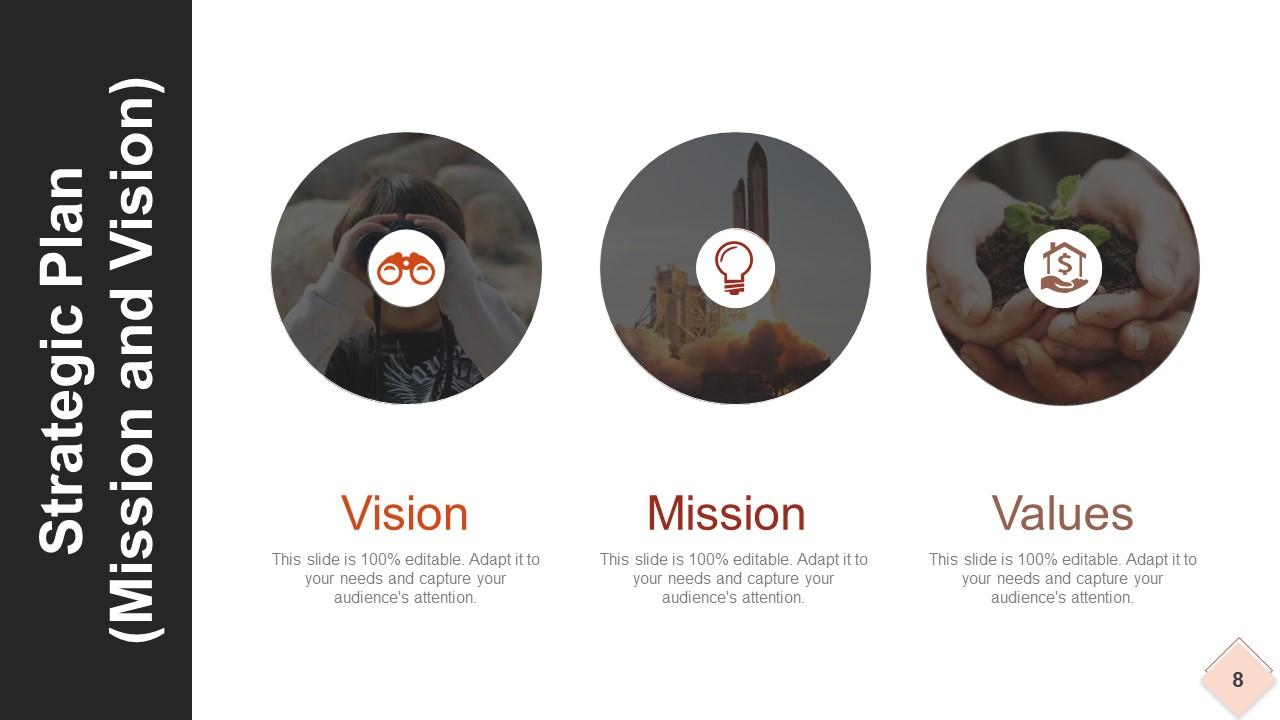
Slide 8: This is Strategic Plan (Mission and Vision) slide. State your mission, vision and values here.
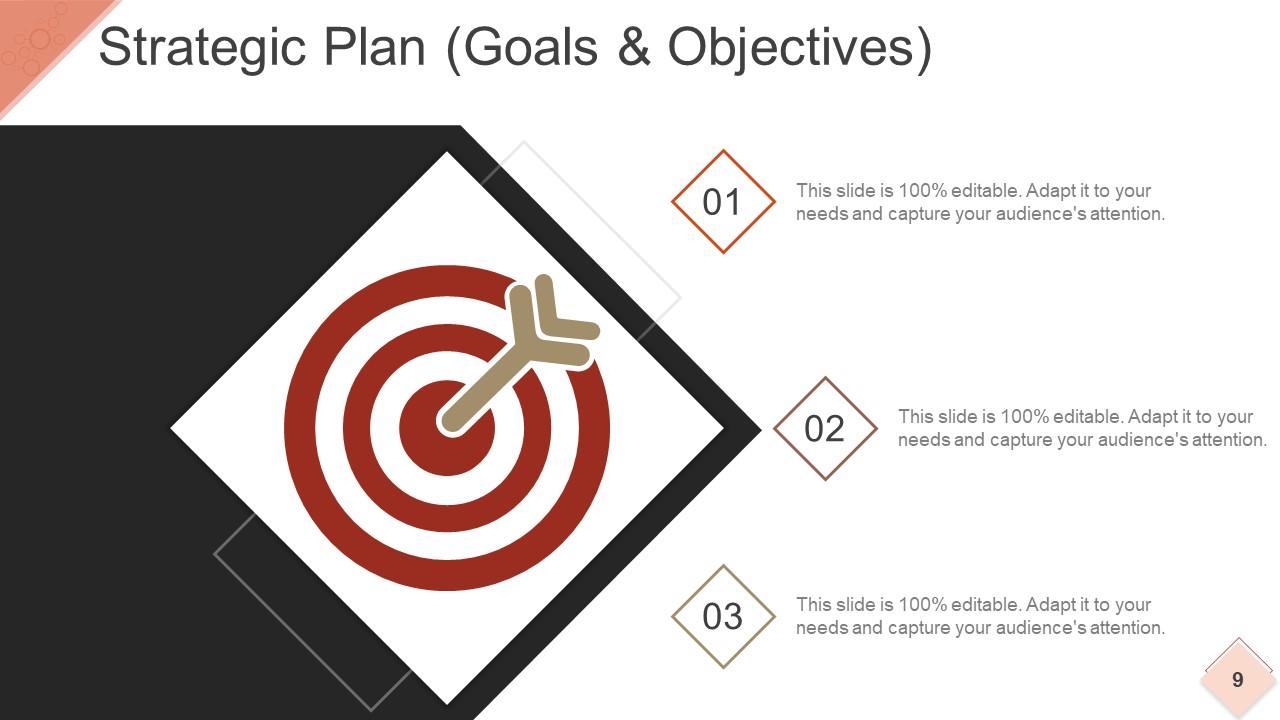
Slide 9: This slide presents Strategic Plan (Goals & Objectives) to state.
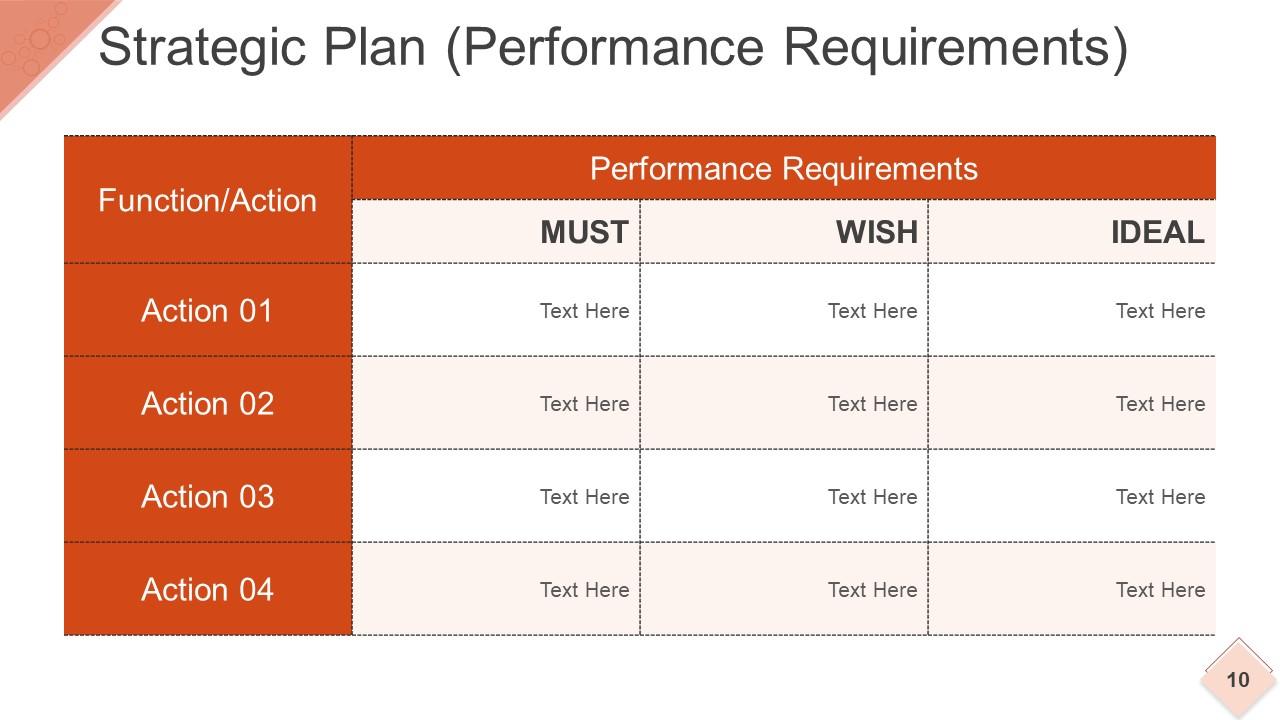
Slide 10: This is Strategic Plan (Performance Requirements) slide. State Performance Requirements in a tabular form here.
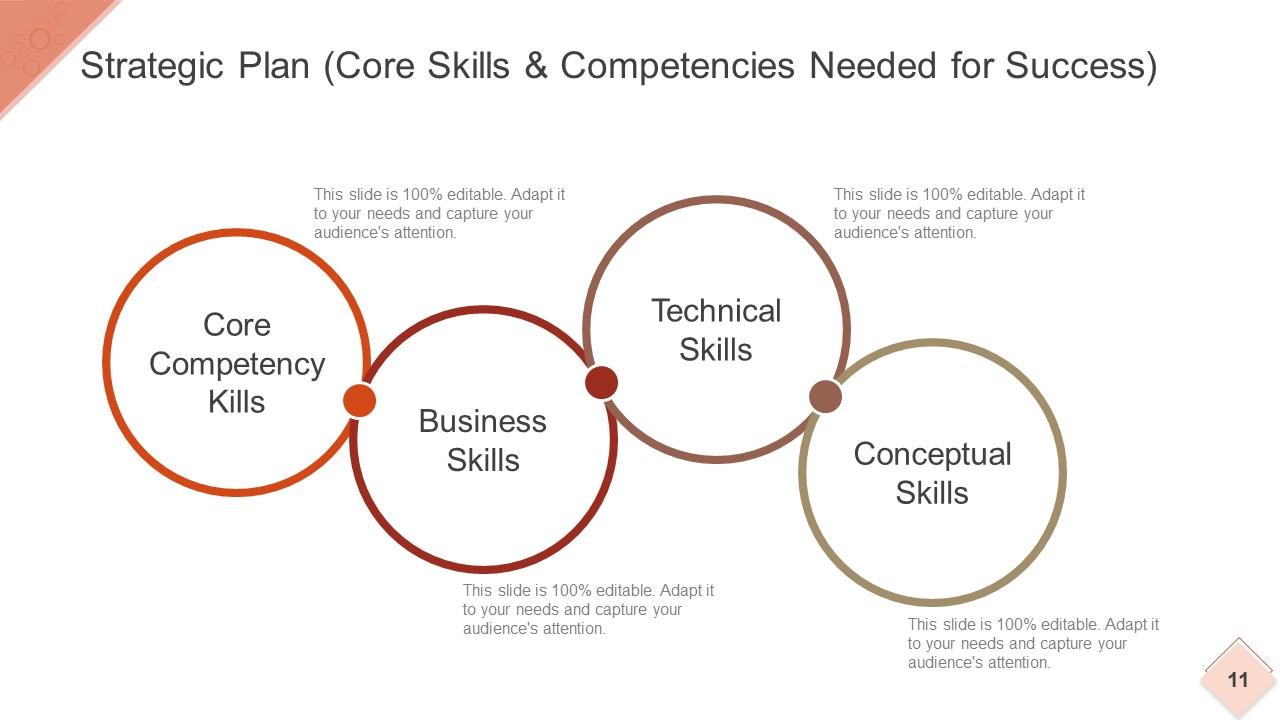
Slide 11: This slide showcases Strategic Plan (Core Skills & Competencies Needed for Success). These are- Business Skills, Technical Skills, Conceptual Skills, Core Competency Kills.
Slide 12: This is Break Time slide to halt. You can alter/ change content as per need.
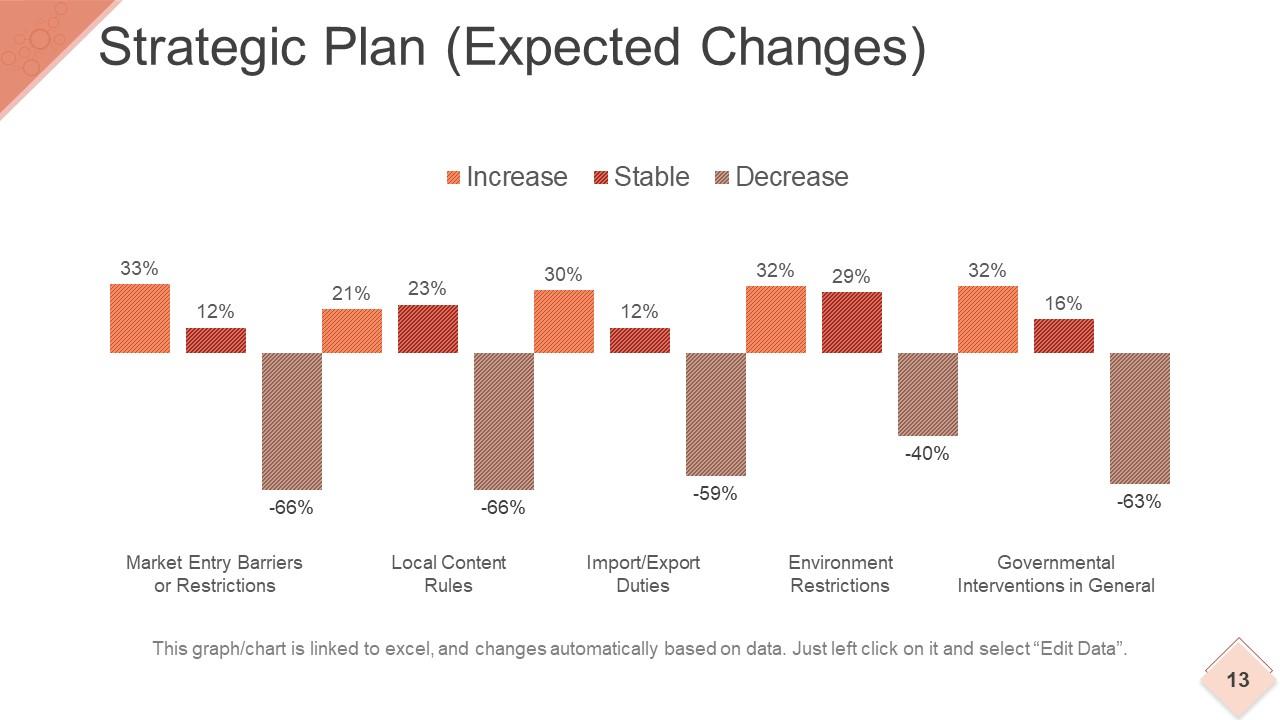
Slide 13: This slide presents Strategic Plan (Expected Changes) in a graphical form showing- Market Entry Barriers or Restrictions, Local Content Rules, Import/Export Duties, Environment Restrictions, Governmental Interventions in General.
Slide 14: This is Step 02 Scan the Internal & External Environment slide.
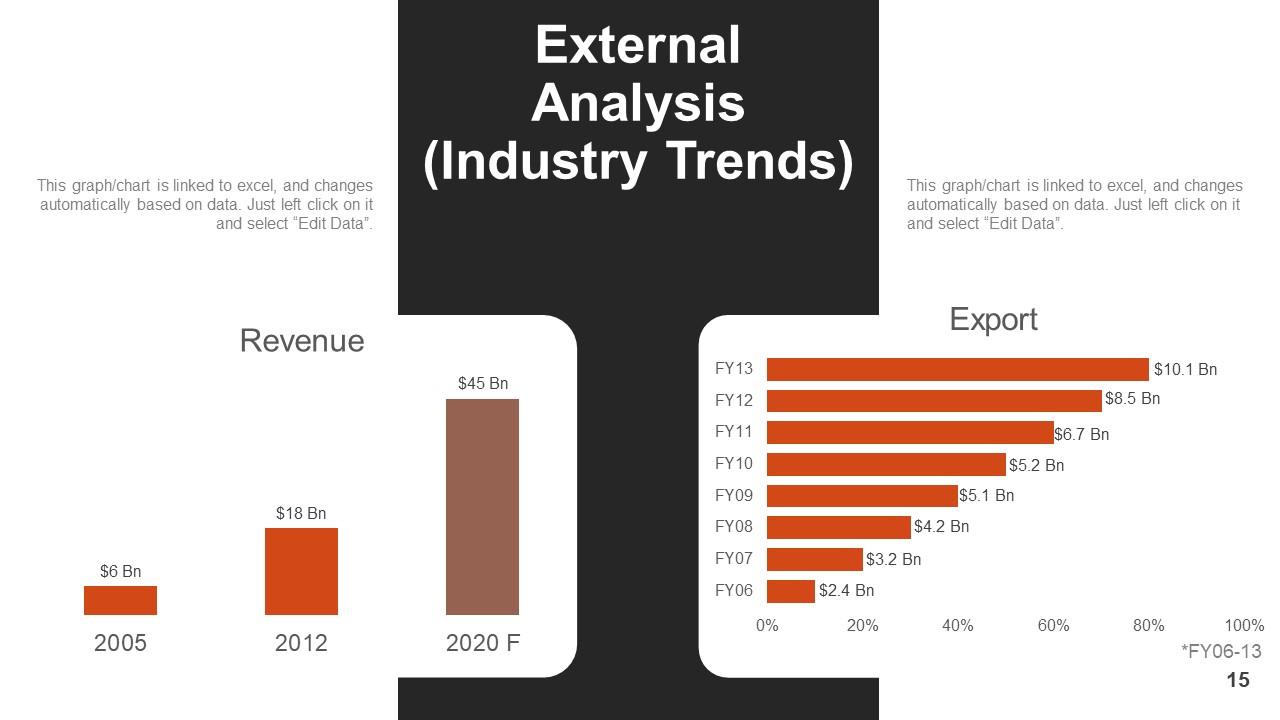
Slide 15: This slide states External Analysis (Industry Trends) in a bar graph/ chart form. Use it to show Revenue and Export.
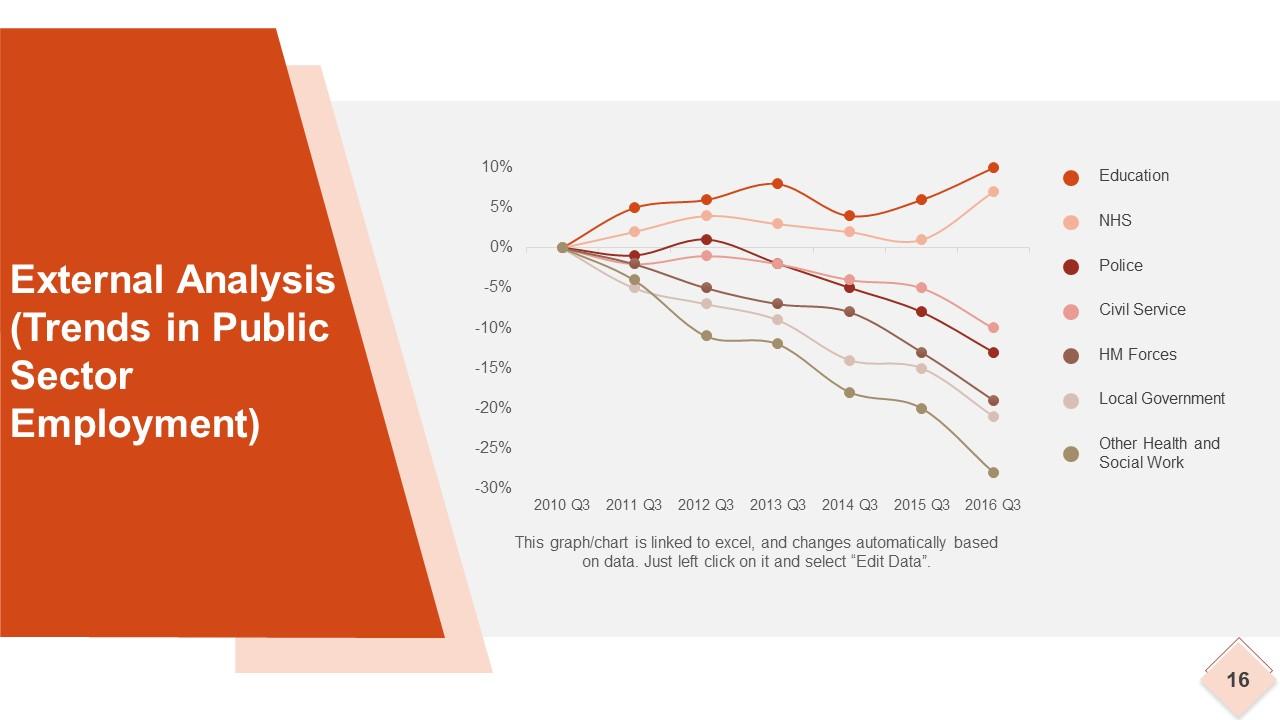
Slide 16: This slide presents External Analysis (Trends in Public Sector Employment) in a graphical form.
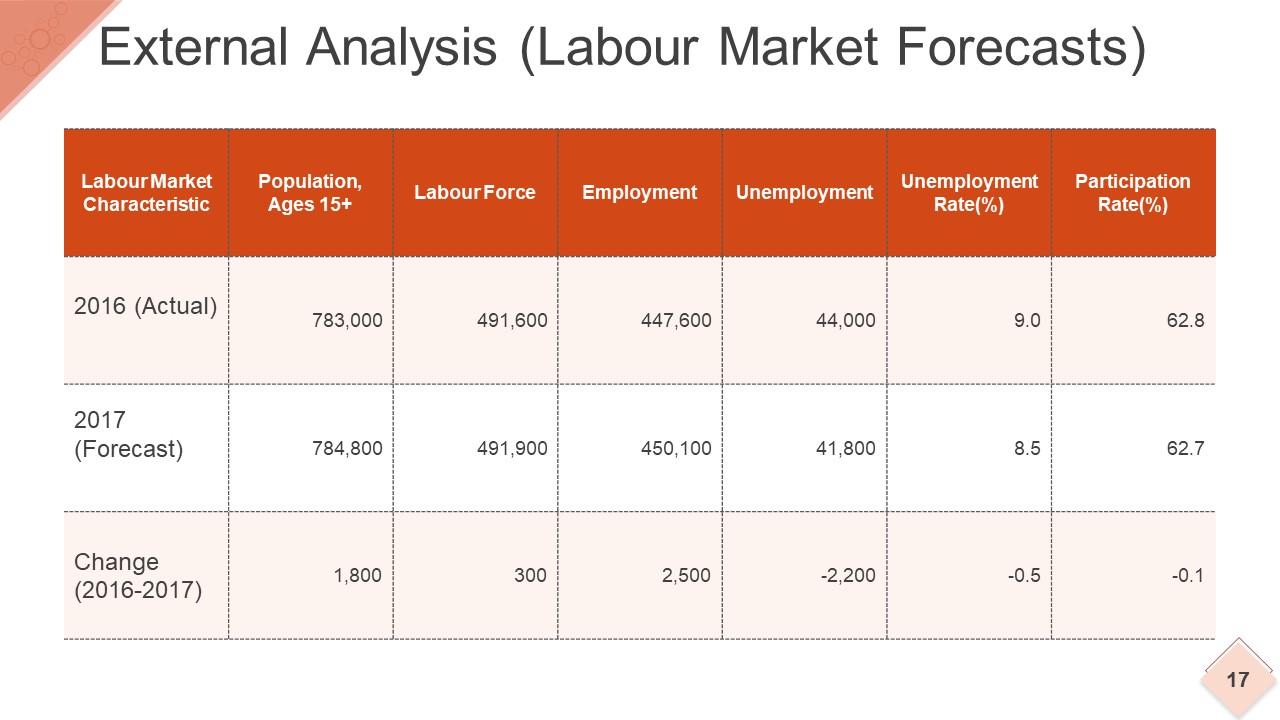
Slide 17: This is External Analysis (Labour Market Forecasts) slide in a tabular form. Use it to showcase Labour Market Forecasts.
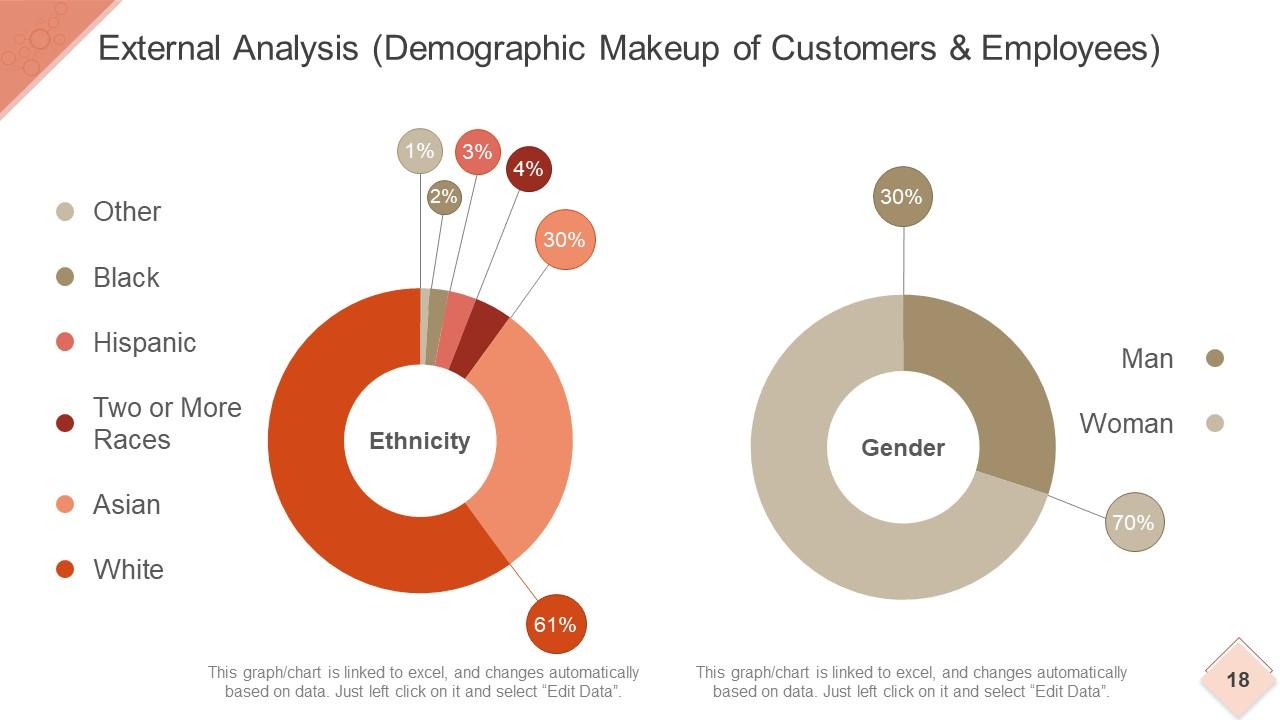
Slide 18: This is External Analysis (Demographic Makeup of Customers & Employees) slide showing- Gender, Ethnicity.
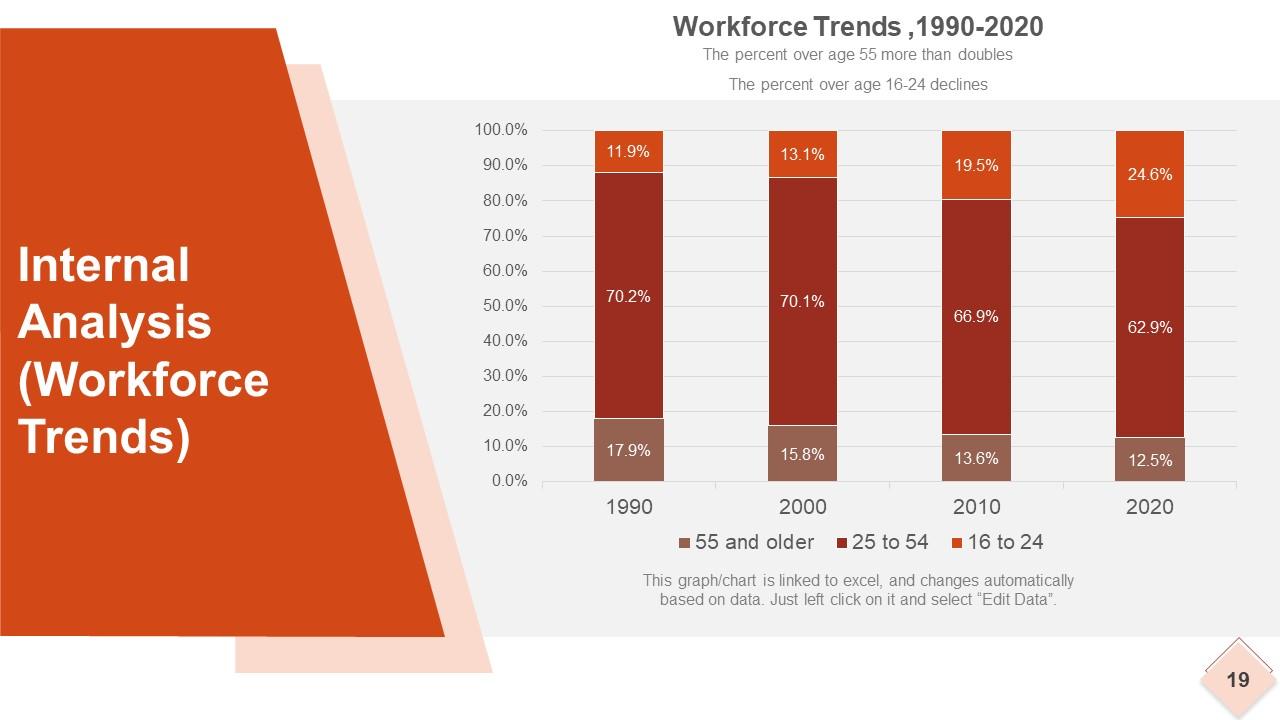
Slide 19: This slide presents Internal Analysis (Workforce Trends) in a graphical form.
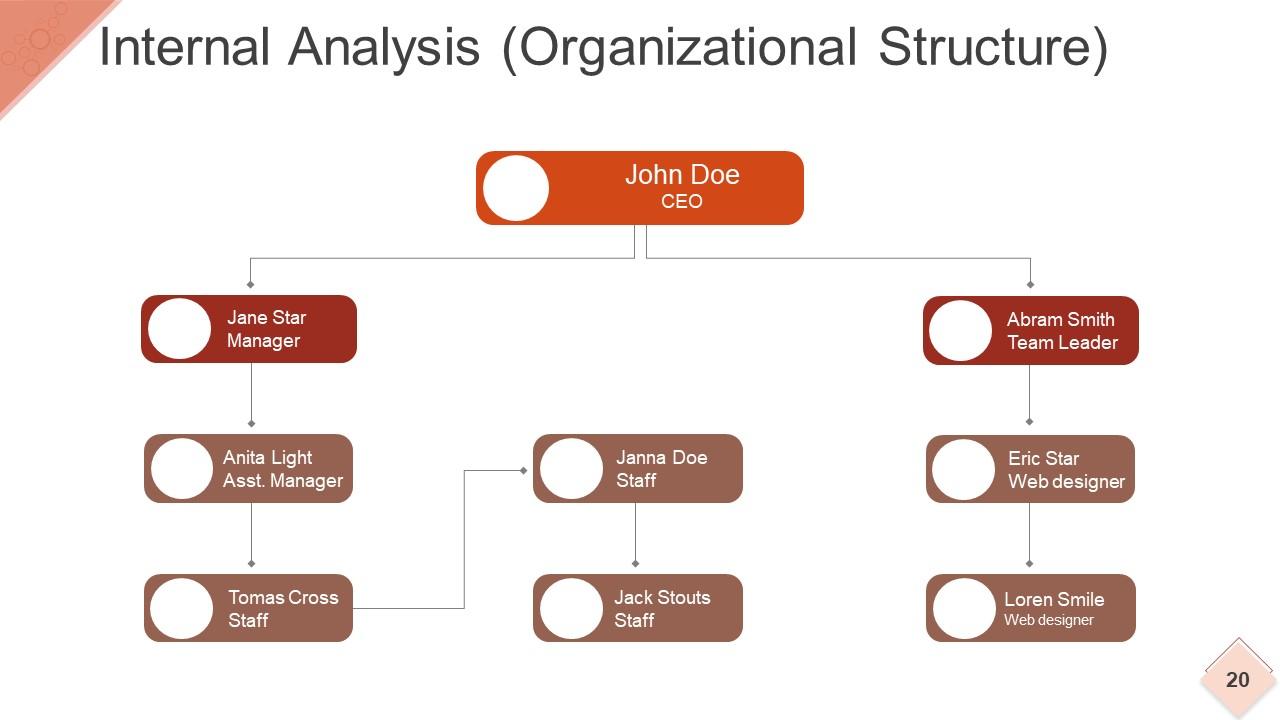
Slide 20: This slide presents Internal Analysis (Organizational Structure) with name and designation to fill.
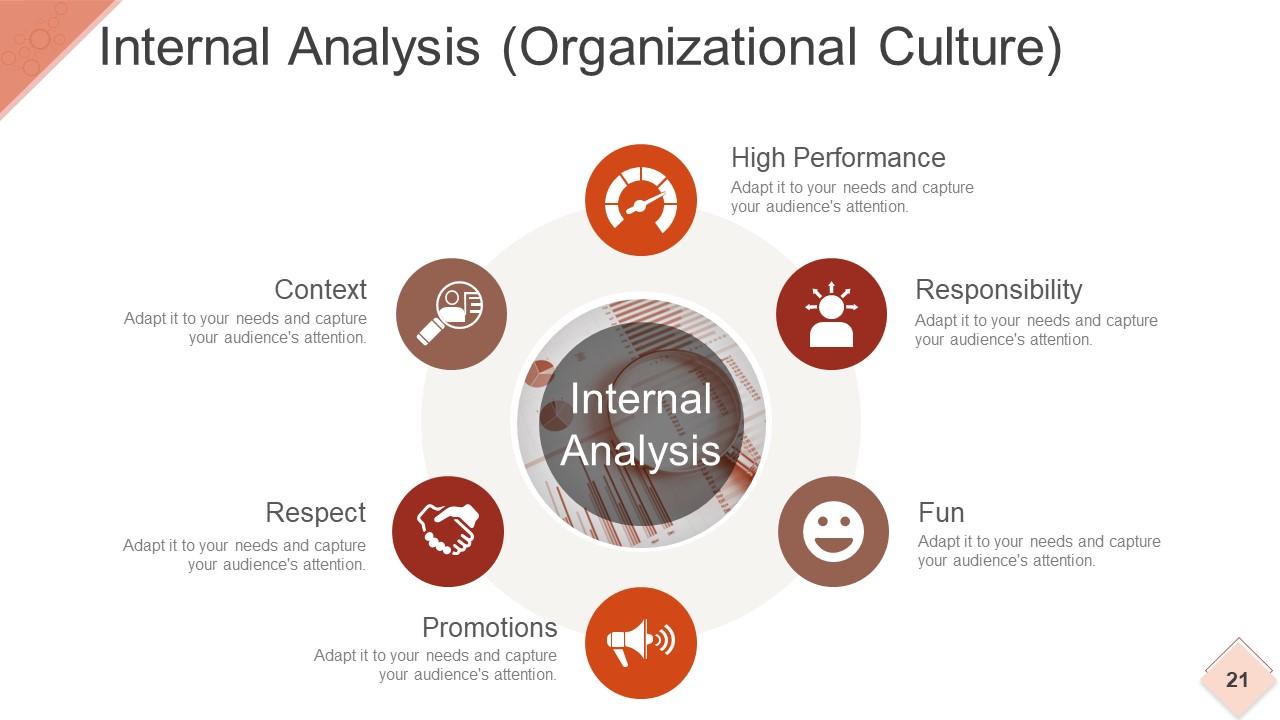
Slide 21: This is Internal Analysis (Organizational Culture) slide showing- Context, Respect, Promotions, High Performance, Responsibility, Fun.
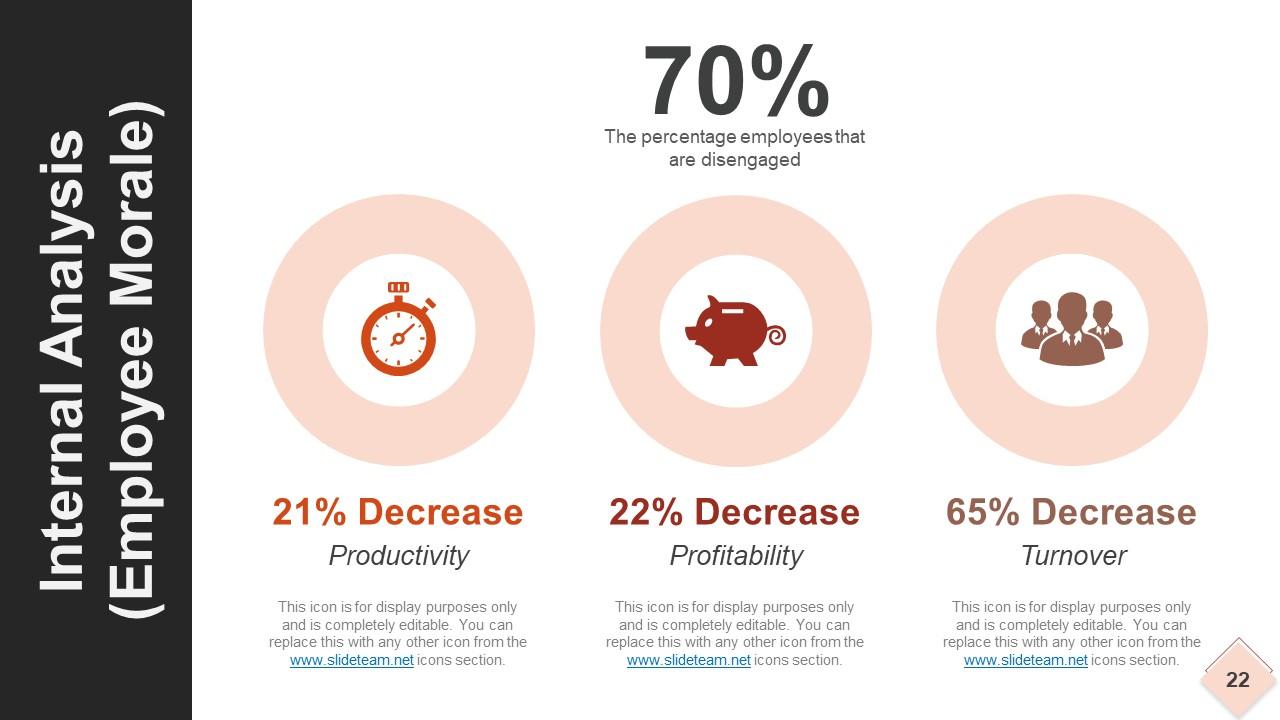
Slide 22: This slide showcases Internal Analysis (Employee Morale) with respect to the following 3 factors- Productivity, Profitability, Turnover.
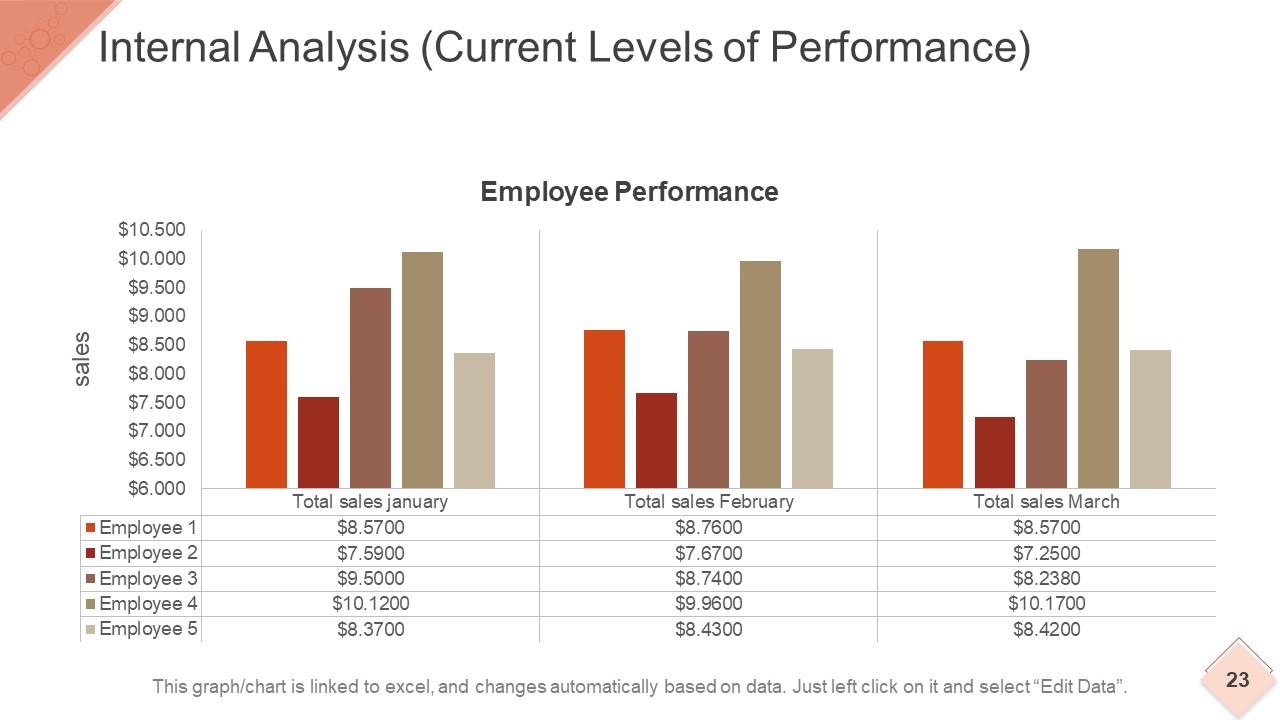
Slide 23: This slide showcases Internal Analysis (Current Levels of Performance) in a bar graph/ chart form. Use it to display Employee Performance graph.
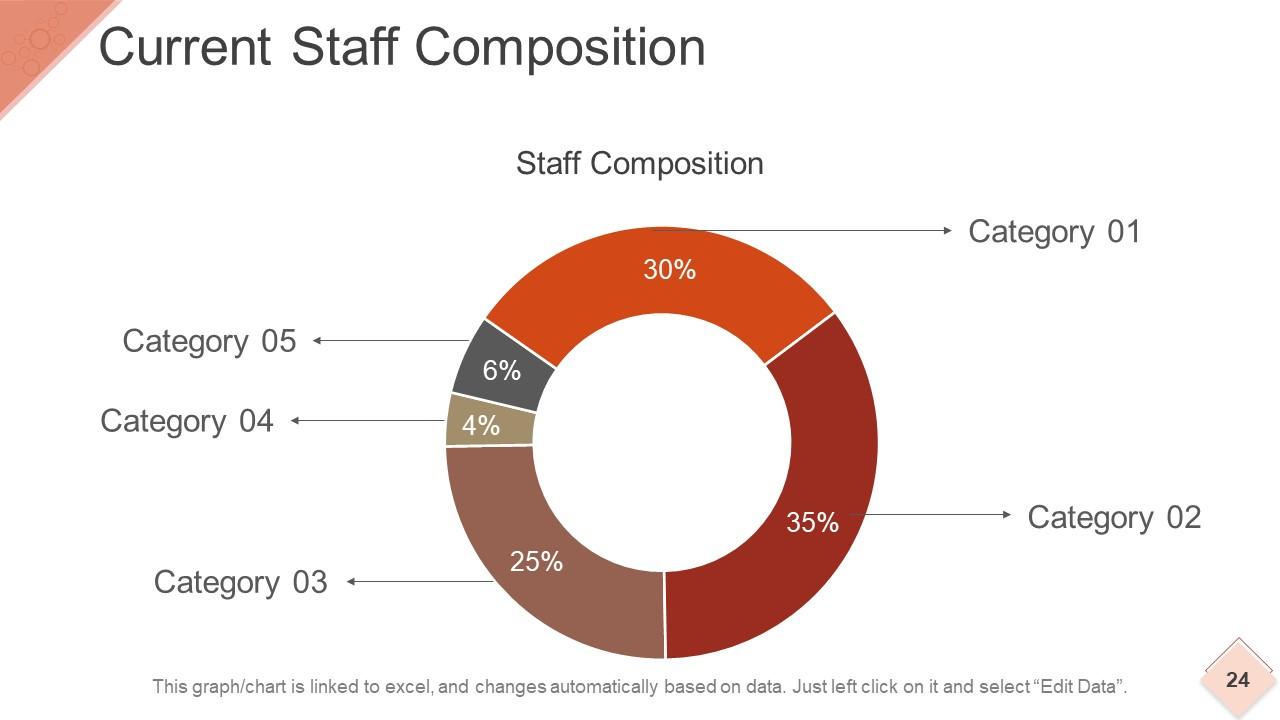
Slide 24: This is Current Staff Composition slide with categories to state.
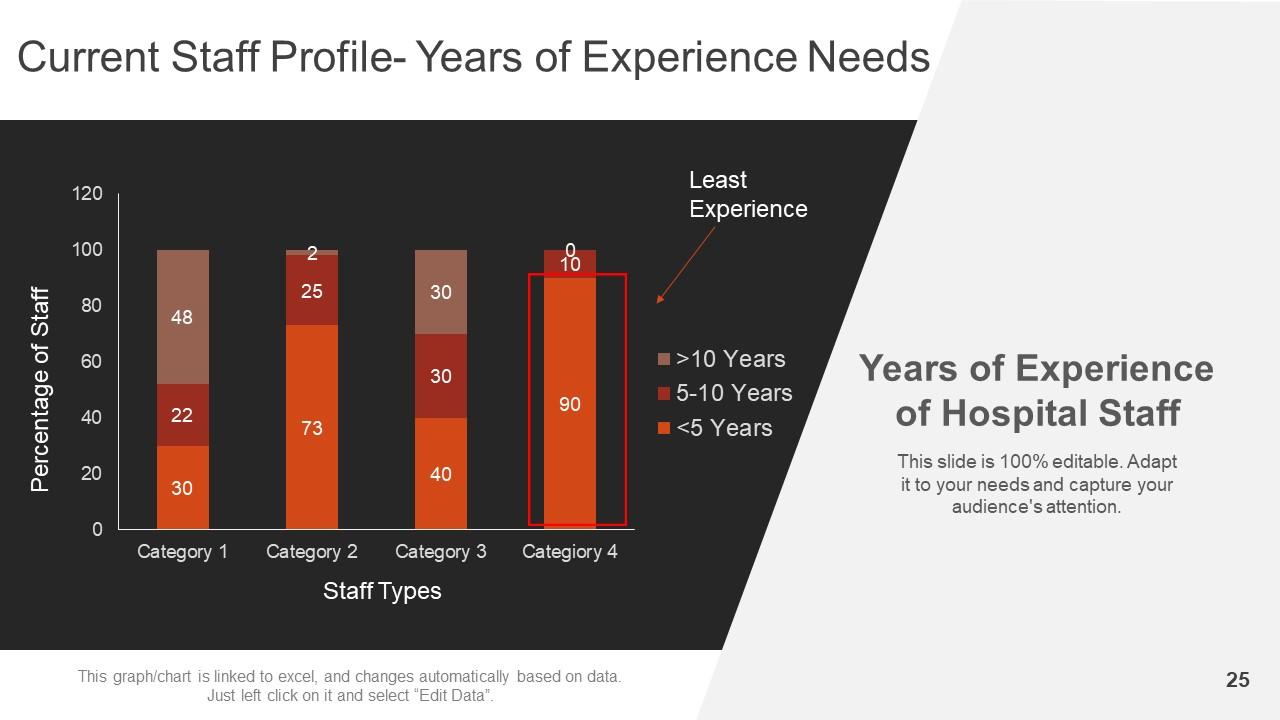
Slide 25: This slide presents Current Staff Profile- Years of Experience Needs in a graphical form.
Slide 26: This slide states Step 03 Assess Future Workforce Needs.
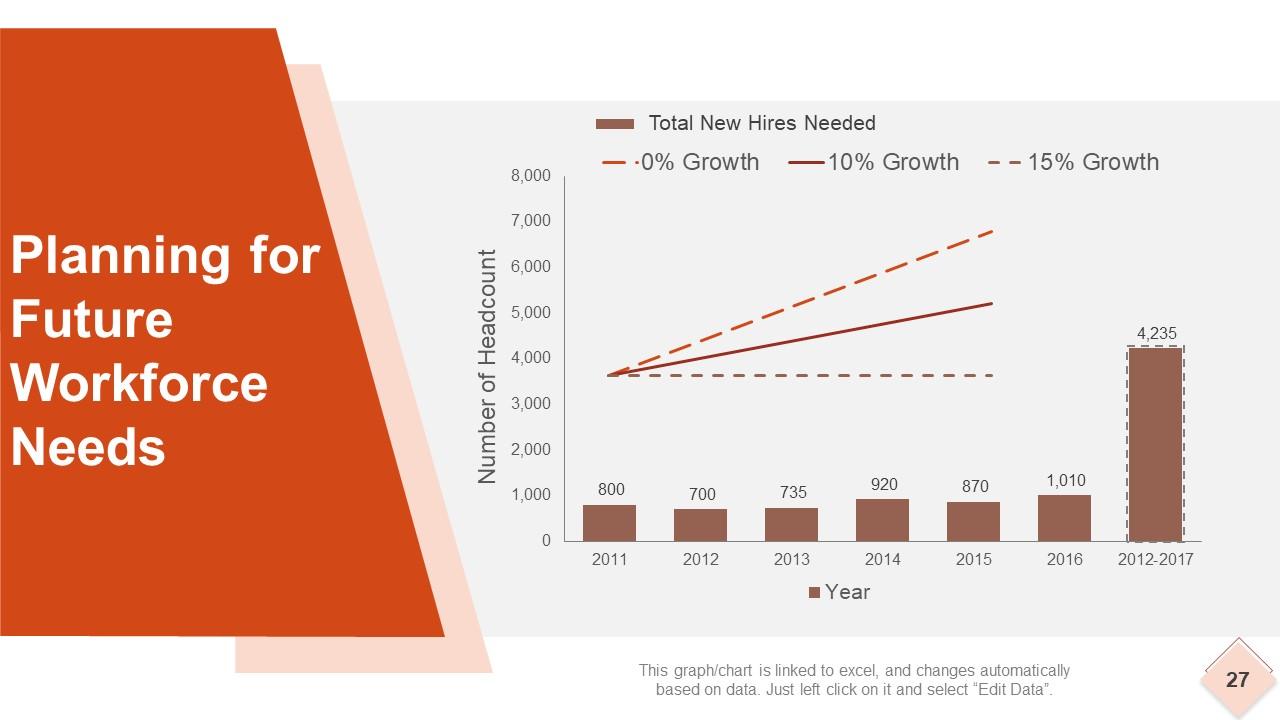
Slide 27: This slide displays Planning for Future Workforce Needs graph.
Slide 28: This is Step 04 Gap Analysis slide.
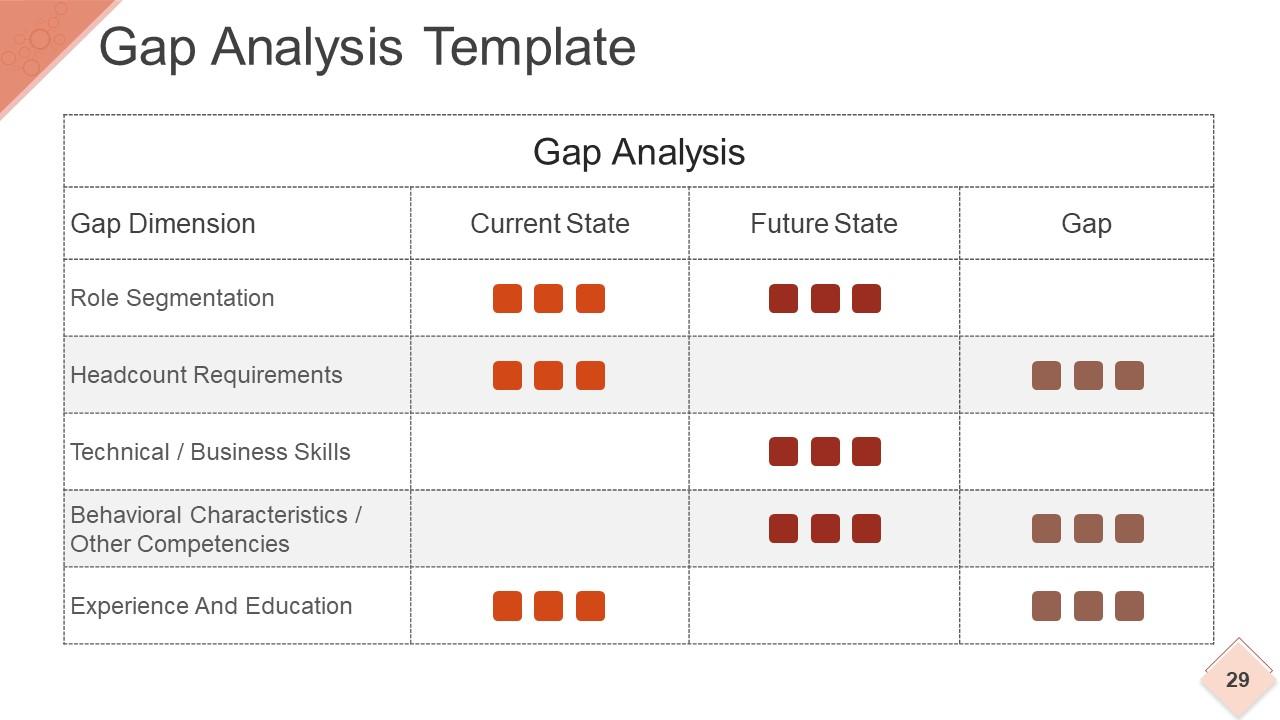
Slide 29: This slide showcases Gap Analysis Template in a tabular form.
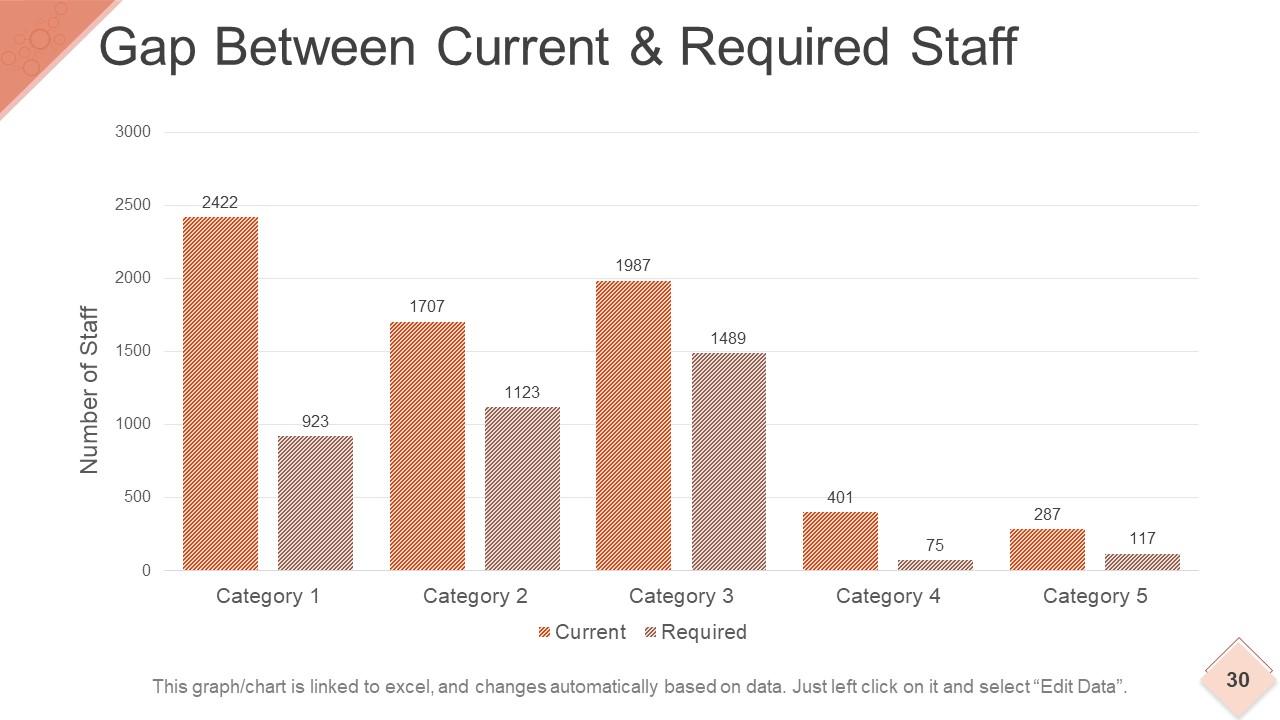
Slide 30: This slide showcases Gap Between Current & Required Staff in a bar graph/ chart form.
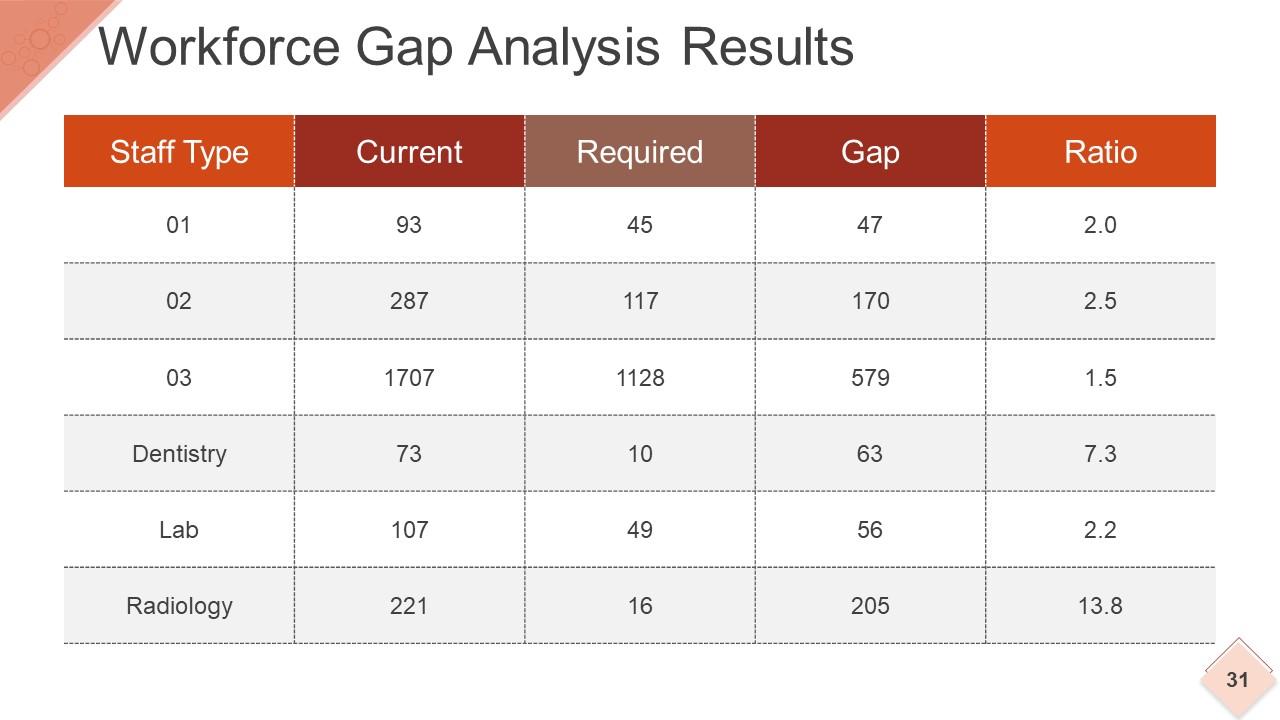
Slide 31: This slide showcases Workforce Gap Analysis Results table with the following sub headings- Staff Type, Current, Required, Gap, Ratio.
Slide 32: This slide states Step 05 Workforce Action Planning.
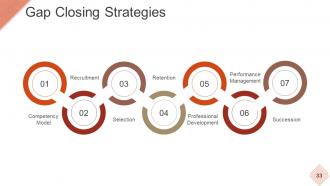
Slide 33: This slide states Gap Closing Strategies in a creative timeline form. Showcase the following- Selection, Competency Model, Professional Development, Succession, Performance Management, Retention, Recruitment.
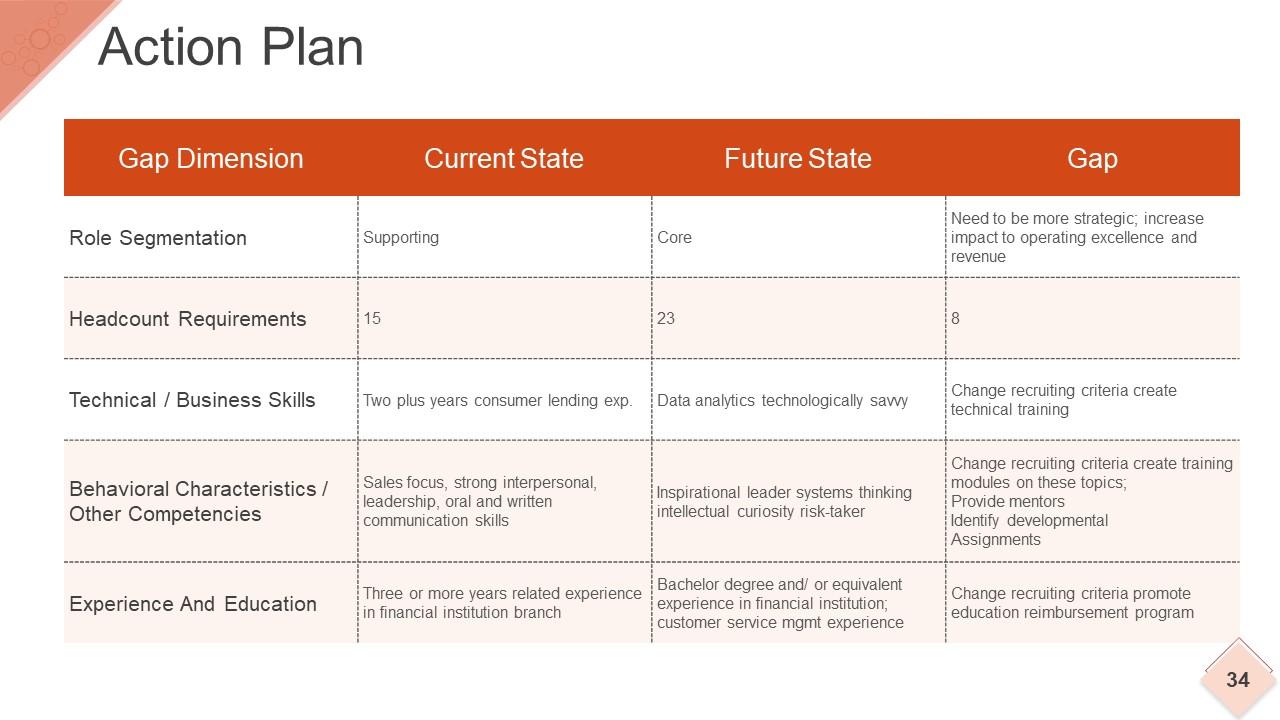
Slide 34: This slide presents Action Plan in a tabular form.
Slide 35: This is Step 06 Execute & Monitor slide.
Slide 36: This slide is titled Additional Slides to move forward. You can change the slide content as per need.
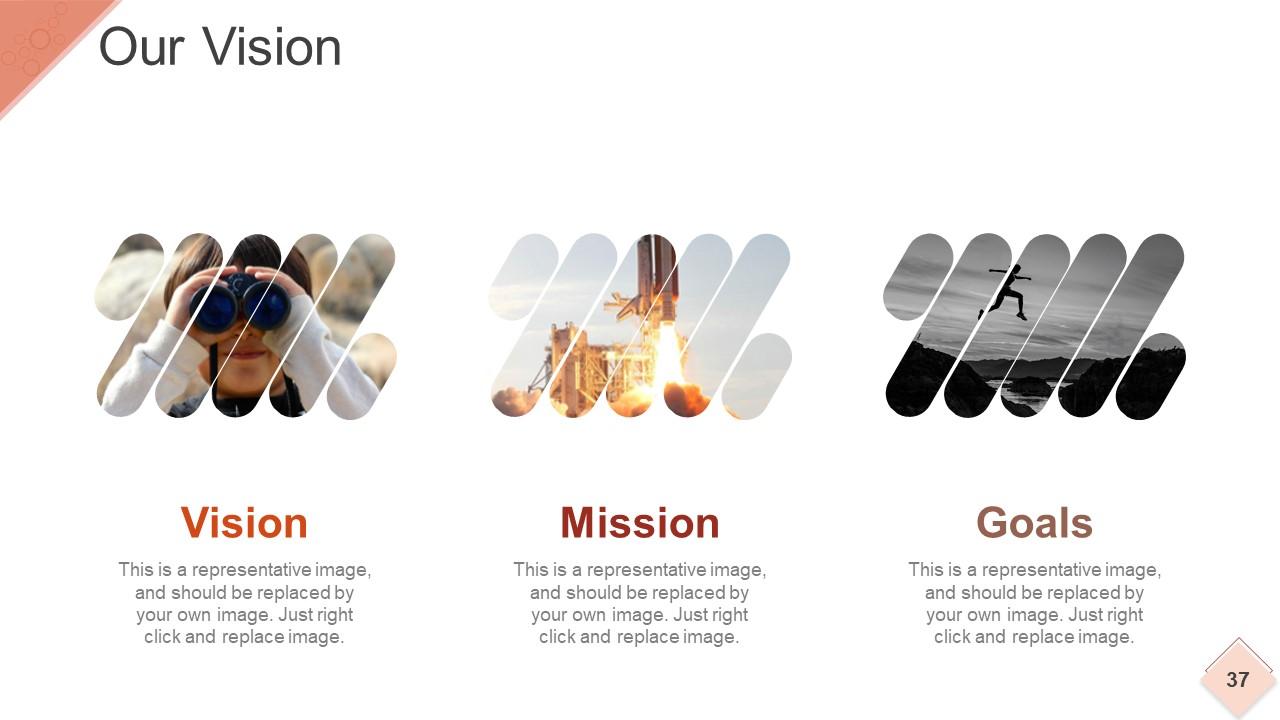
Slide 37: This is Our Vision slide with text boxes. State your vision, mission etc. here.
Slide 38: This is an Our Team slide with name and designation.
Slide 39: This is About Our Company slide to state company information, specifications etc.
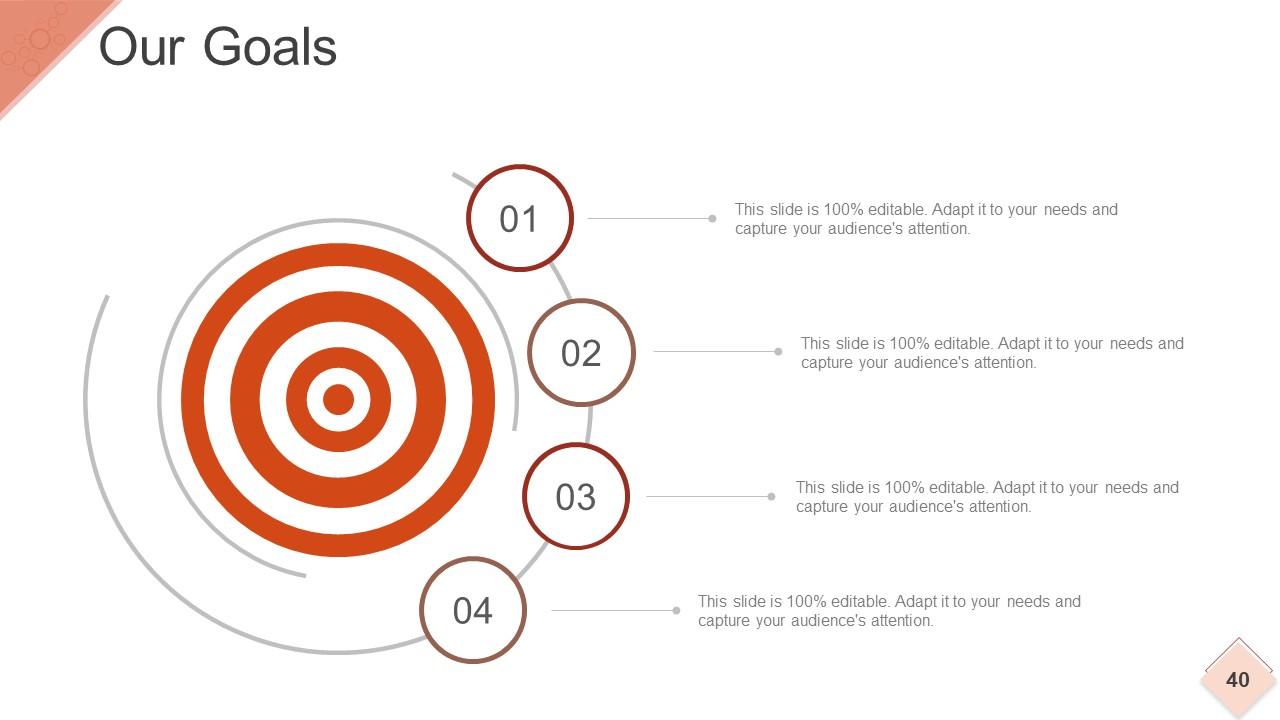
Slide 40: This is Our Goal slide. State your goals here.
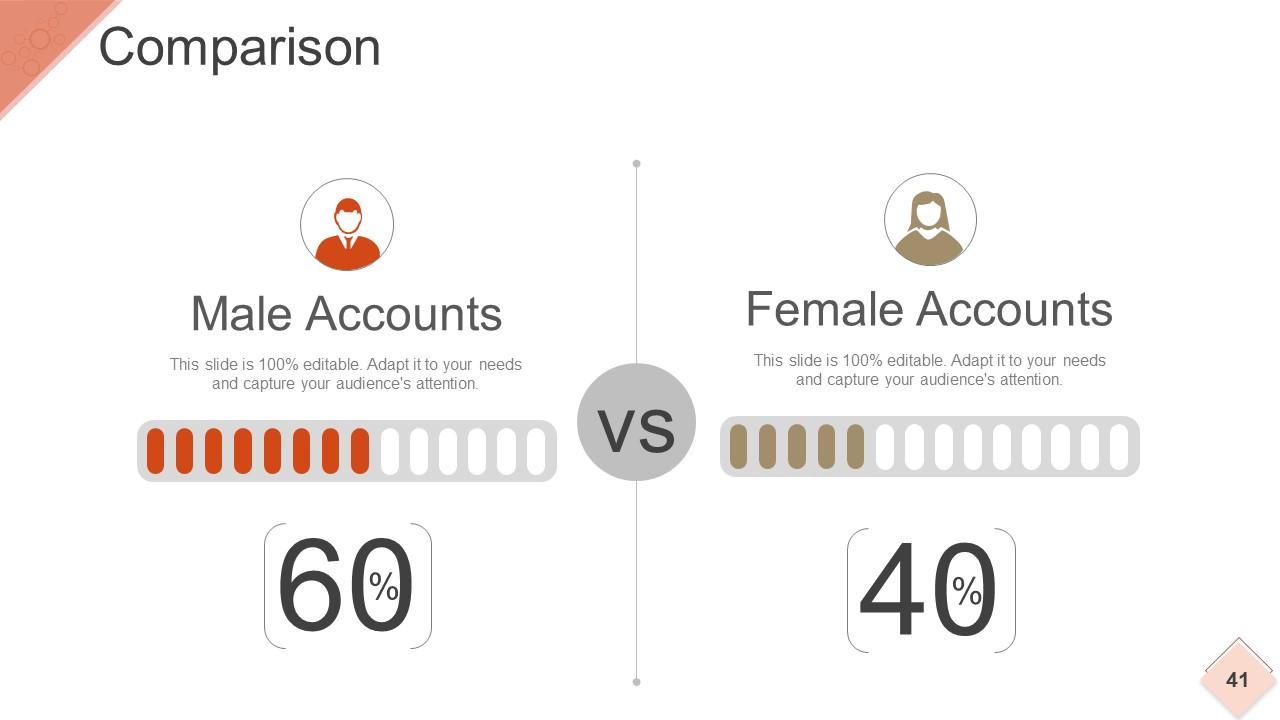
Slide 41: This slide showcases Comparison of two entities in male female chart imagery form.
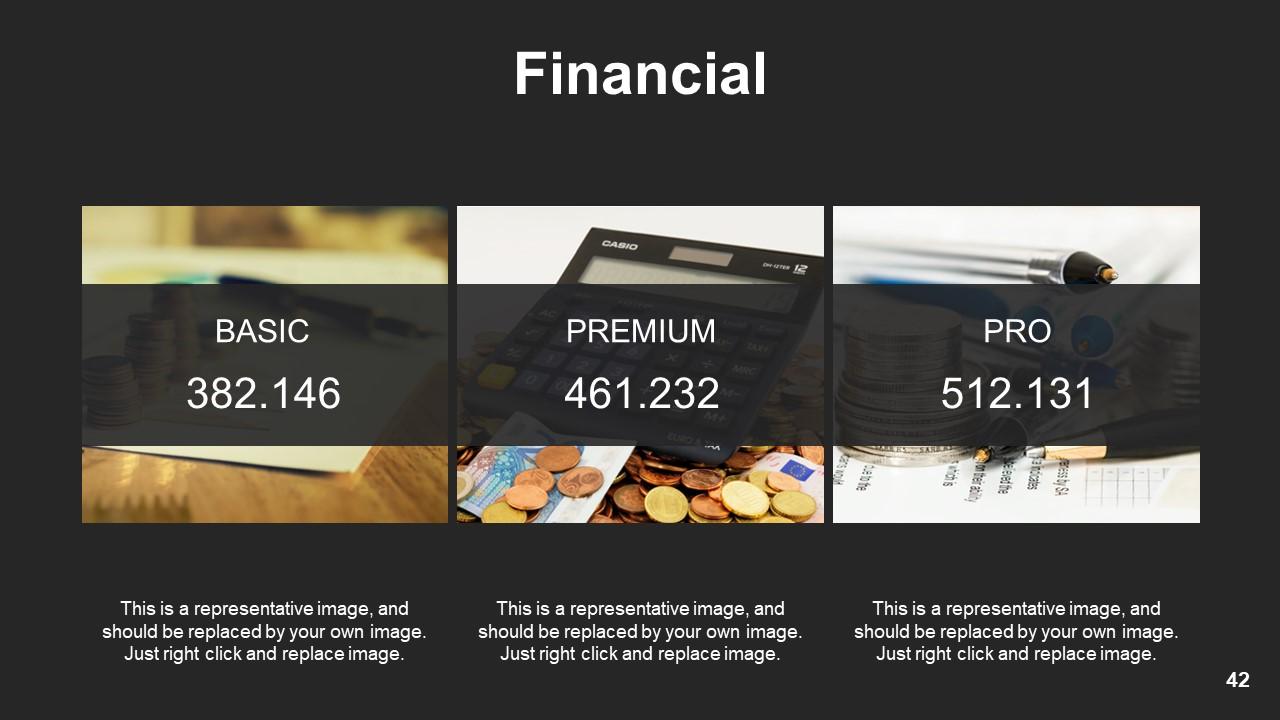
Slide 42: This is a Financial score slide. State financial aspects, information etc. here.
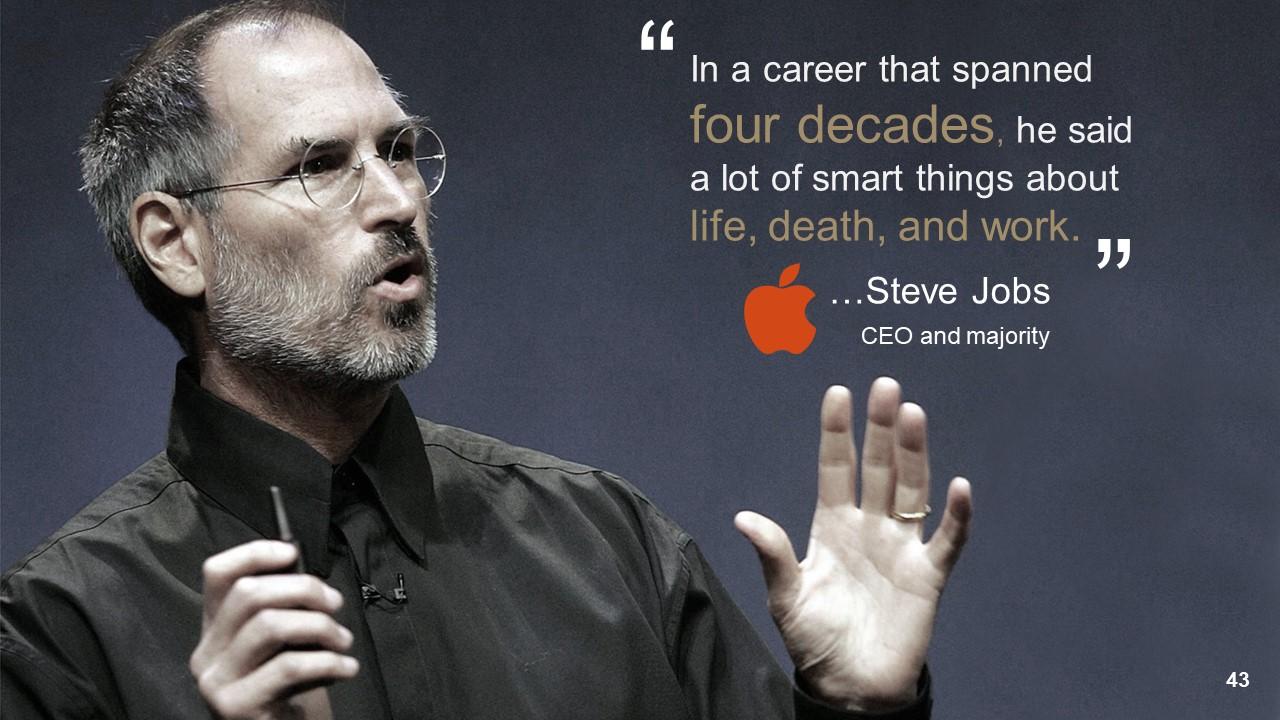
Slide 43: This is a Quotes slide to convey company/ organization message, beliefs etc. You may change the slide content as per need.
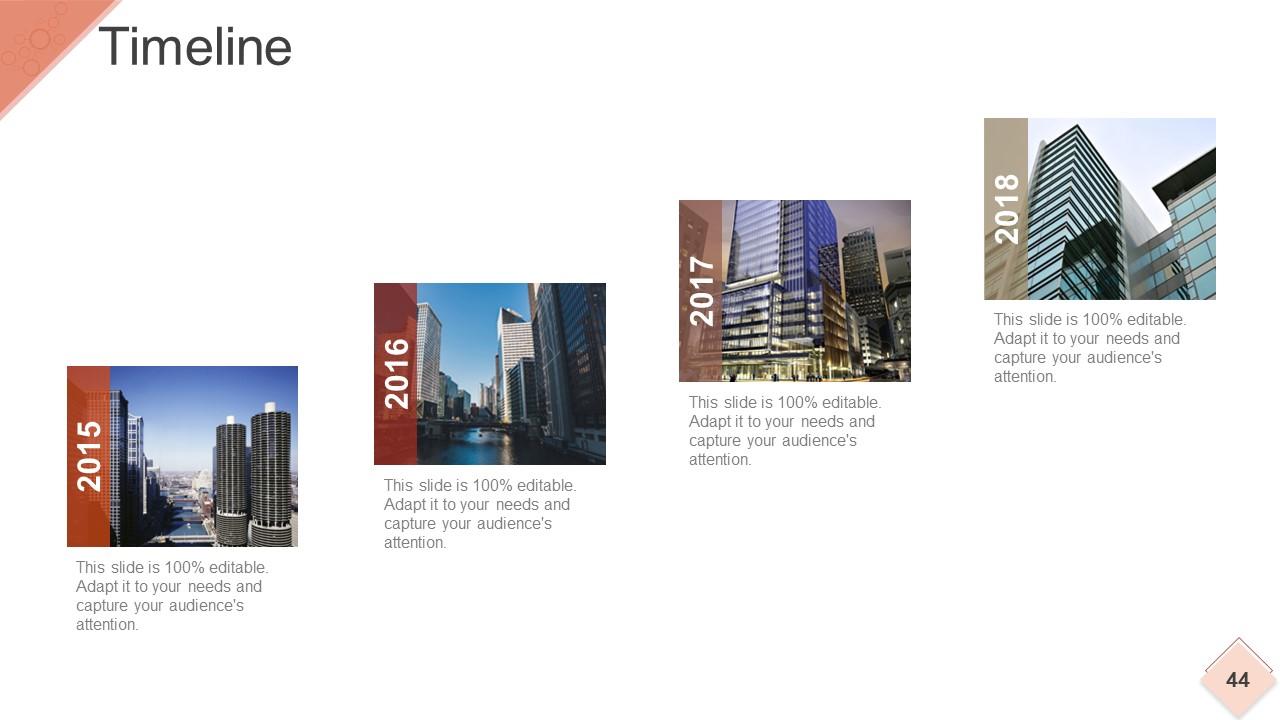
Slide 44: This slide presents a Timeline to show growth, milestones etc.
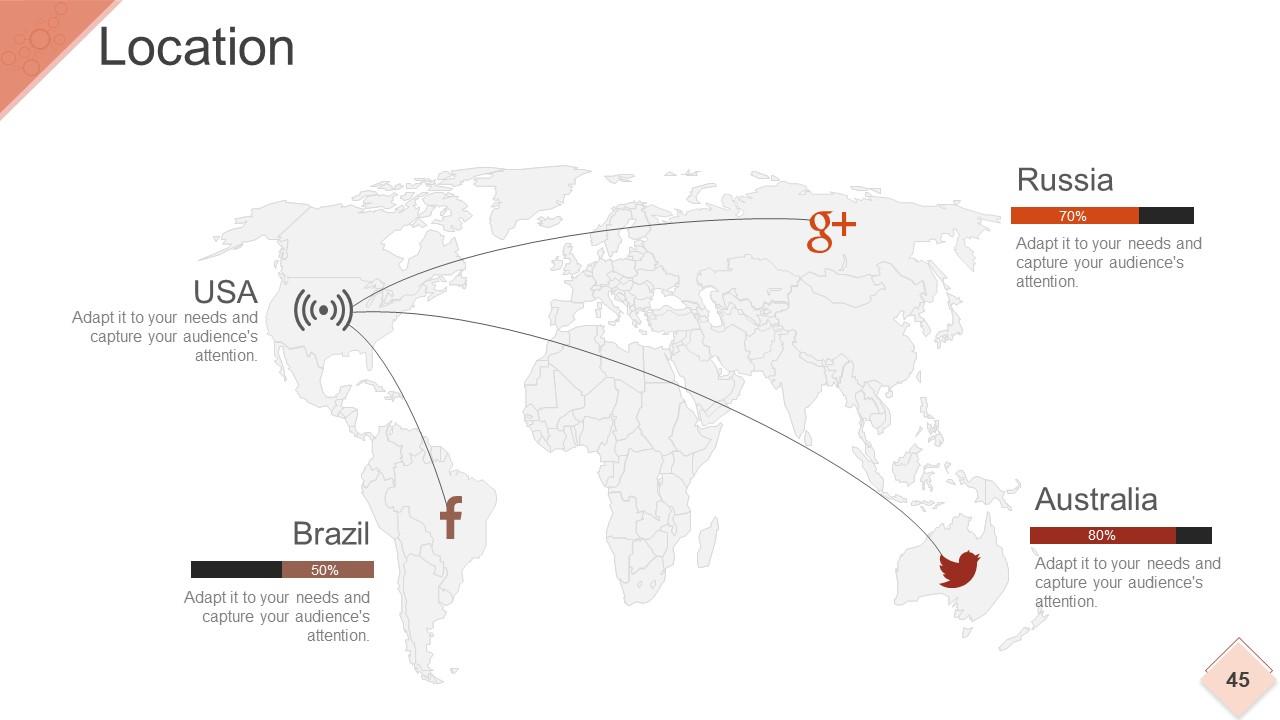
Slide 45: This is a Location slide to show global growth, presence etc. on a world map.
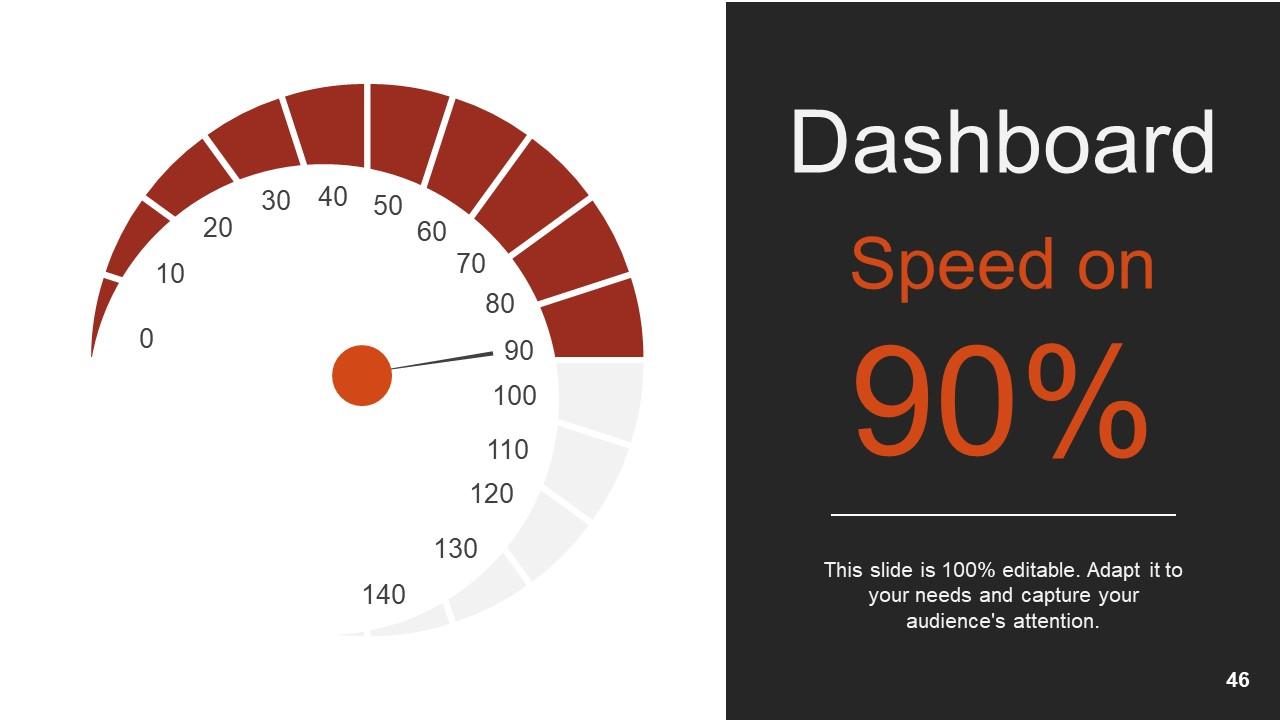
Slide 46: This is Dashboard slide to show information in percentages etc.
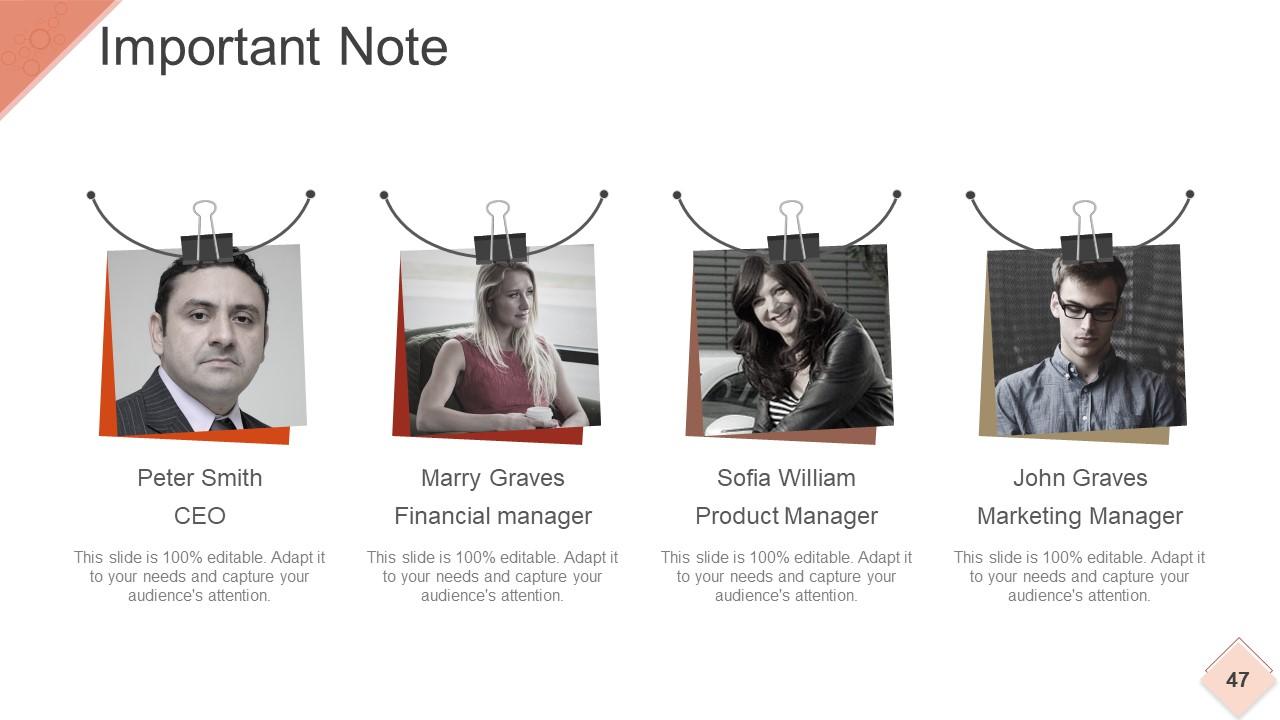
Slide 47: This is a Post It slide to mark events, important information etc.
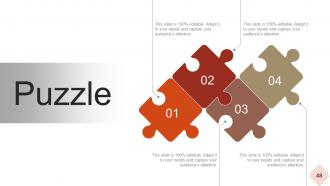
Slide 48: This is a Puzzle pieces image slide to show information, specifications etc.
Slide 49: This is a Newspaper slide to highlight something or add memorabilia.
Slide 50: This is a Target slide. State your targets here.
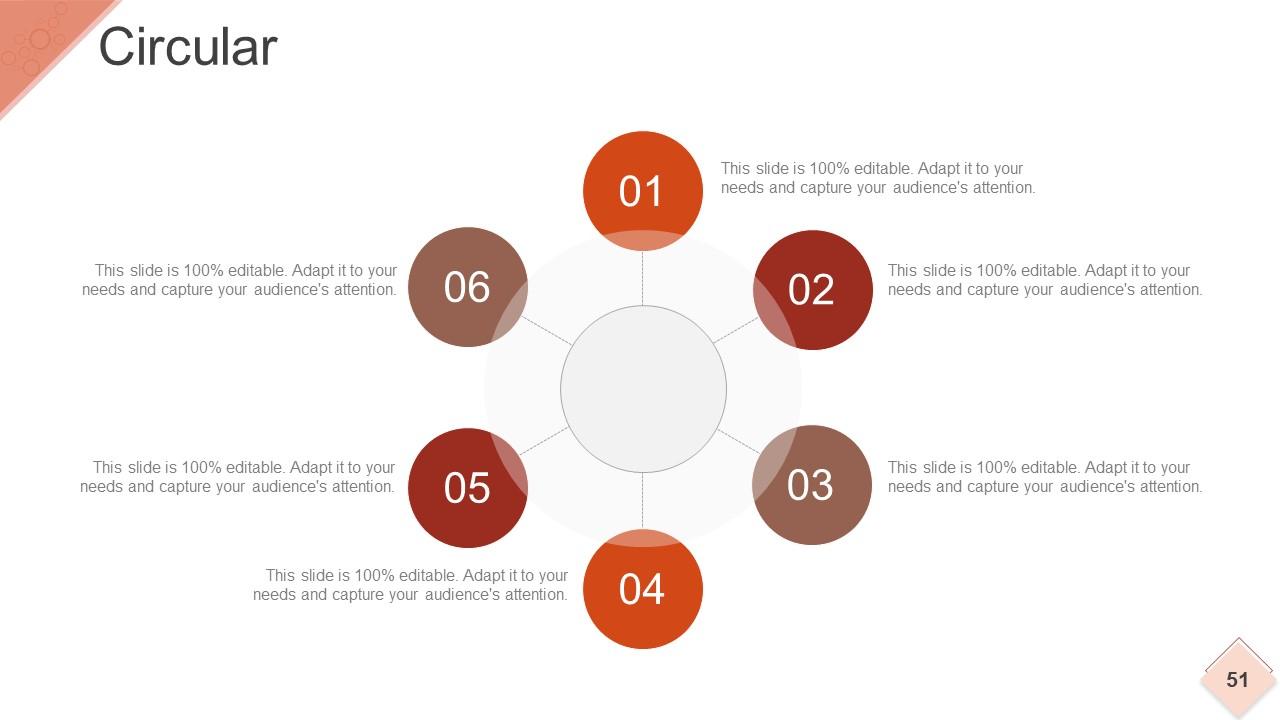
Slide 51: This is a Circular slide to show information, specification etc.
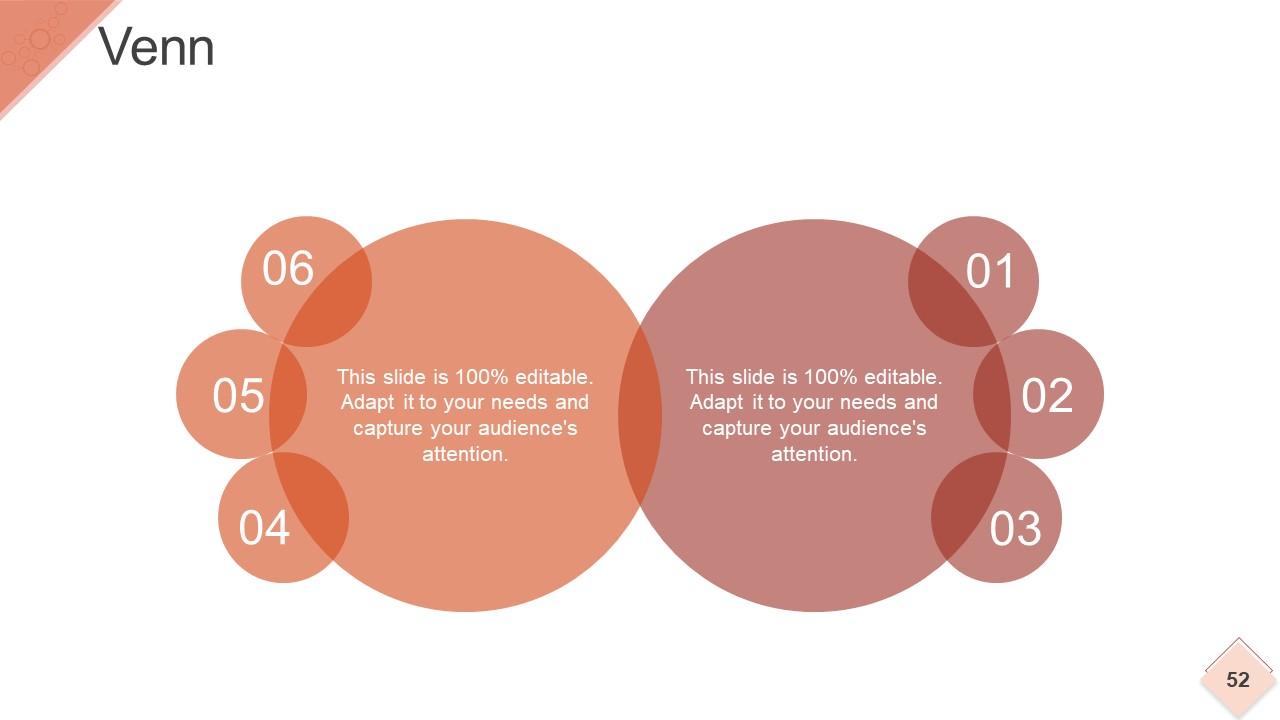
Slide 52: This is a Venn Diagram image slide to show information, specifications etc.
Slide 53: This is a Mind map image slide to show information, segregation, specifications etc.
Slide 54: This is a Lego image slide to show information, specifications etc.
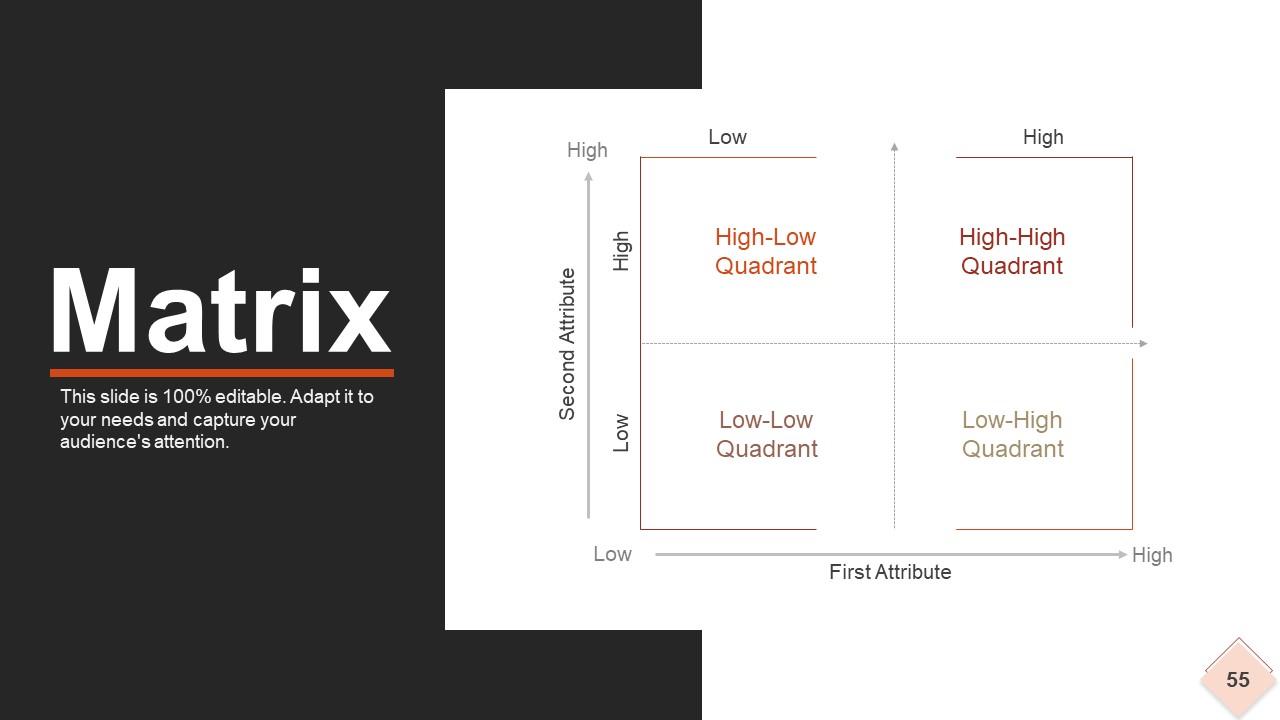
Slide 55: This is a Matrix slide to show information, specifications etc.
Slide 56: This is a Funnel image slide to show information, specifications etc.
Slide 57: This slide is titled Our Charts to move forward. Modify/ alter contents as per need.
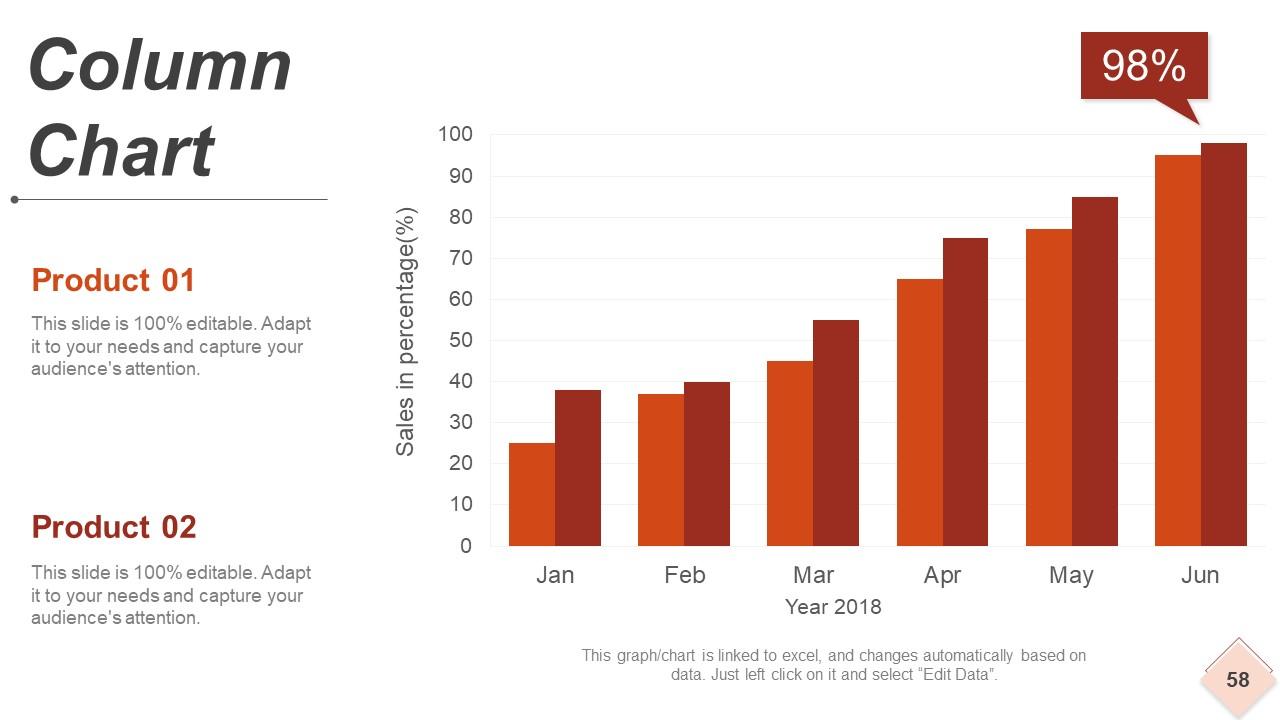
Slide 58: This is Column Chart slide to showcase comparison, information, specifications etc.
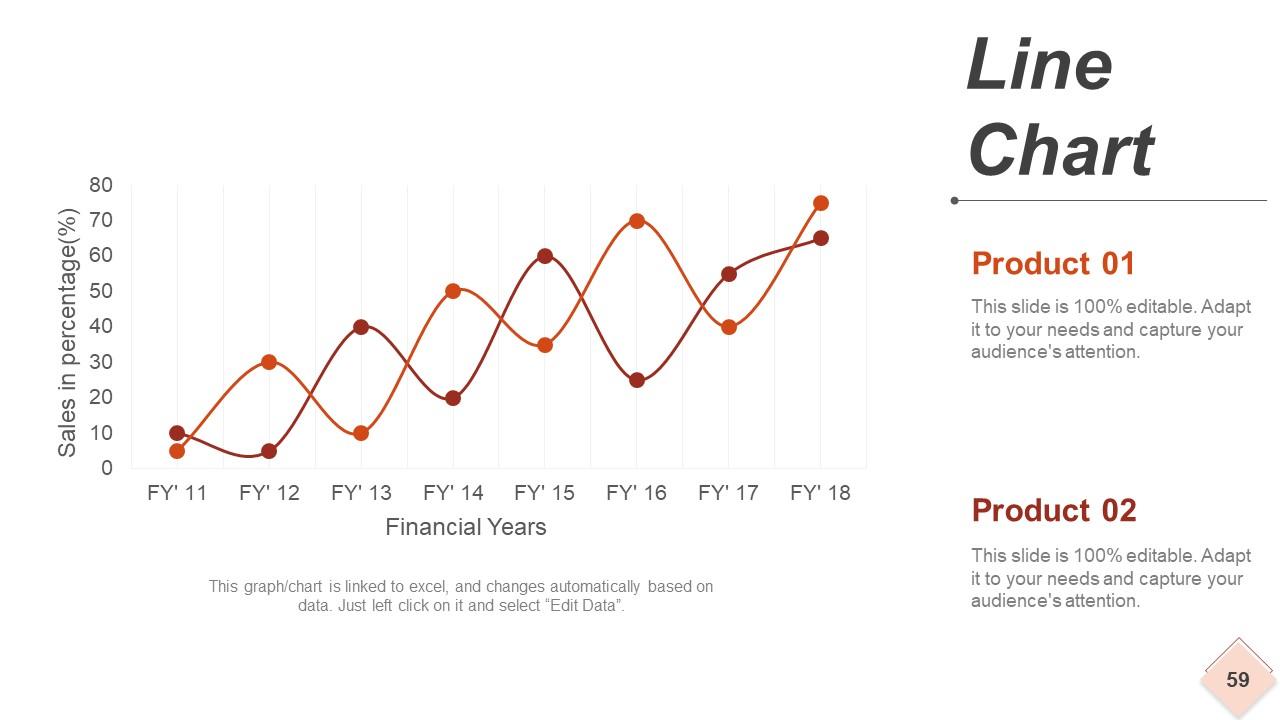
Slide 59: This slide shows a Line Chart for two product comparison.
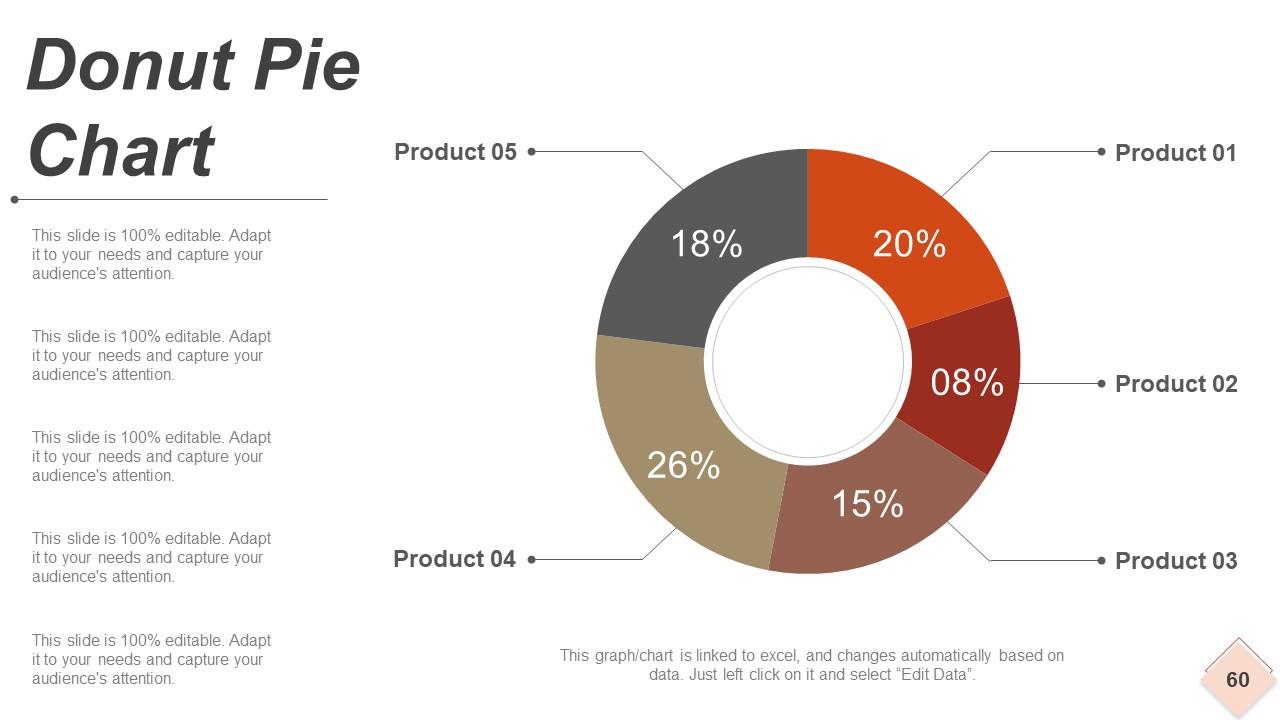
Slide 60: This is a Donut Pie Chart to present product/ entity comparison, specifications etc.
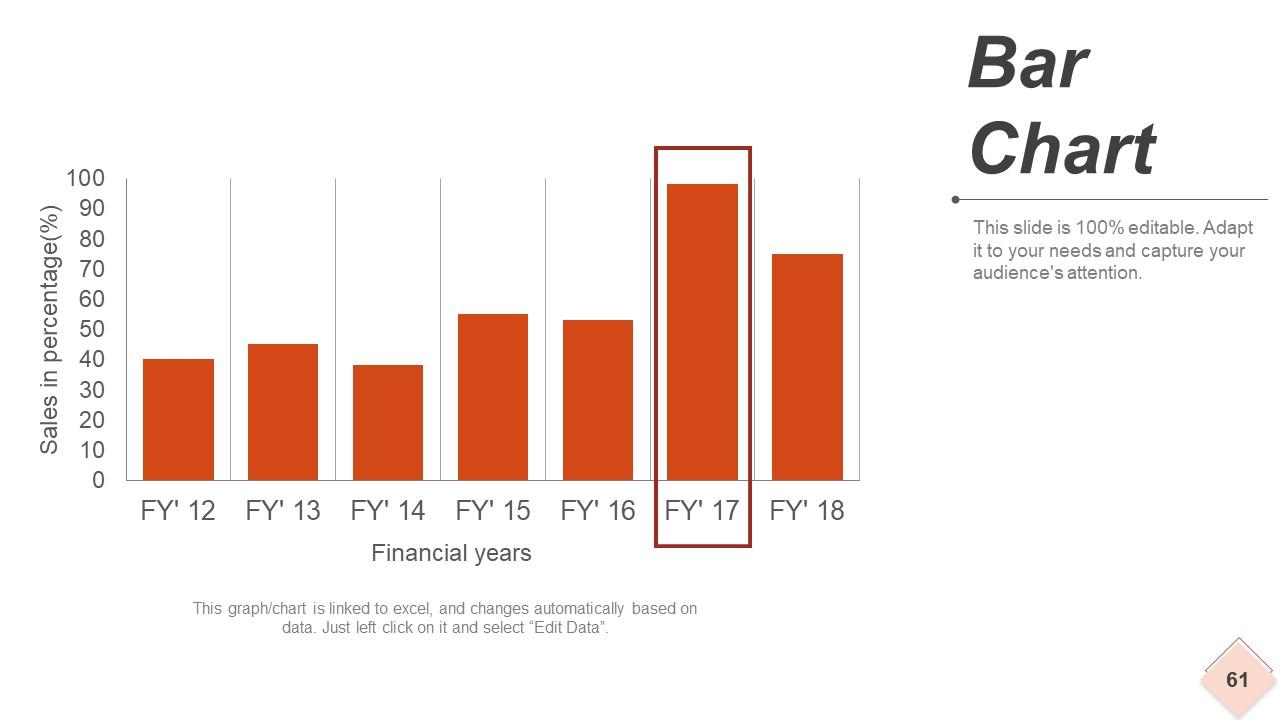
Slide 61: This is a Bar Chart slide to show product/ entity growth, comparison, specifications etc.
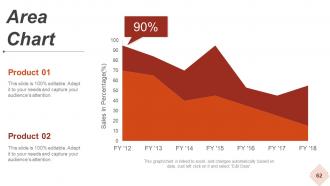
Slide 62: This is an Area Chart slide to show product/ entity growth, comparison, specifications etc.
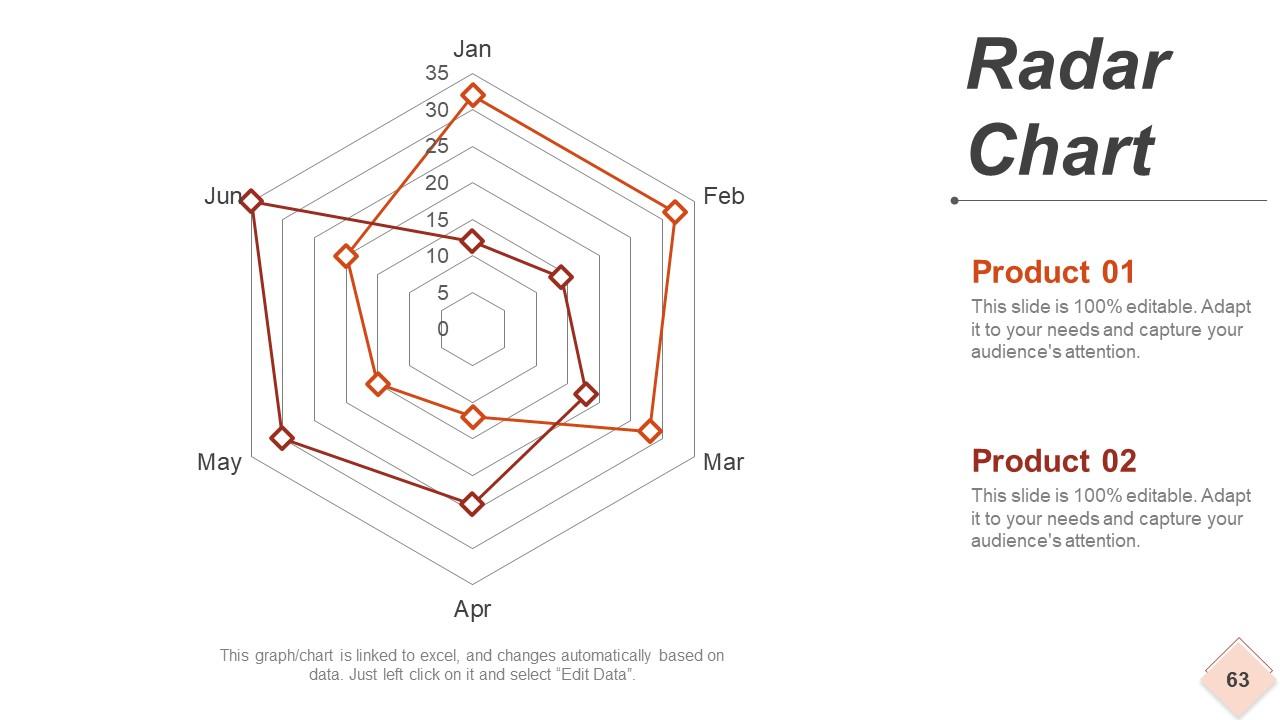
Slide 63: This is a Radar Chart slide to show product/ entity comparison, specifications etc.
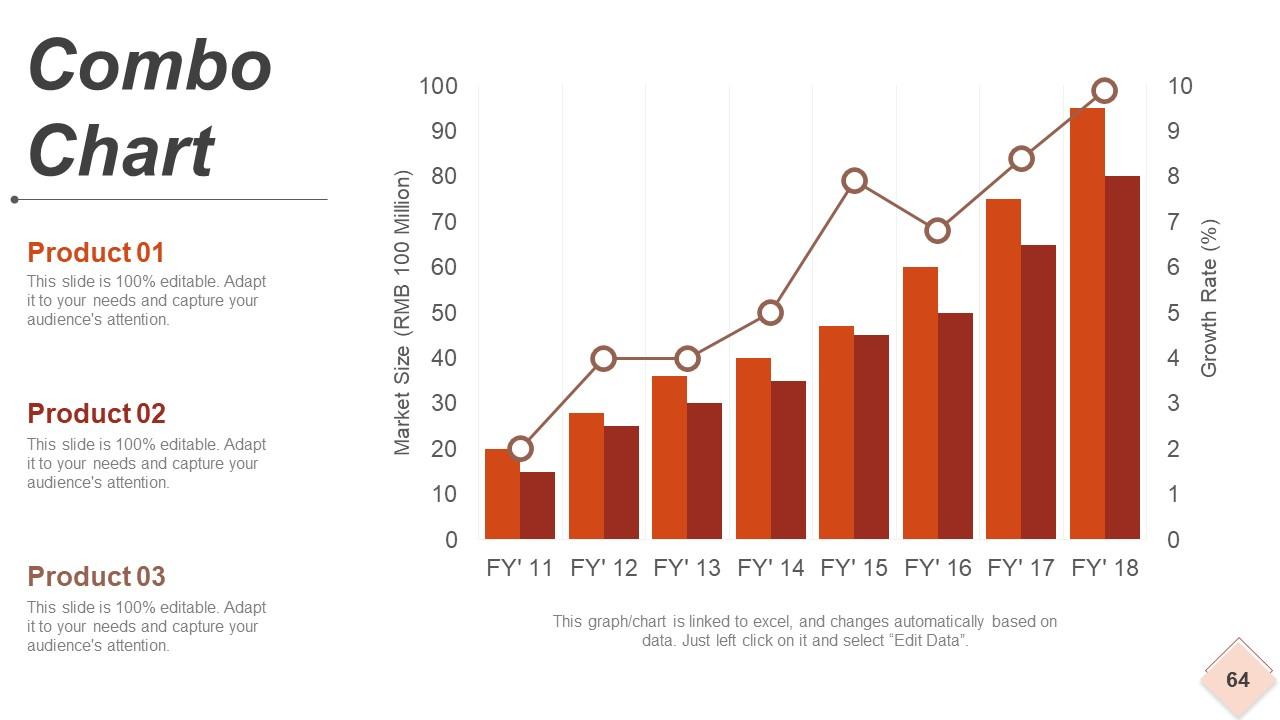
Slide 64: This is a Combo Chart slide to show information, comparison specifications etc.
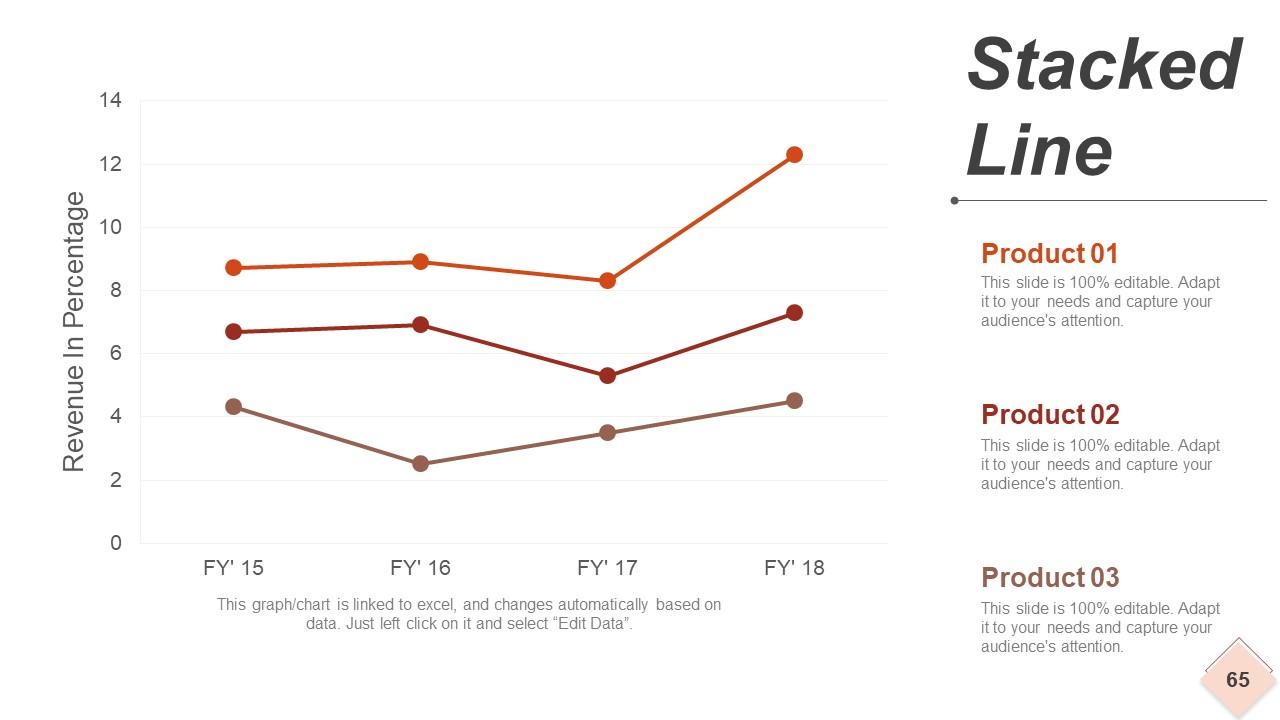
Slide 65: This slide presents Stacked Line graph to show product/ entity growth, comparison etc.
Slide 66: This is a Contact Us slide with Email, Address# street number, city, state, Contact Numbers.
Slide 67: This is a Thank You slide for acknowledgement or to end the presentation.
Strategic workforce planning model powerpoint presentation slides with all 67 slides:
Divulge the ingredients with our Strategic Workforce Planning Model Powerpoint Presentation Slides. Acquaint folks with all the constituent elements.
-
Appreciate the research and its presentable format.
-
Very well designed and informative templates.


