Sales performance powerpoint presentation slides
Improve sales team’s skills to sell products and services using ready-to-use Sales Performance PowerPoint Presentation Slides. Monitor and guide salesforce with right techniques of making a sale with sales performance PPT presentation templates. Educate sales people to set goals and achieve those to satisfy the customers. Incorporate content-ready sales performance analysis PowerPoint presentation complete deck which comprises of templates such as financial highlights, products offering, sales performance dashboard, sales revenue, sales budget vs actual, quarterly sales summary review, key sales performance metrics, sales rep performance scorecard, sales KPI performance, sales activities dashboard, sales KPI tracker, and more. Enhance the process of goal setting and planning, feedback, skill development and performance review with sales performance PowerPoint presentation layouts. Keep a tab on the information like sales quotas, territories, incentive compensation, job assessment, forecasting, and more. Use easy-to-understand sales performance PPT presentation slides to boost and encourage behavior that drive sales. Be faster at it with our Sales Performance Powerpoint Presentation Slides. They assist you to gain time.
- Google Slides is a new FREE Presentation software from Google.
- All our content is 100% compatible with Google Slides.
- Just download our designs, and upload them to Google Slides and they will work automatically.
- Amaze your audience with SlideTeam and Google Slides.
-
Want Changes to This PPT Slide? Check out our Presentation Design Services
- WideScreen Aspect ratio is becoming a very popular format. When you download this product, the downloaded ZIP will contain this product in both standard and widescreen format.
-

- Some older products that we have may only be in standard format, but they can easily be converted to widescreen.
- To do this, please open the SlideTeam product in Powerpoint, and go to
- Design ( On the top bar) -> Page Setup -> and select "On-screen Show (16:9)” in the drop down for "Slides Sized for".
- The slide or theme will change to widescreen, and all graphics will adjust automatically. You can similarly convert our content to any other desired screen aspect ratio.
Compatible With Google Slides

Get This In WideScreen
You must be logged in to download this presentation.
PowerPoint presentation slides
Presenting sales performance PowerPoint deck. This deck is a set of 35 PowerPoint templates. Our PowerPoint professionals have incorporated appropriate diagrams, layouts, templates and icons related to the topic. The best part is that these templates are completely customizable. Edit the color, text and icon as per your need. Click the download button below to get your hands on the ready-made sales performance PPT deck.
Content of this Powerpoint Presentation
Slide 1: This slide introduces Sales Performance. State Your Company Name and get started.
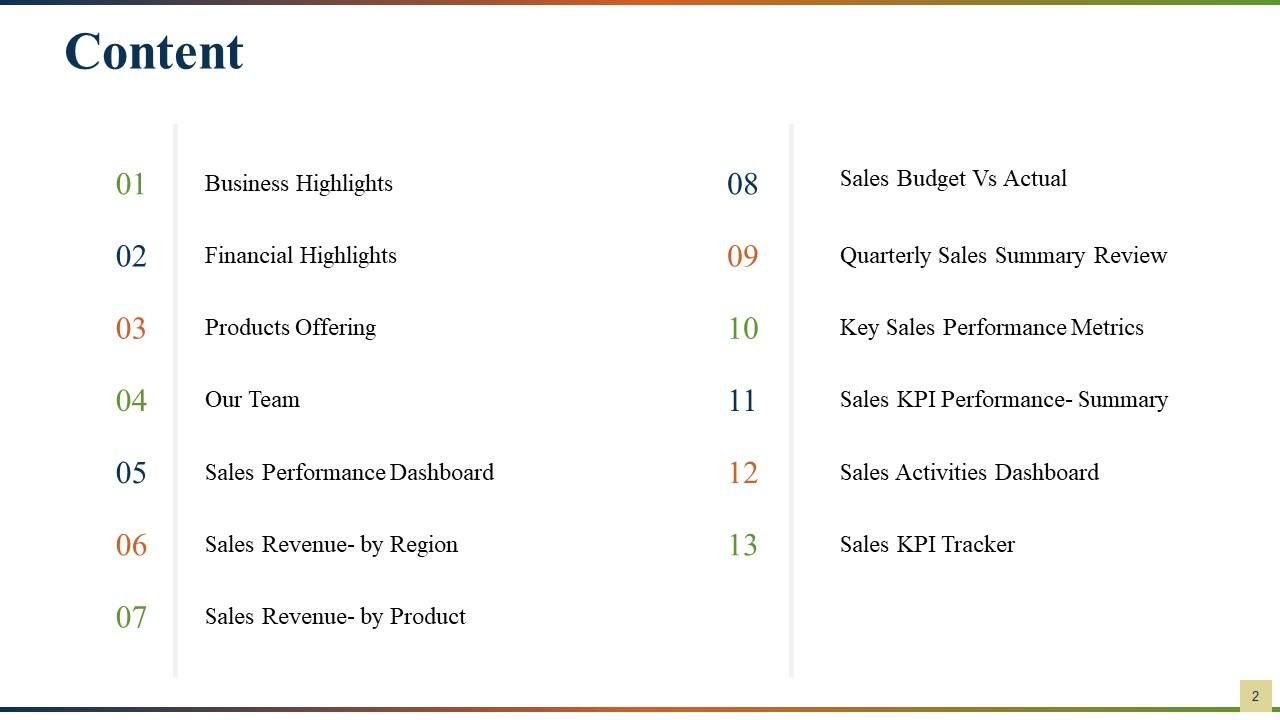
Slide 2: This slide showcases Content. The constituents are- 01: Business Highlights 02: Financial Highlights 03: Products Offering 04: Our Team 05: Sales Performance Dashboard 06: Sales Revenue- by Region 07: Sales Revenue- by Product 08: Sales Budget Vs Actual 09: Quarterly Sales Summary Review 10: Key Sales Performance Metrics 11: Sales KPI Performance- Summary 12: Sales Activities Dashboard 13: Sales KPI Tracker
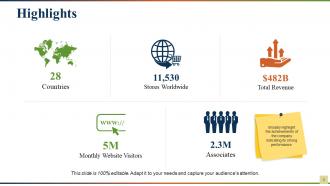
Slide 3: This slide showcases Highlights. Broadly highlight the achievements of the company indicating its strong performance. The points are- Total Revenue, Associates, Countries, Stores Worldwide, Monthly Website Visitors.
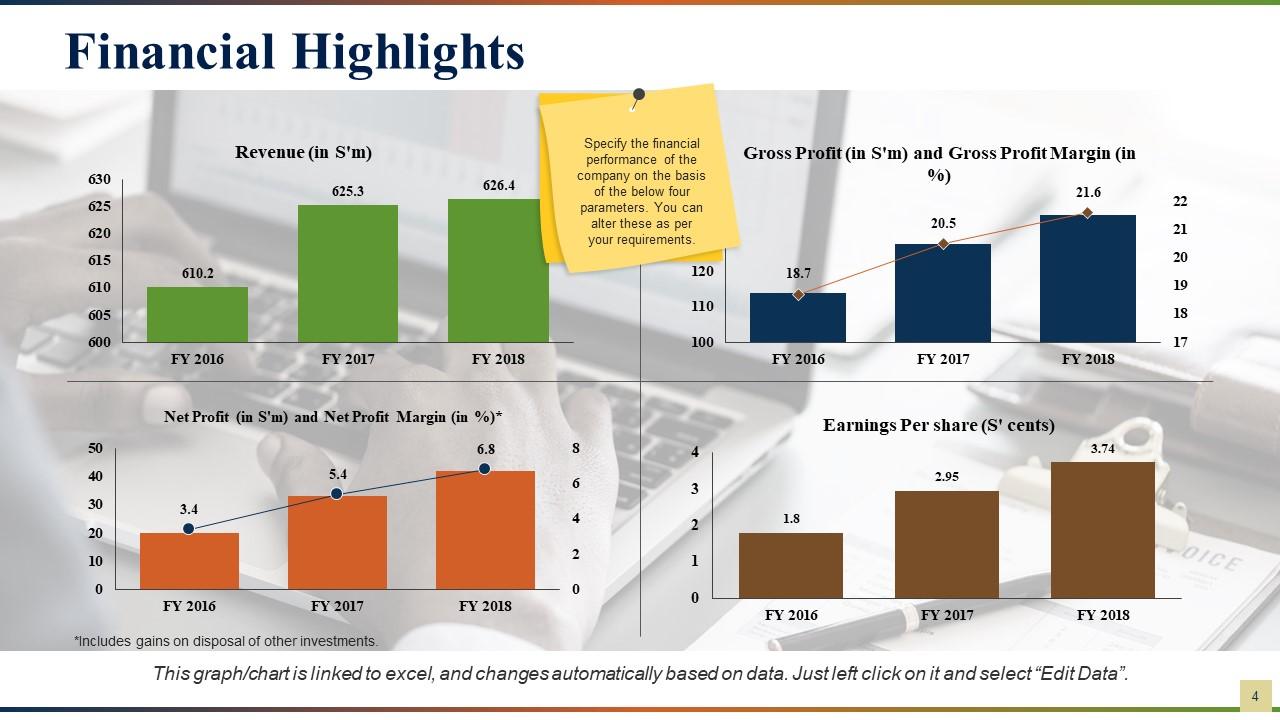
Slide 4: This slide displays Financial Highlights. Specify the financial performance of the company on the basis of the below four parameters. You can alter these as per your requirements.
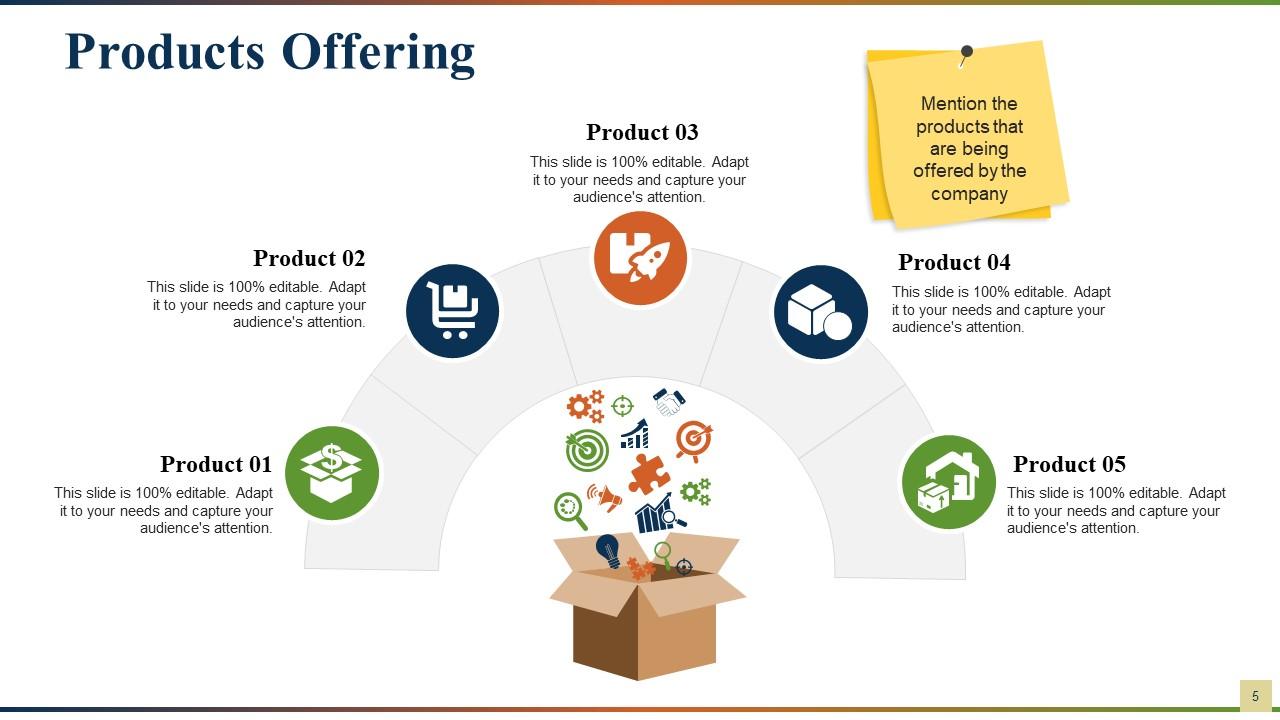
Slide 5: This slide presents Products Offering. Mention the products that are being offered by the company.
Slide 6: This slide presents Our Team with name, designation and image boxes.
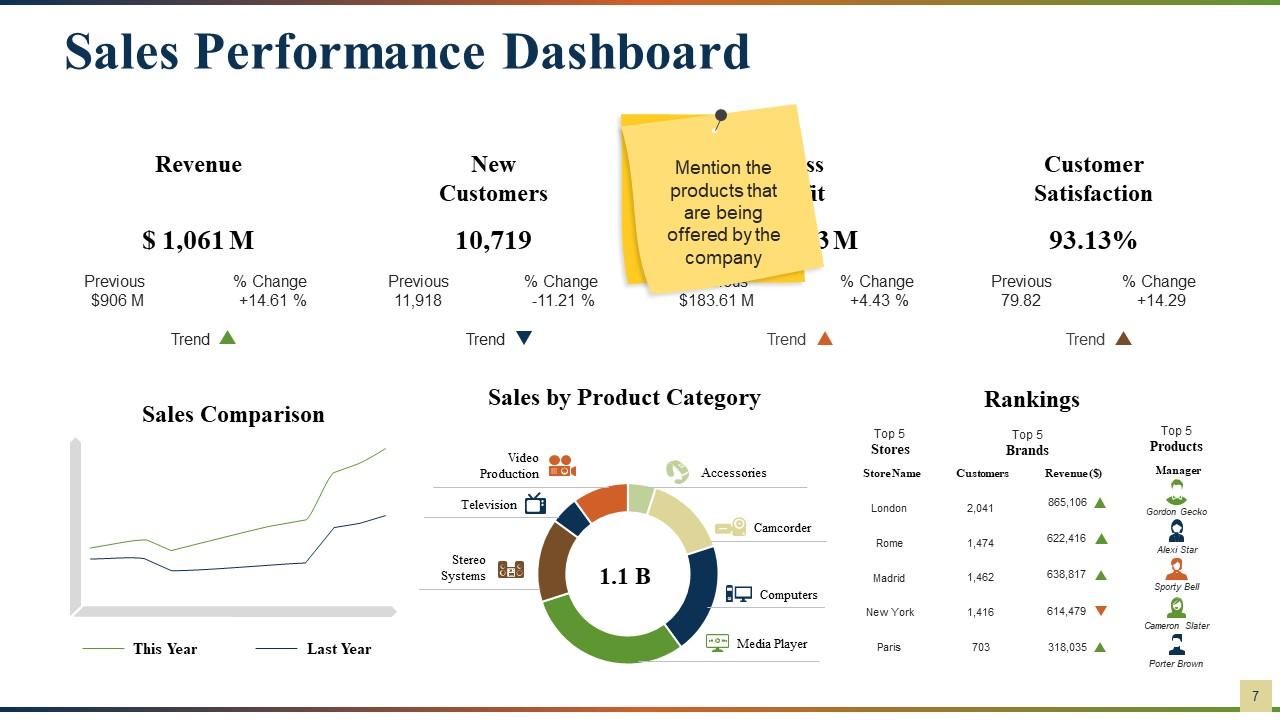
Slide 7: This slide showcases a Sales Performance Dashboard.
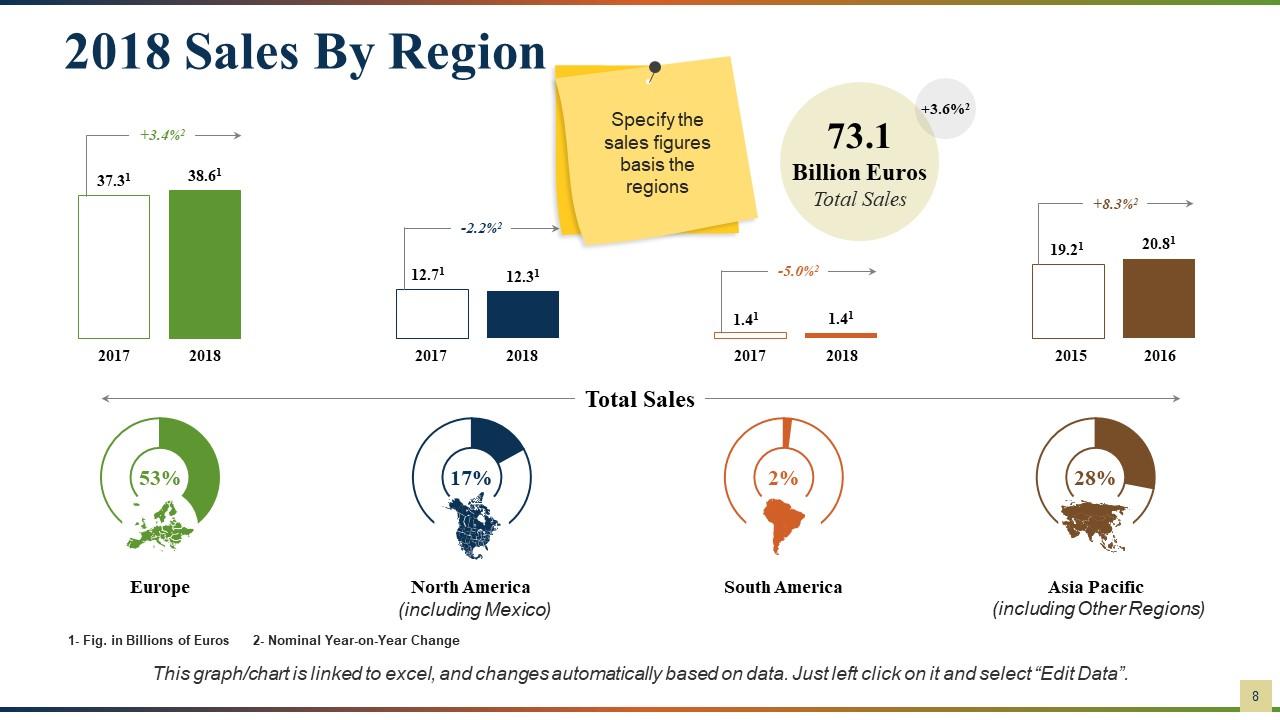
Slide 8: This slide shows Sales By Region. Specify sales figures on basis of the regions.
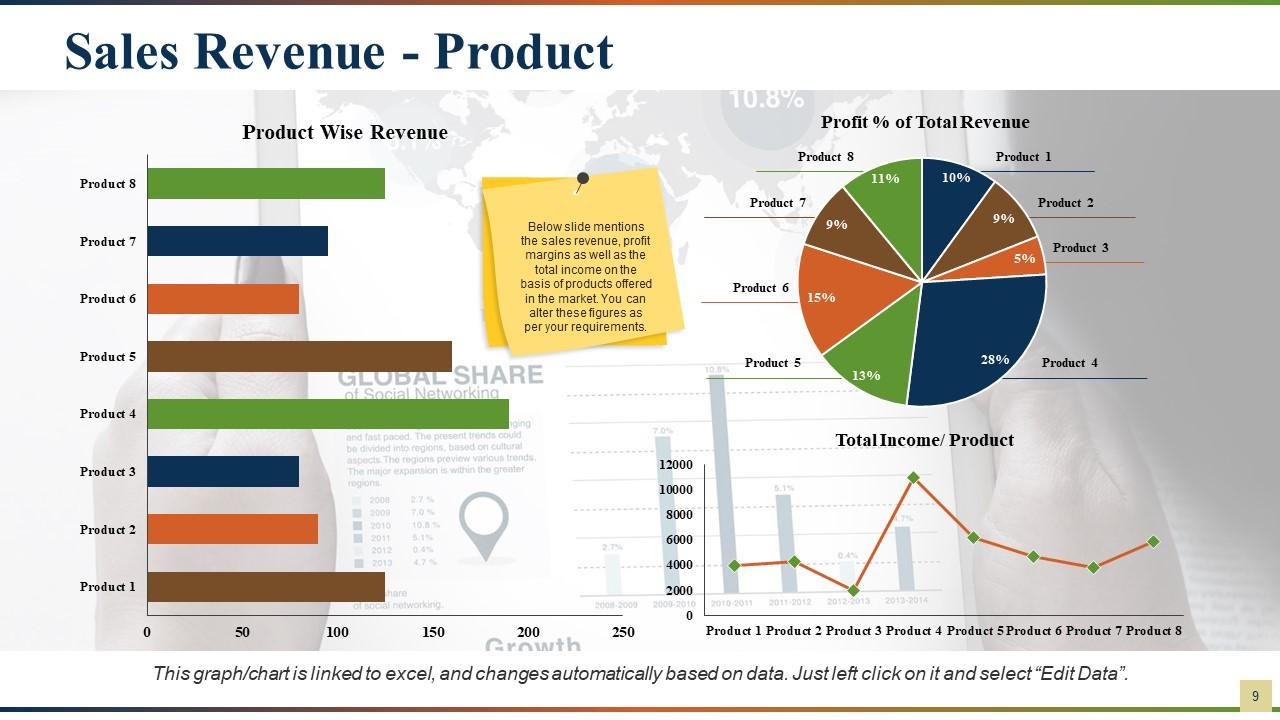
Slide 9: This slide presents Sales Revenue - Product wise Below slide mentions the sales revenue, profit margins as well as the total income on the basis of products offered in the market. You can alter these figures as per your requirements.
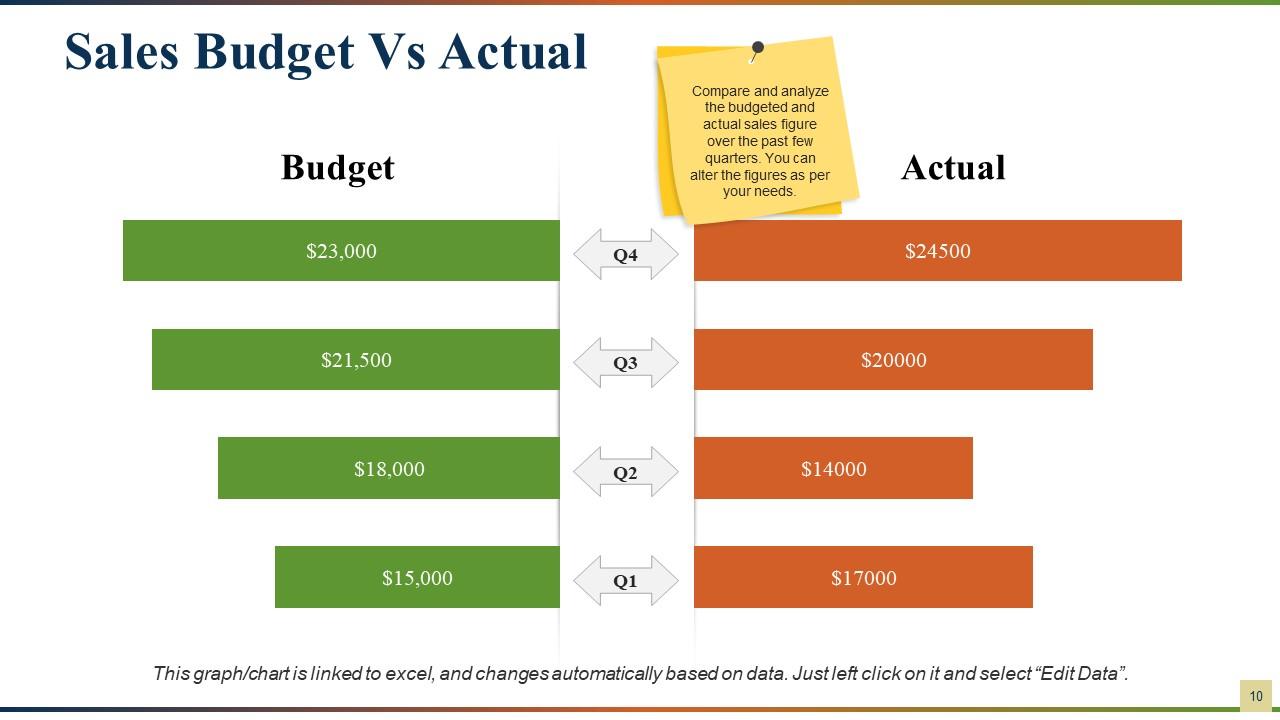
Slide 10: This slide shows Sales Budget Vs Actual Compare and analyze the budgeted and actual sales figure over the past few quarters. You can alter the figures as per your needs.
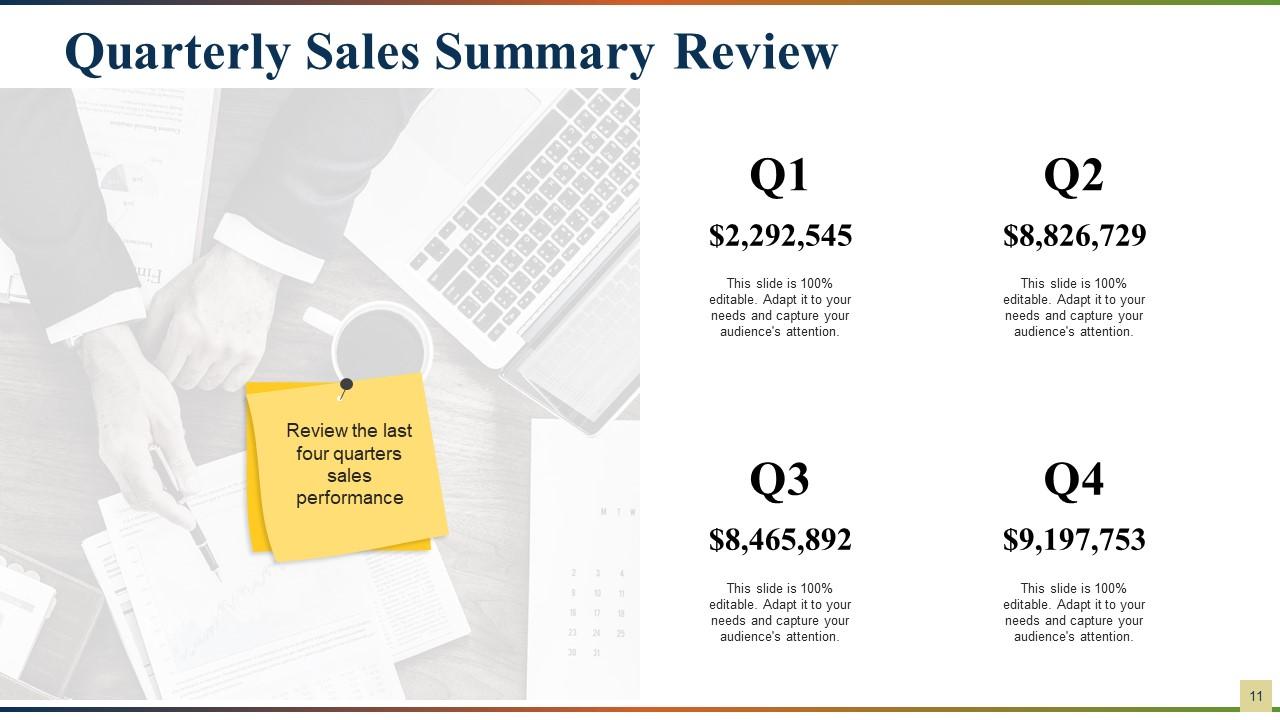
Slide 11: This slide presents a Quarterly Sales Summary Review for 4 quarters.
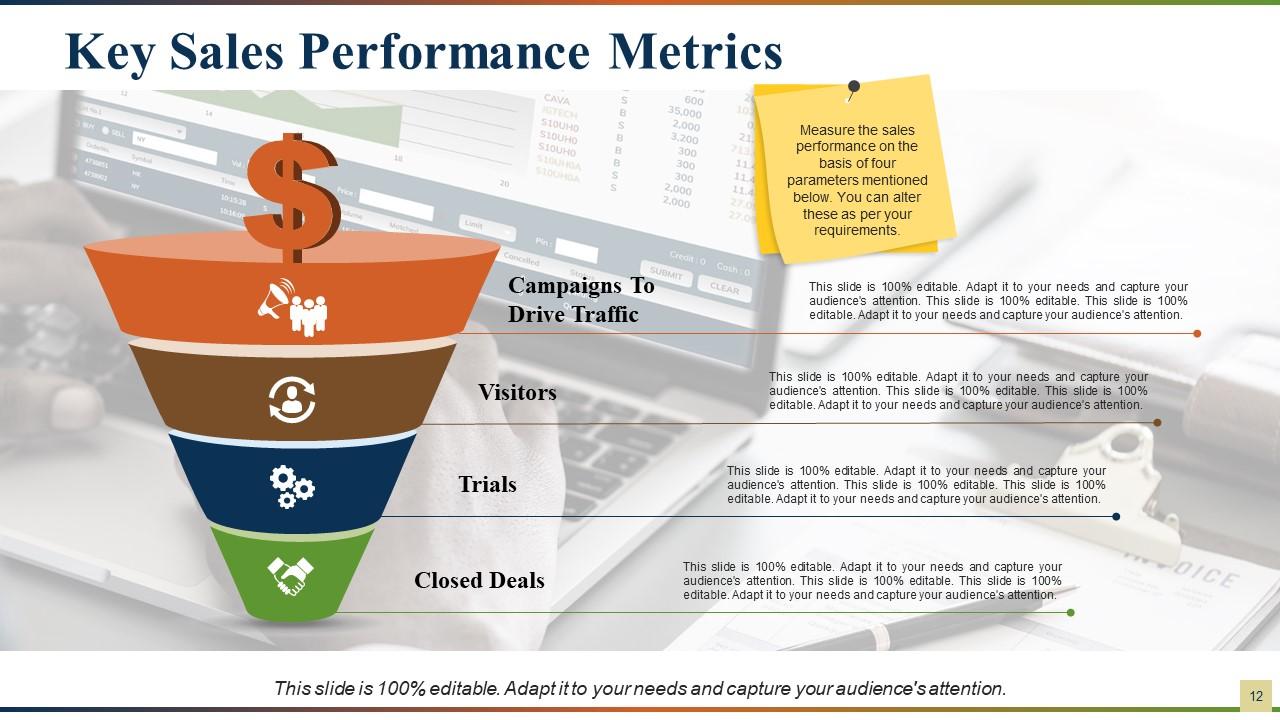
Slide 12: This slide presents Key Sales Performance Metrics. They are as follows- Campaigns To Drive Traffic, Visitors, Trials, Closed Deals. Measure the sales performance on the basis of four parameters mentioned below. You can alter these as per your requirements.
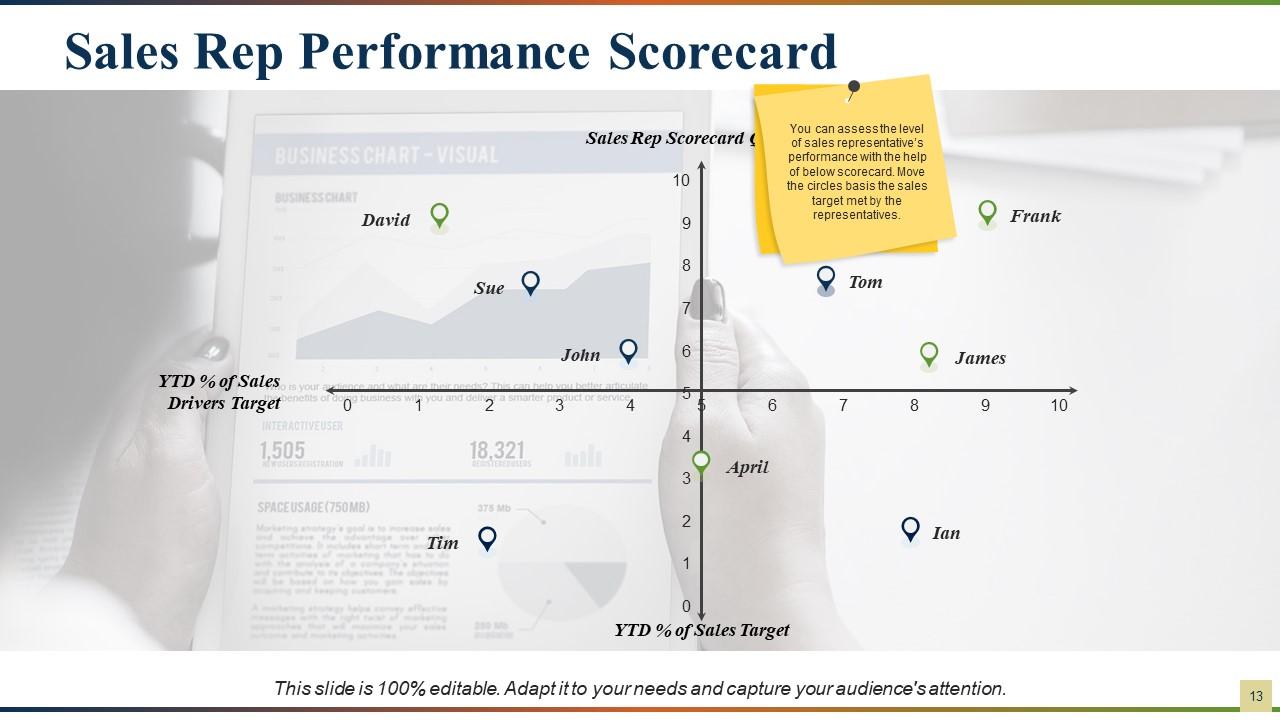
Slide 13: This slide showcases a Sales Rep Performance Scorecard. You can assess the level of sales representative’s performance with the help of below scorecard. Move the circles basis the sales target met by the representatives.
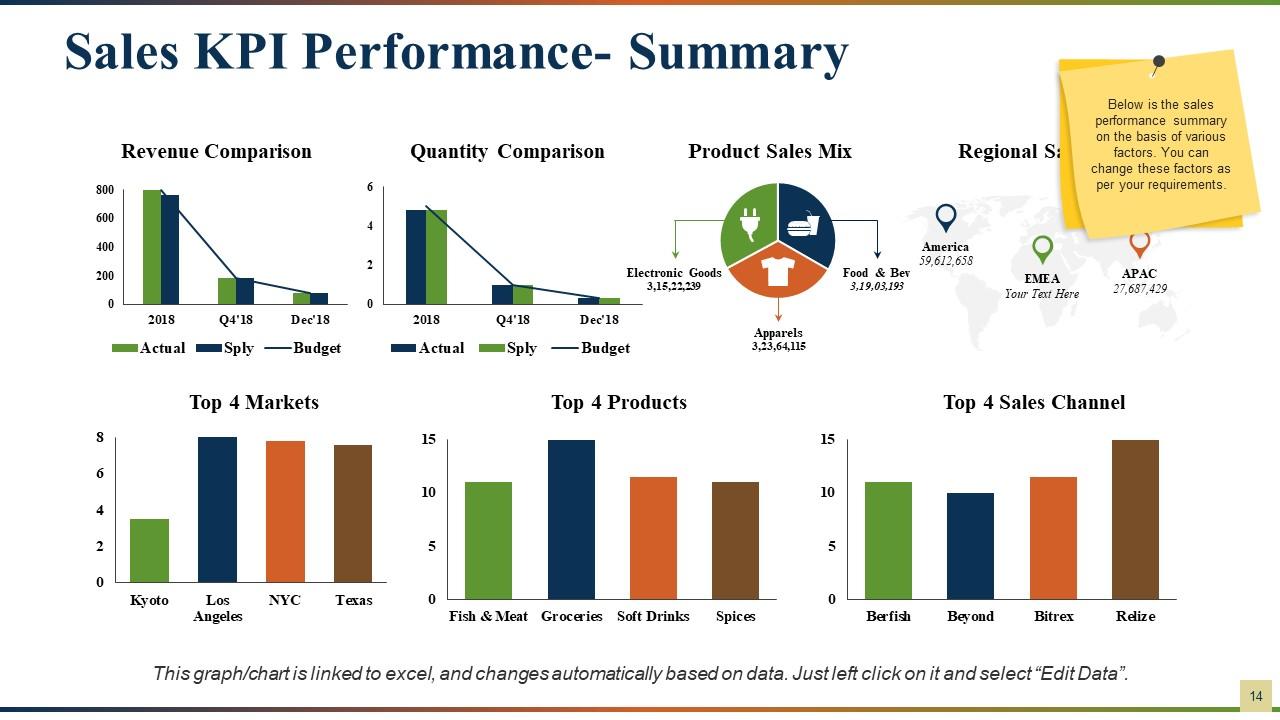
Slide 14: This slide presents a Sales KPI Performance- Summary with the following points- Quantity Comparison, Revenue Comparison, Product Sales Mix, Regional Sales Mix, Top 4 Products, Top 4 Sales Channel, Top 4 Markets. Below is the sales performance summary on the basis of various factors. You can change these factors as per your requirements.
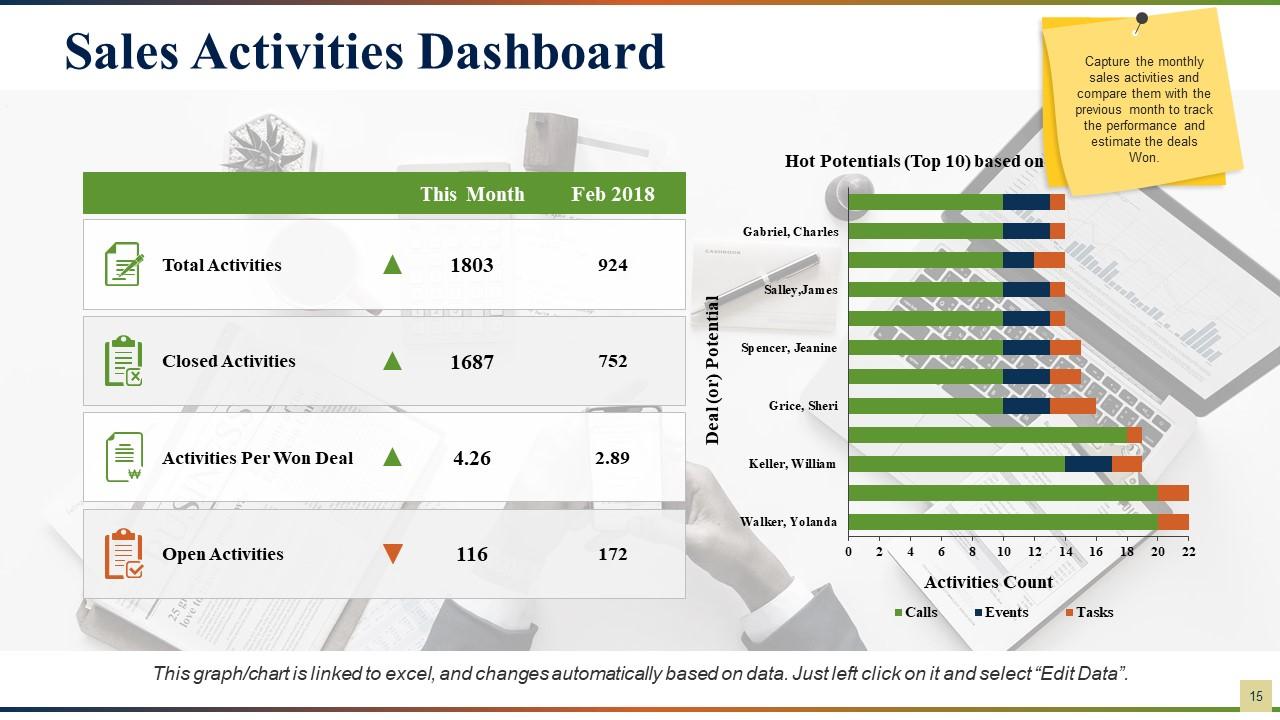
Slide 15: This slide showcases a Sales Activities Dashboard with- Open Activities, Closed Activities, Total Activities, Activities Per Won Deal. Capture the monthly sales activities and compare them with the previous month to track the performance and estimate the deals Won.
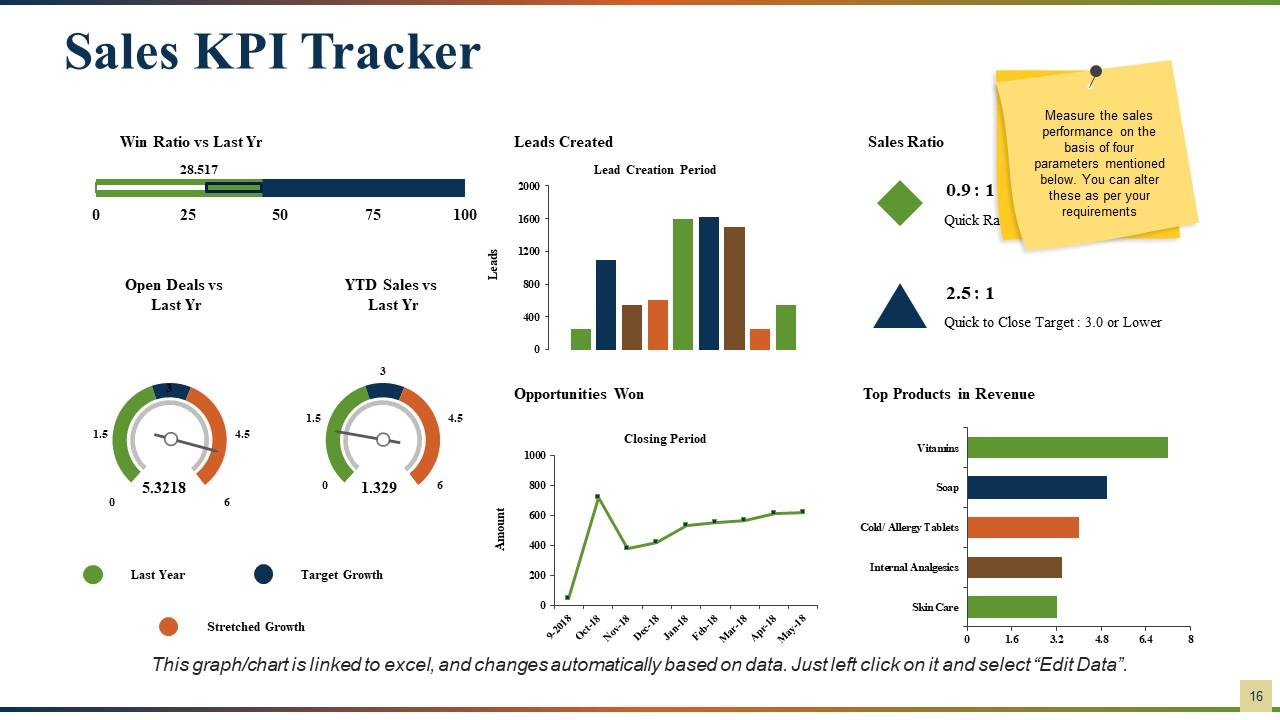
Slide 16: This slide shows Sales KPI Tracker with Leads Created, Opportunities Won, Top Products in Revenue, Sales Ratio, Last Year, Target Growth, Stretched Growth, Open Deals vs Last Yr. Measure the sales performance on the basis of four parameters mentioned below. You can alter these as per your requirements
Slide 17: This is a Coffee Break slide to halt.
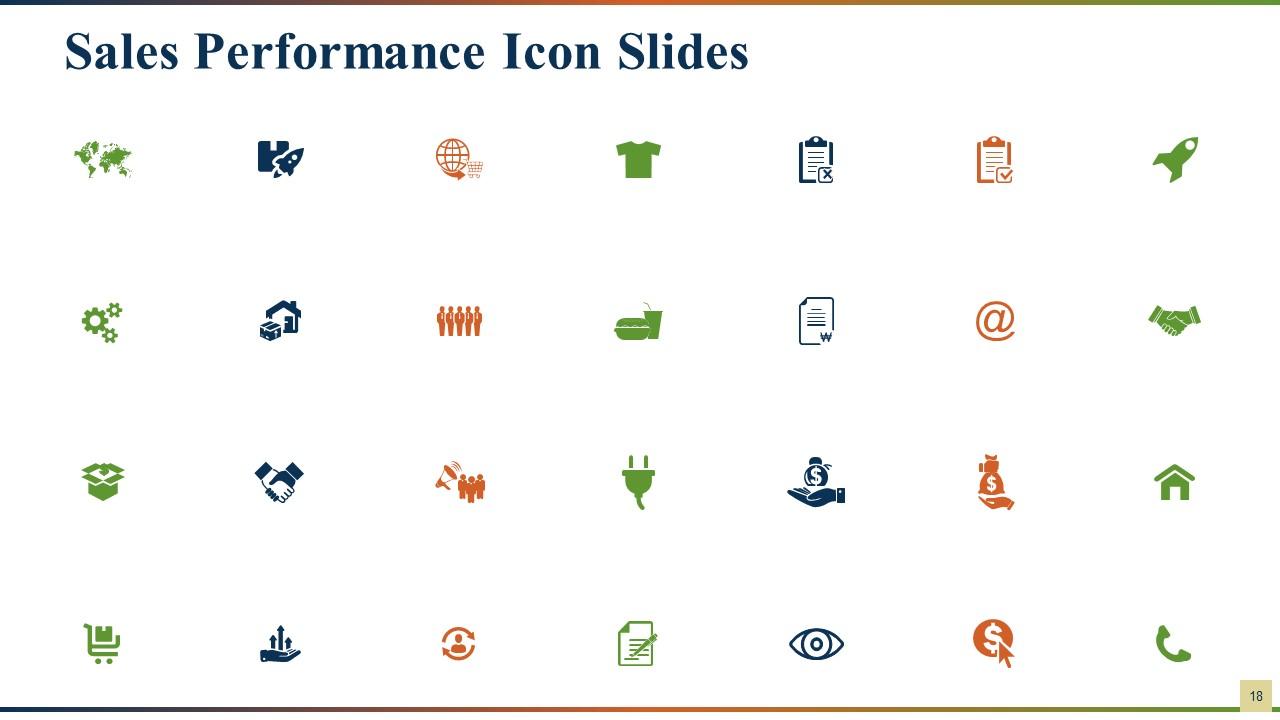
Slide 18: This slide shows Sales Performance Icons. Use them as per your requirement.
Slide 19: This slide is titled Charts & Graphs to move forward.
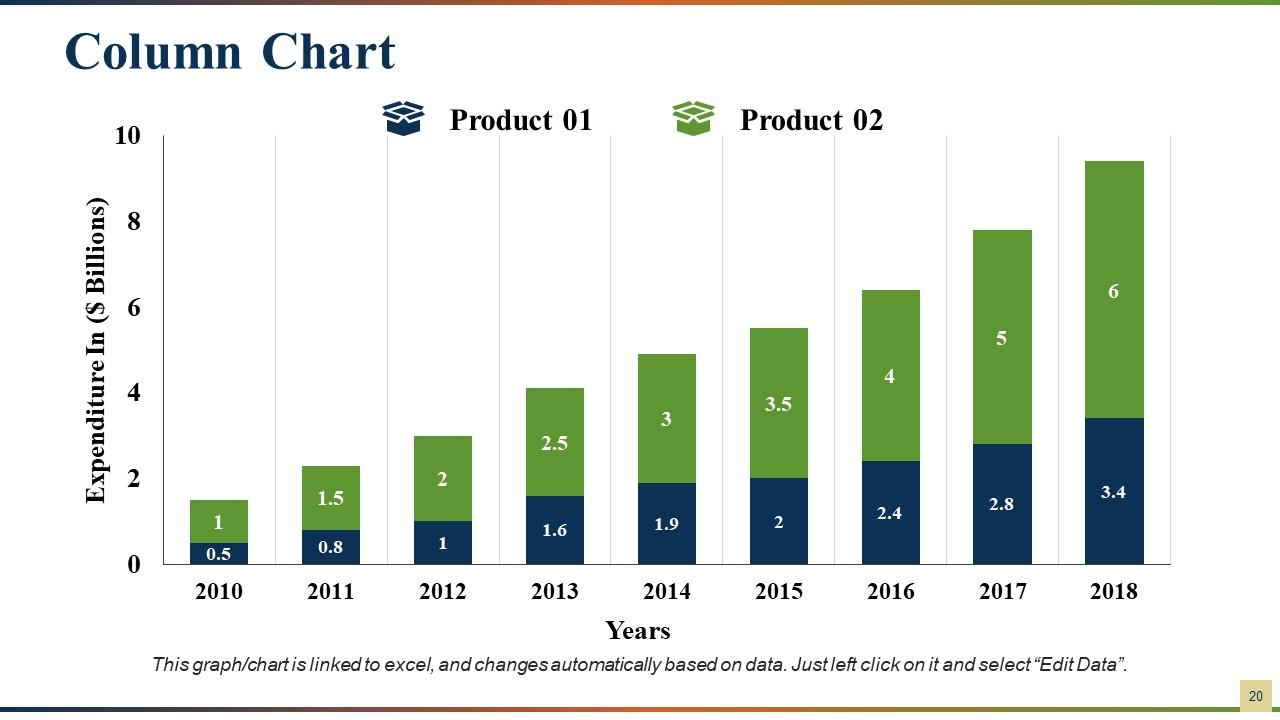
Slide 20: This is a Column Chart slide to show product comparison.
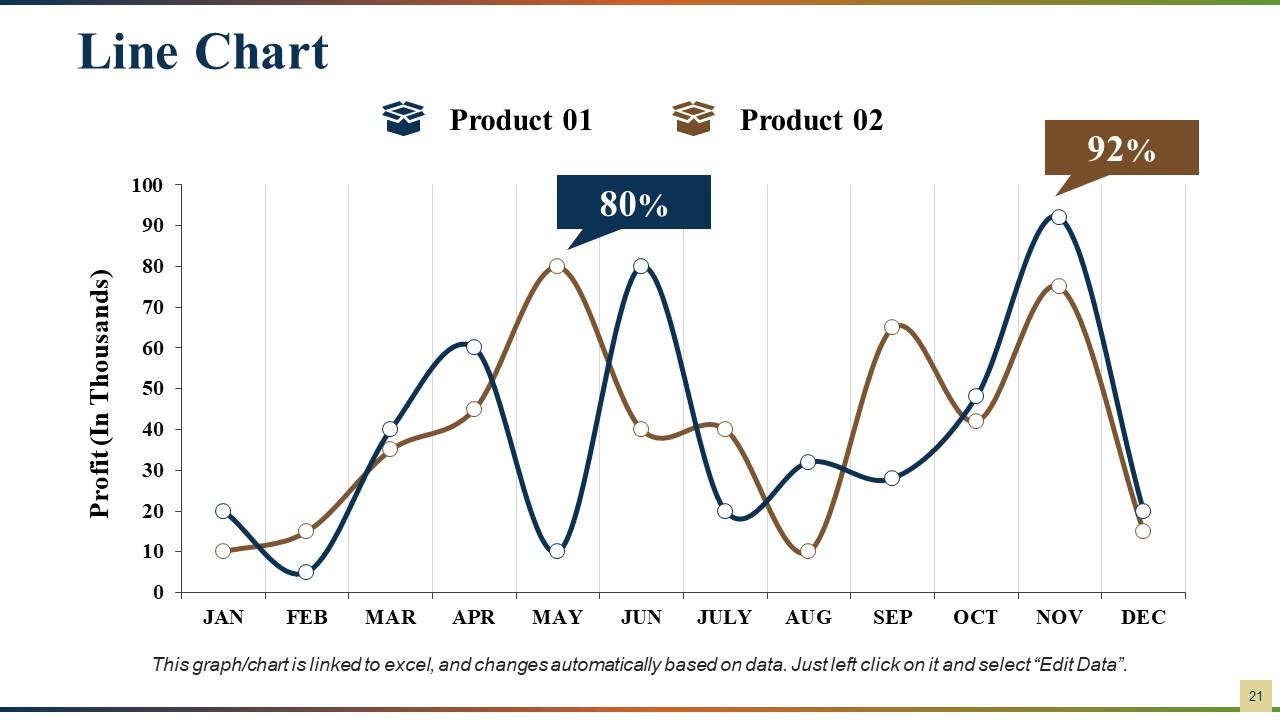
Slide 21: This is a Line Chart slide to show product comparison.
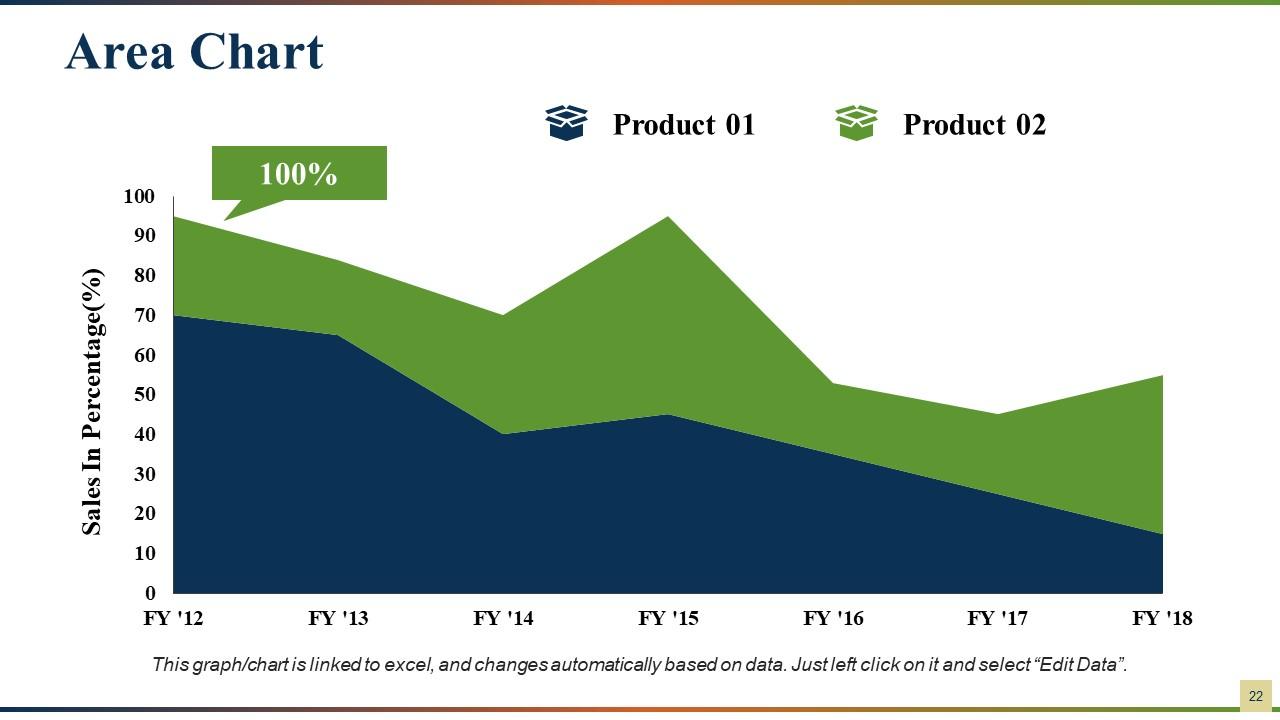
Slide 22: This is an Area Chart slide to show product comparison.
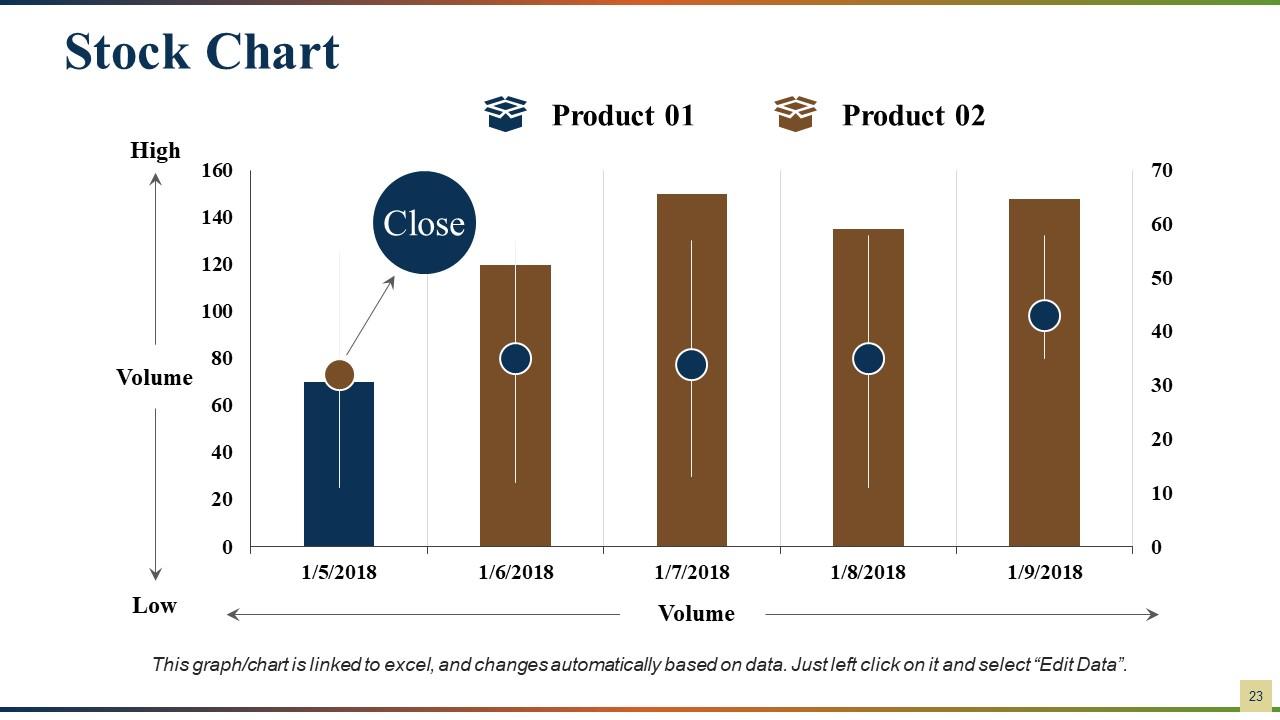
Slide 23: This is a Stock Chart slide to show product comparison in terms of high and low.
Slide 24: This slide is titled Additional Slides to move forward.
Slide 25: This is Our Mission slide with Vision and Mission.
Slide 26: This is Meet Our Team slide with names, designation and image boxes.
Slide 27: This is an About Us slide. State company/team specifications here.
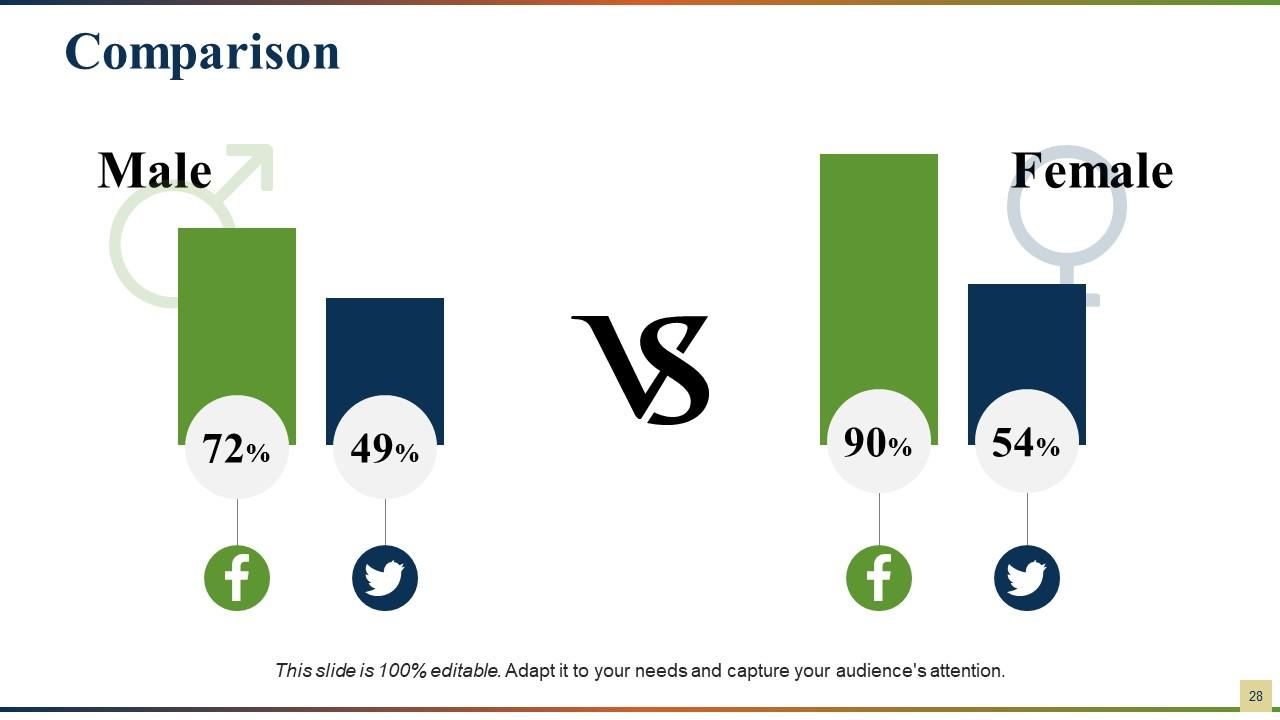
Slide 28: This is a Comparison slide between Males and Females.
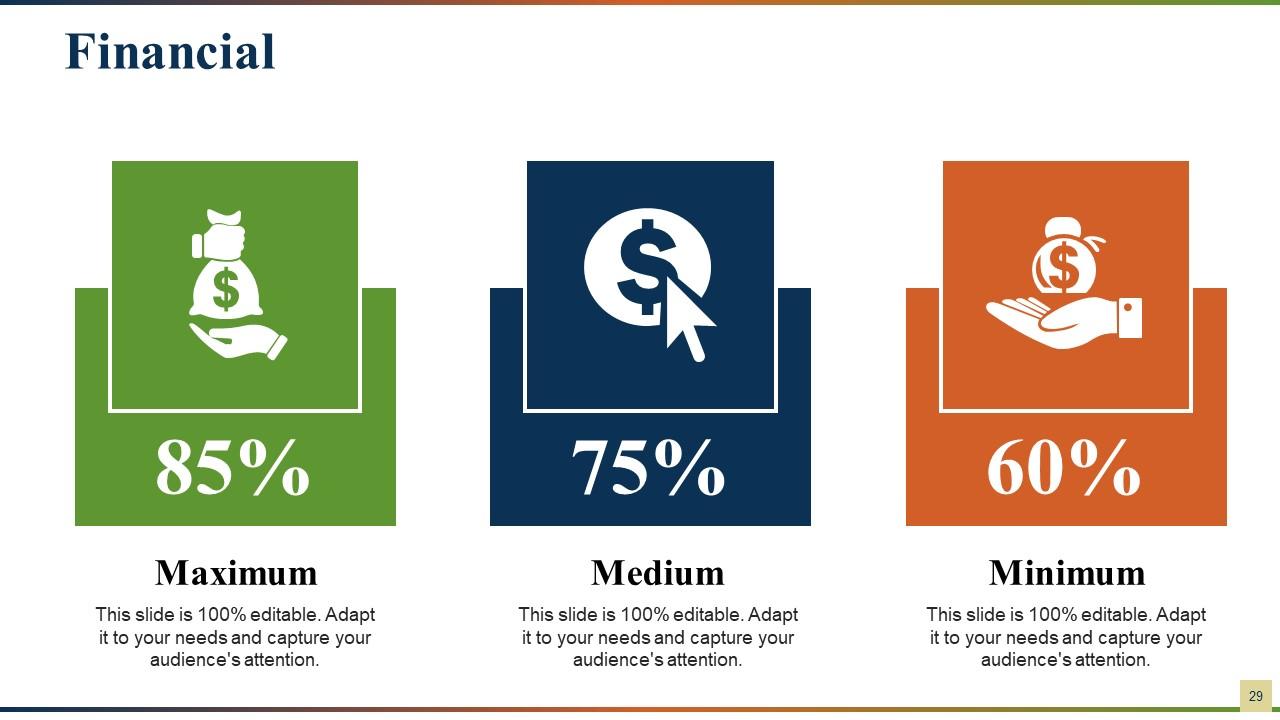
Slide 29: This is a Financial Score slide in terms of Maximum, Medium and Minimum.
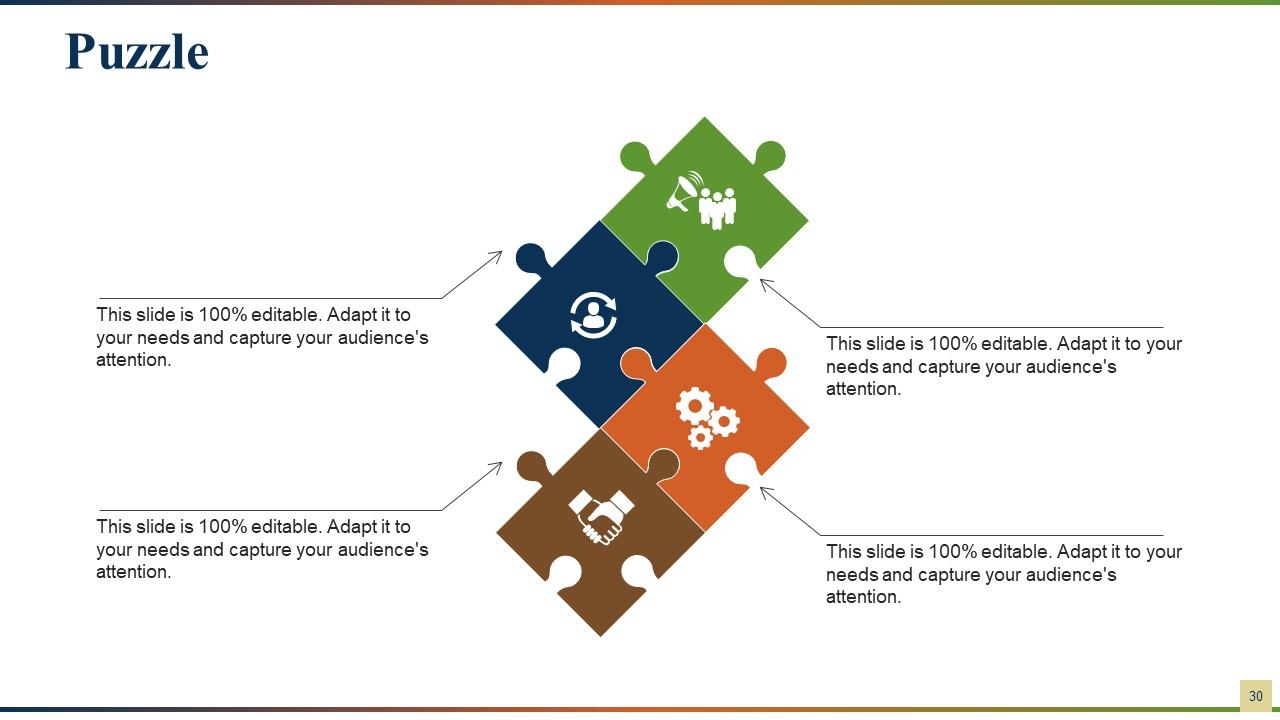
Slide 30: This is a Puzzle slide. State information, specifications here.
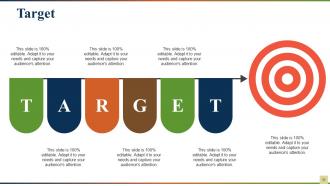
Slide 31: This is a Target slide. State your targets here.
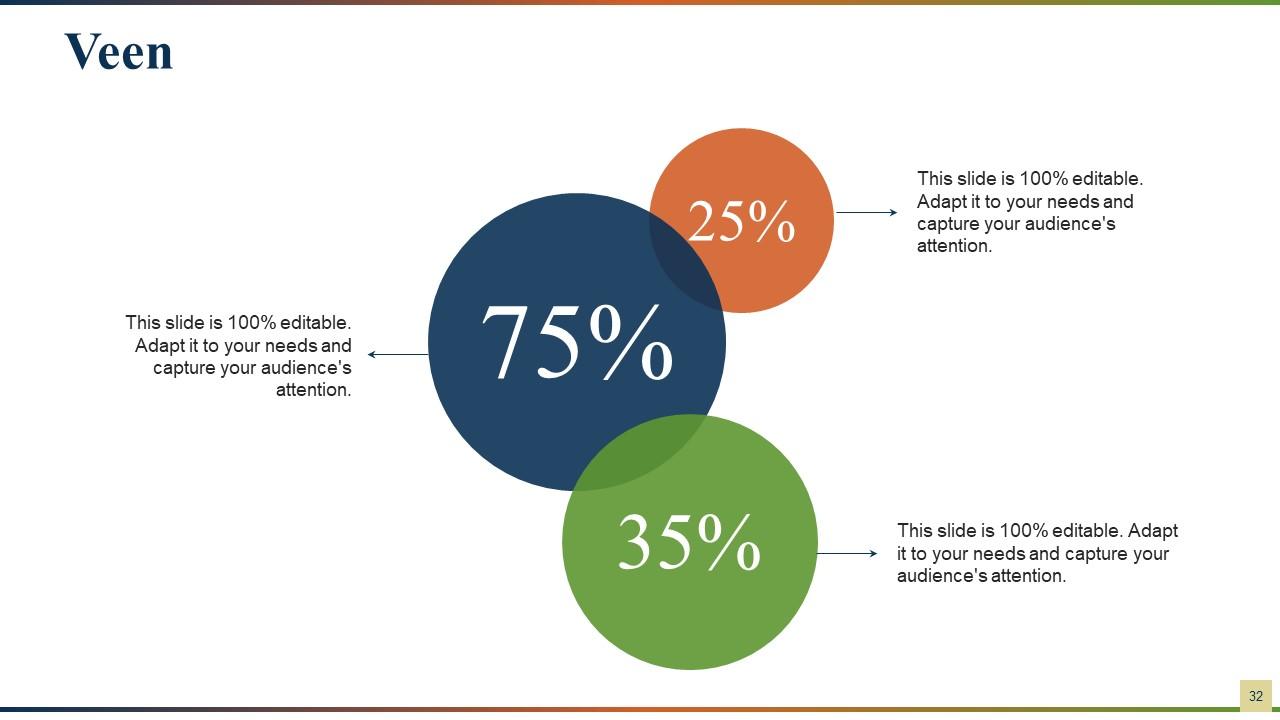
Slide 32: This is a Venn diagram slide. State information, specifications here.
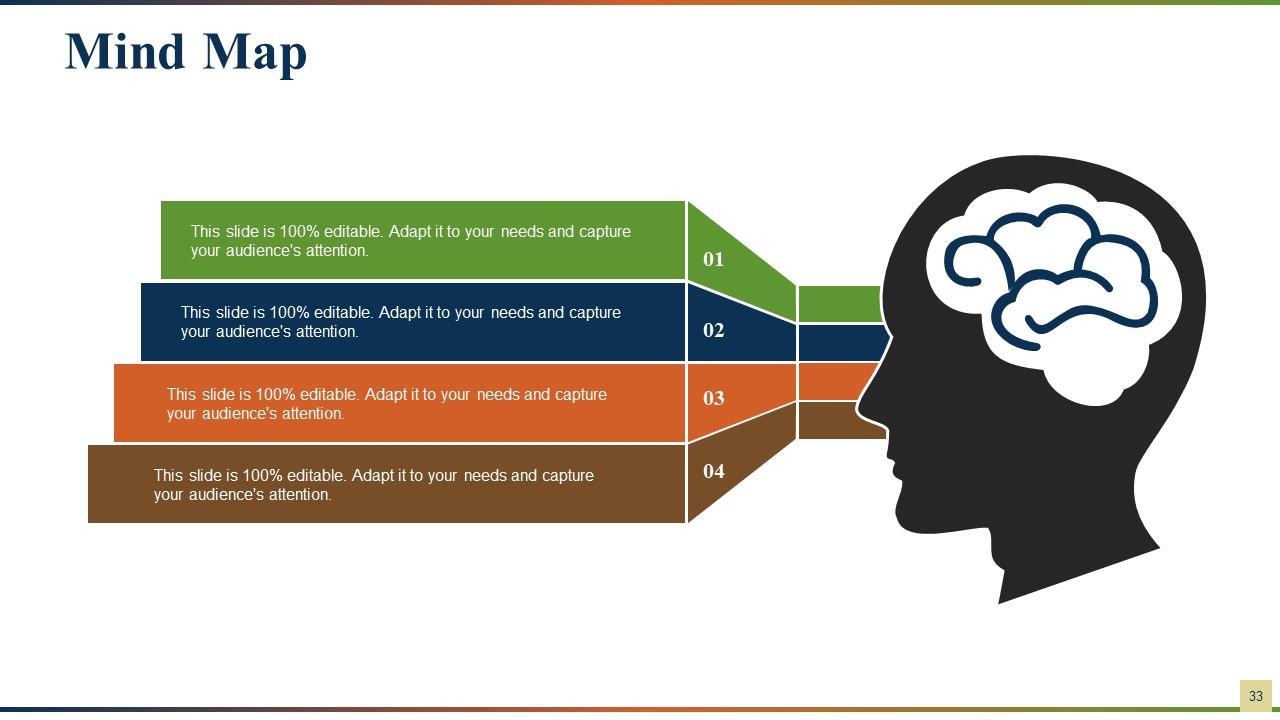
Slide 33: This is a Mind Map slide. State information, specifications here.
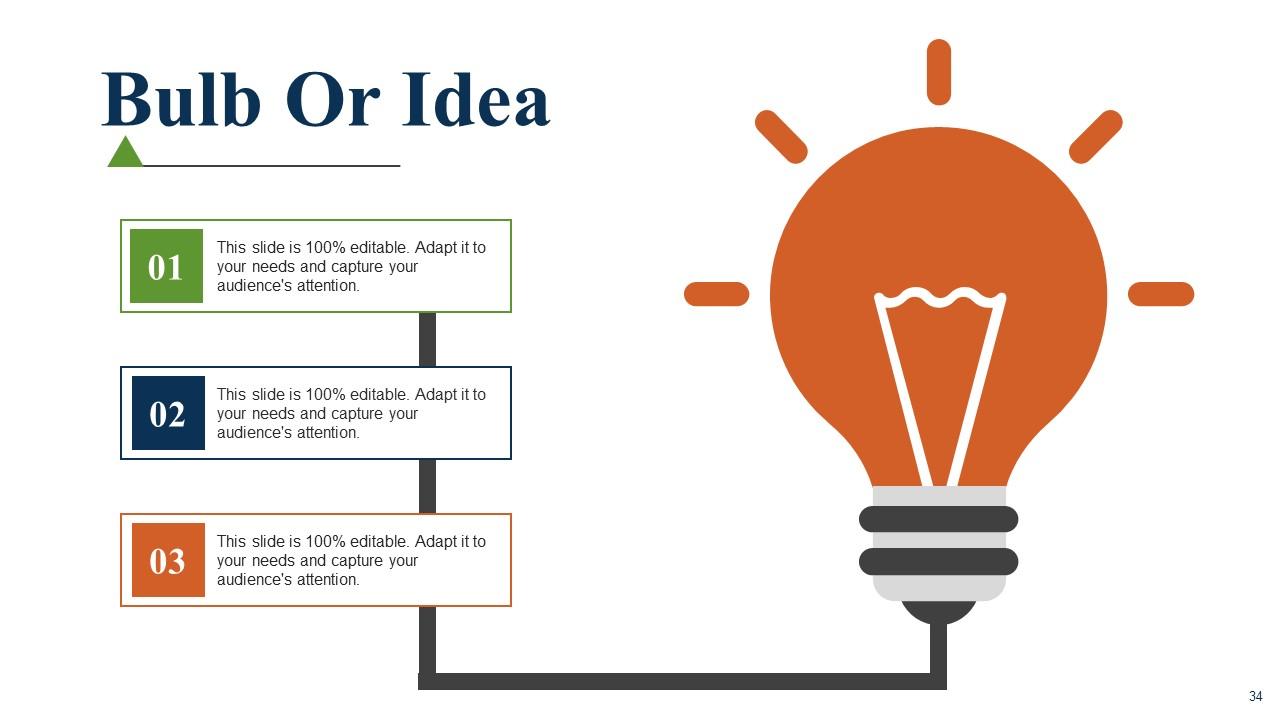
Slide 34: This is a Bulb/Idea slide. State information, specifications, innovative aspects here.
Slide 35: This is a Thank You slide with Email Address, Contact Numbers, Address.
Sales performance powerpoint presentation slides with all 35 slides:
Insist on giving a flawless account of yourself with our Sales Performance Powerpoint Presentation Slides. It ensures an impeccable job.
-
Awesome presentation, really professional and easy to edit.
-
Appreciate the research and its presentable format.


