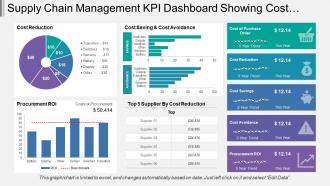
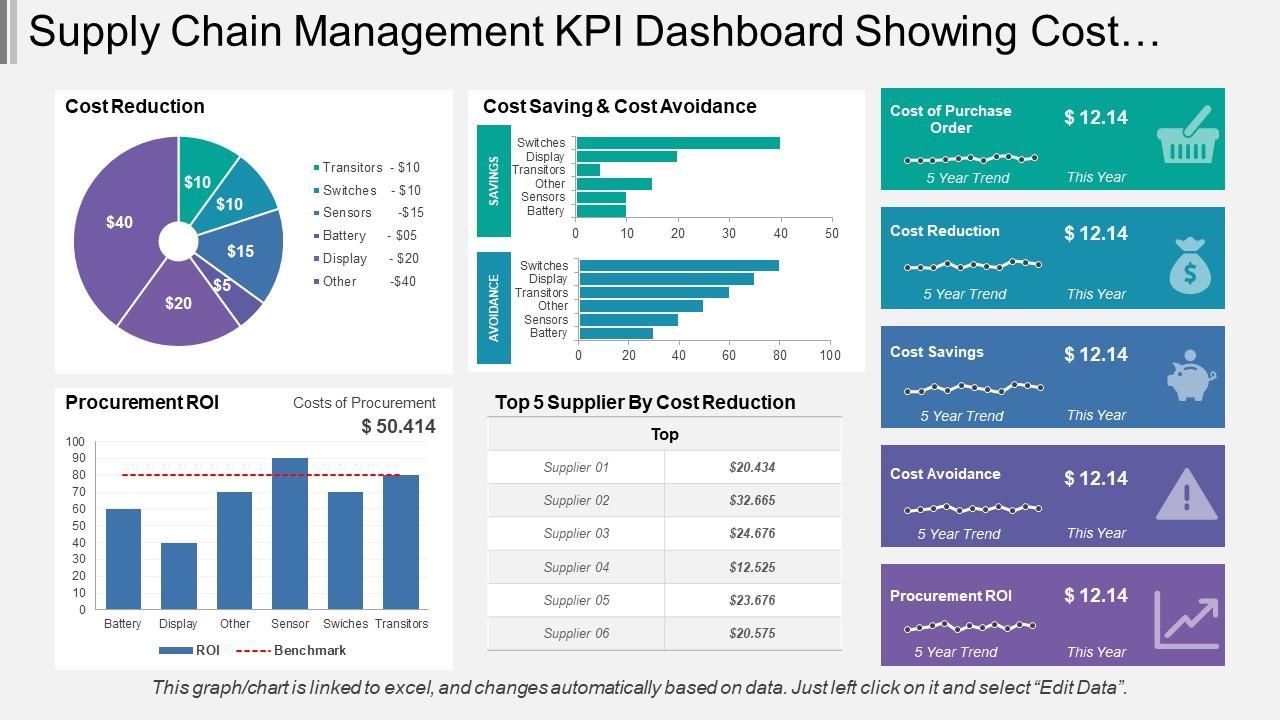
Supply Chain Management Kpi Dashboard Showing Cost Reduction And Procurement Roi
Try Before you Buy Download Free Sample Product
Audience
Editable
of Time
Every desired element is included in our Supply Chain Management Kpi Dashboard Showing Cost Reduction And Procurement Roi. It contains all the ingredients.
People who downloaded this PowerPoint presentation also viewed the following :
Supply Chain Management Kpi Dashboard Showing Cost Reduction And Procurement Roi with all 6 slides:
Make your next million dollar idea look like a million bucks. Agile Supply Chain Management Kpi Dashboard Showing Cost Reduction And Procurement Roi designs available for your next high dollar presentation.
FAQs for Supply Chain Management Kpi Dashboard Showing Cost Reduction
Start with order fulfillment time, inventory turnover, and perfect order rate - those are your bread and butter metrics. Supplier lead time matters way more than people think, especially when things get crazy. Also track stockout frequency because nobody wants angry customers blowing up your phone. Your dashboard needs cash-to-cash cycle time and transportation costs as a percentage of sales. Oh, and demand forecast accuracy is huge since it affects literally everything else downstream. Cost per order rounds it out nicely. Honestly, don't overthink it at first - nail these basics then add more specific stuff based on whatever's actually breaking in your supply chain.
Dude, get a KPI dashboard set up ASAP. You'll catch problems way before they blow up into disasters. Real-time updates on inventory, supplier stuff, delivery delays - no more waiting around for weekly reports or drowning in Excel hell. Set alerts for when things go sideways, like lead times jumping or stockouts hitting your limits. Then you can pivot fast with suppliers or logistics before customers even know something's wrong. Honestly, it's weirdly satisfying watching those metrics update throughout the day. Game changer for sure.
So definitely track inventory turnover ratio and stockout frequency first. Carrying costs too. Your boss is gonna ask about fill rates constantly - trust me on that one. Days sales outstanding matters, plus safety stock levels and how accurate your demand forecasts are. Those keep you ahead of problems instead of always scrambling. Oh, and obsolete inventory percentage is huge because dead stock just murders your cash flow. I'd honestly start with maybe 6-7 of these metrics, then build from there. Pick the ones hitting customer satisfaction and profit margins hardest.
Dude, lead times mess with basically every number you're tracking. Your inventory turnover tanks when they get longer. Carrying costs go up. Customer satisfaction drops because stuff shows up late. You end up needing way more safety stock too, which is annoying but necessary. What really kills you though? Inconsistent timing. I'd rather have a solid 10-day window than some random 5-15 day range where you're just guessing. That unpredictability makes planning a nightmare. It's wild how one metric can screw with everything else, but that's supply chain for you.
Honestly, tech is a game-changer here. It grabs data straight from your ERP and warehouse systems automatically - no more updating those nightmare spreadsheets by hand. Dashboard tools like Tableau or Power BI can calculate all your metrics (delivery times, inventory turnover, supplier stuff) without you lifting a finger. Plus you'll get pinged when something goes wrong, which is clutch. I'd start by figuring out where your supply chain data actually lives, then connect it all through one of those dashboard platforms. Trust me, once it's running you won't know how you survived before.
Honestly, most dashboards I've seen are just data dumps that nobody actually uses. Map your KPIs to real business goals first - revenue, customer happiness, or making operations smoother. Leading indicators are way better than lagging ones since they help you fix stuff before it breaks. Categories work well: cost, quality, delivery, flexibility. Keep it to 2-3 metrics per section though, or you'll lose people. Your dashboard needs to tell a clear story. Oh, and definitely test it with your team - they'll spot issues you missed. What actually helps them make decisions? That's what matters.
Pick 3-5 KPIs your stakeholders actually care about first. Trust me, cramming everything on one screen just creates dashboard chaos that nobody touches. Go with the basics - on-time delivery, inventory turnover, cost per shipment work well. Your data needs to refresh often enough to be useful, and those red/yellow/green status lights? They're clutch for spotting issues fast. Keep it simple and tied to decisions your team makes every day. Oh, and definitely test with real users before you roll it out everywhere - saves you headaches later.
Look, customer satisfaction is basically your reality check for whether your supply chain is actually working. When those scores tank, you'll usually see it hit delivery times and order accuracy first. Think of it as your early warning system. Good satisfaction numbers? Your on-time deliveries are probably solid and you're not running out of stock constantly. I always tell people to throw satisfaction right on their dashboard - maybe sounds obvious but you'd be surprised how many skip it. Watch how it moves with your other metrics. Honestly saves you from bigger headaches later.
Track your data accuracy first - you want 95%+ or people won't trust it. Then see if teams are actually using the thing (adoption rates matter). The big question though? Is it helping make better decisions - like faster inventory turns or catching supply chain issues quicker. Honestly, the best sign is when people stop asking for manual reports and just use your dashboard instead. I'd check response times too - how fast can someone spot a problem? Set up quarterly check-ins to compare against where you started. If your lead times aren't shrinking or costs dropping after a few months, something's off with either the data or the design.
So basically you'd want to embed forecasting models right into your dashboard widgets - stuff like demand predictions, inventory alerts, supplier risk scores that update live. Tableau and Power BI both let you hook up ML models through APIs or their built-in features. Honestly though? Getting clean historical data to train your models is where like 90% of these projects crash and burn. I'd start small - maybe just demand forecasting first. Then you can build from there. Oh and definitely show confidence intervals with your predictions so people actually know how much to trust them.
Oh man, data quality is your biggest enemy here. Your metrics will be trash if the data going in is messy and inconsistent. Half the battle is just getting systems to actually talk to each other properly - I swear, sometimes it feels like they're designed to NOT work together. Don't fall into the "let's track everything" trap either. I've literally seen dashboards with like 47 different KPIs that nobody actually looks at. Different departments will push for their favorite metrics too, which gets messy fast. My advice? Pick 3-5 metrics that actually matter, get those data sources rock solid first, then slowly add more.
Honestly, start with your data sources - ERP, WMS, whatever you're using. Set up automated alerts for weird stuff or missing data. Trust me, I've watched dashboards completely tank because nobody noticed a broken connection for weeks. Get some governance rules in place too, like who can actually mess with the data. Monthly reviews help catch when things start drifting. Oh, and here's what really matters - have someone eyeball your biggest KPIs against the actual source docs every week. Automation's great but nothing beats a human double-checking the important stuff.
Honestly, start simple with line charts for tracking stuff like on-time delivery and inventory turnover - they're perfect for spotting trends. Gauges are clutch for showing how you're hitting targets (fill rates, supplier scores, whatever). Heat maps will blow your mind for geographic data - shipping routes, regional performance, all that stuff just pops visually. Bar charts work best when you're comparing suppliers or different categories. Oh, and waterfall charts are solid for breaking down cost factors. Don't go crazy though - stick to maybe 4-5 key metrics at first. You can pile on more later once everyone's not overwhelmed.
Honestly, monthly reviews are the sweet spot for most KPIs. But some stuff - like inventory turnover and order fulfillment rates - you'll want to check weekly since they can tank your customer satisfaction fast. I learned this the hard way at my last job lol. Daily monitoring makes sense for really volatile industries. Set up alerts for anything that could spiral quickly, then do monthly deep dives on the strategic stuff like total costs. My rule? Start monthly across everything, then bump up frequency for whatever keeps you awake at night. Trust me, catching problems early beats explaining disasters later.
Honestly, you really need people from every department involved - procurement, logistics, warehousing, finance, IT, the works. Each team controls different data and knows where the real problems are. Skip this step and you'll build something that looks nice but totally misses the mark (trust me on this one). Finance sees completely different priorities than warehouse ops, you know? Getting everyone's input early saves you from redesigning later when someone goes "wait, this doesn't actually help us." Make sure they're part of the design process, not just asked for feedback at the end.
-
Innovative and Colorful designs.
-
The content is very helpful from business point of view.