Powerpoint Templates and Google slides for Number Of Leads
Save Your Time and attract your audience with our fully editable PPT Templates and Slides.
-
 Decline In Number Of Customers Of E Commerce Company Case Competition Complete Deck
This complete presentation has PPT slides on a wide range of topics highlighting the core areas of your business. It has professionally designed templates with relevant visuals and subject-driven content. This presentation deck has a total of fifty-five slides. Get access to the customizable templates by clicking the download button now. Our designers have created editable templates, the color text and font size of which can be adjusted. You can add or delete the content if required.
-
 Decline in the number of visitors of a theme park case competition complete deck
Presenting our decline in the number of visitors of a theme park case competition complete PPT deck. This PowerPoint theme includes forty-eight slides and each one of them is available for download in both standard and widescreen formats. Easy to edit, this PPT deck is compatible with all popular presentation software such as Microsoft Office, Google Slides, and many others.
-
 Number of flights decline in an airline company case competition complete deck
Deliver this complete deck to your team members and other collaborators. Encompassed with stylized slides presenting various concepts, this Number Of Flights Decline In An Airline Company Case Competition Complete Deck is the best tool you can utilize. Personalize its content and graphics to make it unique and thought provoking. All the fourty four slides are editable and modifiable, so feel free to adjust them to your business setting. The font, color, and other components also come in an editable format making this PPT design the best choice for your next presentation. So, download now.
-
 Number Of Bitcoin Atms By Region Training Ppt
Presenting Number of Bitcoin ATMs by Region. This PPT presentation is thoroughly researched by the experts, and every slide consists of appropriate content. All slides are customizable. You can add or delete the content as per your need. Download this professionally designed business presentation, add your content, and present it with confidence.
-
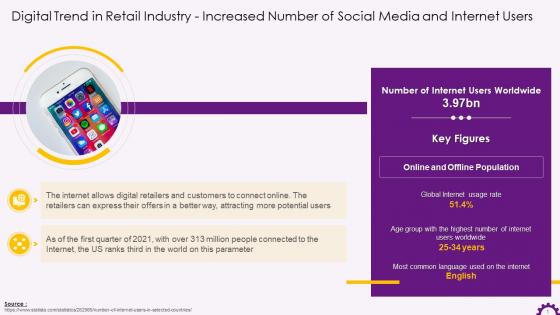 Digital Trend In Retail Industry Increased Number Of Internet Users Training Ppt
Presenting Increased Number of Social Media and Internet Users as a Digital trend in Retail Industry. This PPT presentation is thoroughly researched by the experts, and every slide consists of appropriate content. All slides are customizable. You can add or delete the content as per your need. Download this professionally designed business presentation, add your content, and present it with confidence.
-
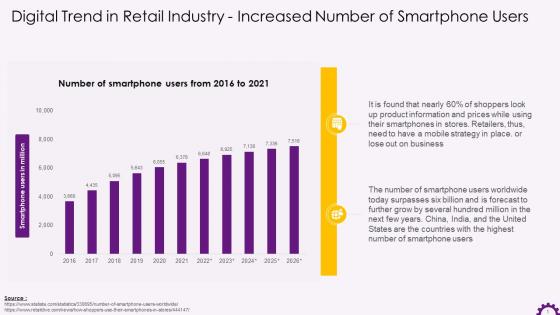 Digital Trend In Retail Industry Increased Number Of Smartphone Users Training Ppt
Presenting Increased Number of Smartphone Users as a Digital Trend in Retail Industry. Our PowerPoint experts have included all the necessary templates, designs, icons, graphs, and other essential material. This deck is well crafted by extensive research. Slides consist of amazing visuals and appropriate content. These PPT slides can be instantly downloaded with just a click. Compatible with all screen types and monitors. Supports Google Slides. Premium Customer Support is available. Suitable for use by managers, employees, and organizations. These slides are easily customizable. You can edit the color, text, icon, and font size to suit your requirements.
-
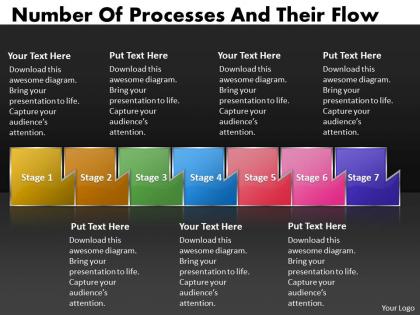 Ppt number of processes and their flow powerpoint template business templates 7 stages
The process flow diagram is easy to use and can be inserted into any PowerPoint presentation. Use this slide to detail and highlight your thought process, your views and your positive expectations.
-
 Number Of Customers Action Plans Social Media Platform Excellent Services
If you require a professional template with great design, then this Number Of Customers Action Plans Social Media Platform Excellent Services is an ideal fit for you. Deploy it to enthrall your audience and increase your presentation threshold with the right graphics, images, and structure. Portray your ideas and vision using twelve slides included in this complete deck. This template is suitable for expert discussion meetings presenting your views on the topic. With a variety of slides having the same thematic representation, this template can be regarded as a complete package. It employs some of the best design practices, so everything is well-structured. Not only this, it responds to all your needs and requirements by quickly adapting itself to the changes you make. This PPT slideshow is available for immediate download in PNG, JPG, and PDF formats, further enhancing its usability. Grab it by clicking the download button.
-
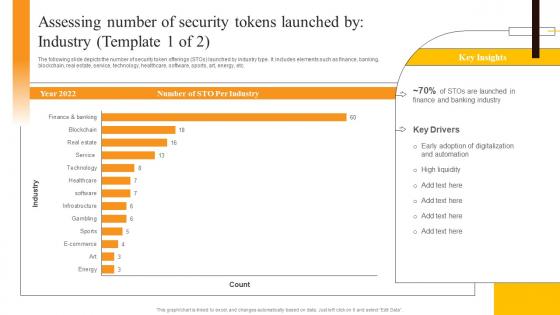 Assessing Number Of Security Tokens Launched By Industry Security Token Offerings BCT SS
The following slide depicts the number of security token offerings STOs launched by industry type. It includes elements such as finance, banking, blockchain, real estate, service, technology, healthcare, software, sports, art, energy, etc. Present the topic in a bit more detail with this Assessing Number Of Security Tokens Launched By Industry Security Token Offerings BCT SS. Use it as a tool for discussion and navigation on Assessing Number, Security Tokens, Industry. This template is free to edit as deemed fit for your organization. Therefore download it now.
-
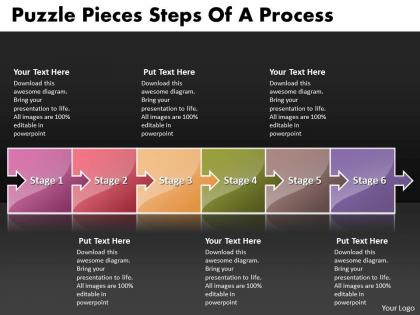 Business powerpoint templates puzzle pieces slide numbers of process sales ppt slides
This PowerPoint Diagram shows you the Homogenous way to prevent Banking losses or losses in Business related Activities. It consists of five Stages using colorful puzzle pieces.
-
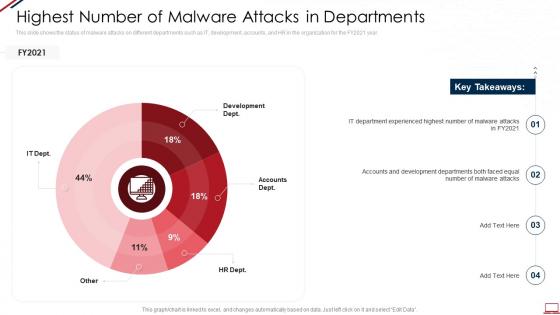 Computer system security highest number of malware attacks in departments
This slide shows the status of malware attacks on different departments such as IT, development, accounts, and HR in the organization for the FY2021 year. Present the topic in a bit more detail with this Computer System Security Highest Number Of Malware Attacks In Departments. Use it as a tool for discussion and navigation on Development Dept, Accounts Dept, HR Dept, Other, IT Dept. This template is free to edit as deemed fit for your organization. Therefore download it now.
-
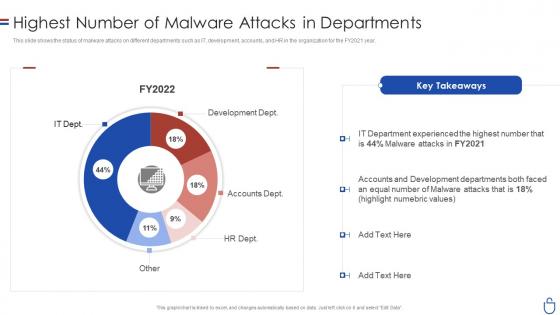 Data security it highest number of malware attacks in departments
This slide shows the status of malware attacks on different departments such as IT, development, accounts, and HR in the organization for the FY2021 year. Deliver an outstanding presentation on the topic using this Data Security IT Highest Number Of Malware Attacks In Departments. Dispense information and present a thorough explanation of Development Dept, Accounts Dept, HR Dept using the slides given. This template can be altered and personalized to fit your needs. It is also available for immediate download. So grab it now.
-
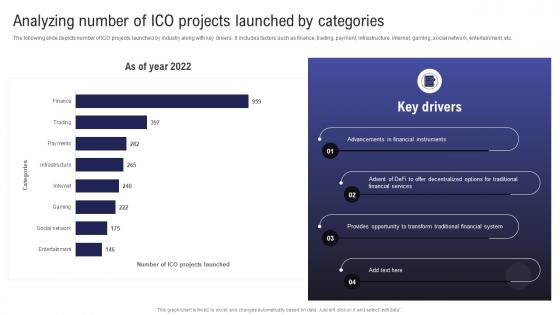 C99 Comprehensive Guide To Raise Analyzing Number Of ICO Projects Launched By Categories BCT SS
The following slide depicts number of ICO projects launched by industry along with key drivers. It includes factors such as finance, trading, payment, infrastructure, internet, gaming, social network, entertainment, etc. Present the topic in a bit more detail with this C99 Comprehensive Guide To Raise Analyzing Number Of ICO Projects Launched By Categories BCT SS Use it as a tool for discussion and navigation on ICO Projects, Launched By Categories This template is free to edit as deemed fit for your organization. Therefore download it now.
-
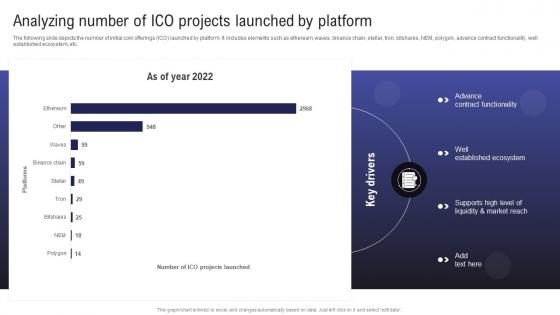 Comprehensive Guide To Raise Analyzing Number Of ICO Projects Launched By Platform BCT SS
The following slide depicts the number of initial coin offerings ICO launched by platform. It includes elements such as ethereum, waves, binance chain, stellar, tron, bitshares, NEM, polygon, advance contract functionality, well established ecosystem, etc. Deliver an outstanding presentation on the topic using this Comprehensive Guide To Raise Analyzing Number Of ICO Projects Launched By Platform BCT SS Dispense information and present a thorough explanation of Number Projects, Launched By Platform using the slides given. This template can be altered and personalized to fit your needs. It is also available for immediate download. So grab it now.
-
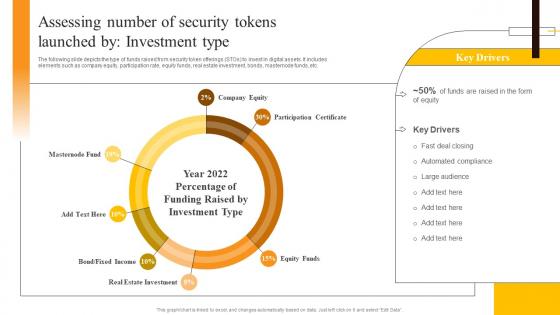 Assessing Number Of Security Tokens Launched By Investment Security Token Offerings BCT SS
The following slide depicts the type of funds raised from security token offerings STOs to invest in digital assets. It includes elements such as company equity, participation rate, equity funds, real estate investment, bonds, masternode funds, etc. Deliver an outstanding presentation on the topic using this Assessing Number Of Security Tokens Launched By Investment Security Token Offerings BCT SS. Dispense information and present a thorough explanation of Real Estate Investment, Participation Certificate, Company Equity using the slides given. This template can be altered and personalized to fit your needs. It is also available for immediate download. So grab it now.
-
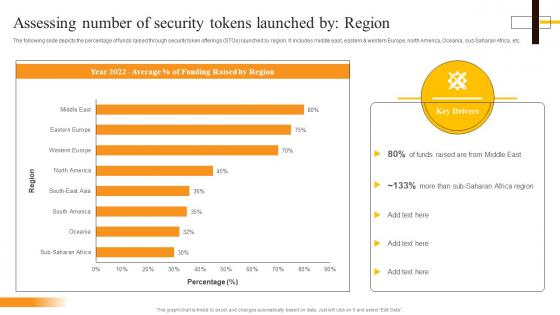 Assessing Number Of Security Tokens Launched By Region Security Token Offerings BCT SS
The following slide depicts the percentage of funds raised through security token offerings STOs launched by region. It includes middle east, eastern and western Europe, north America, Oceania, sub Saharan Africa, etc. Present the topic in a bit more detail with this Assessing Number Of Security Tokens Launched By Region Security Token Offerings BCT SS. Use it as a tool for discussion and navigation on Assessing Number, Security Tokens, Region. This template is free to edit as deemed fit for your organization. Therefore download it now.
-
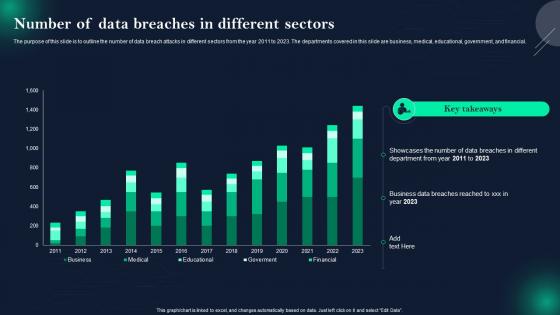 Data Breach Prevention And Mitigation Number Of Data Breaches In Different Sectors
The purpose of this slide is to outline the number of data breach attacks in different sectors from the year 2011 to 2023. The departments covered in this slide are business, medical, educational, government, and financial. Deliver an outstanding presentation on the topic using this Data Breach Prevention And Mitigation Number Of Data Breaches In Different Sectors. Dispense information and present a thorough explanation of Data Breach Attacks, Business, Medical, Educational, Government, Financial using the slides given. This template can be altered and personalized to fit your needs. It is also available for immediate download. So grab it now.
-
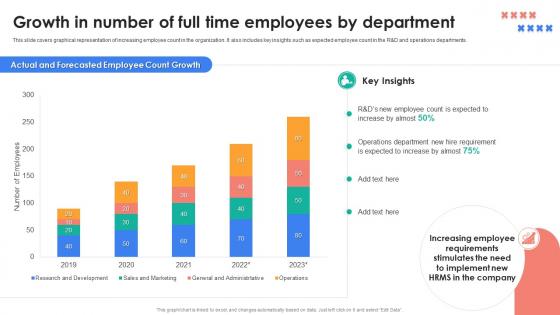 HRMS Rollout Strategy Growth In Number Of Full Time Employees By Department
This slide covers graphical representation of increasing employee count in the organization. It also includes key insights such as expected employee count in the R and D and operations departments. Present the topic in a bit more detail with this HRMS Rollout Strategy Growth In Number Of Full Time Employees By Department. Use it as a tool for discussion and navigation on Increasing Employee Requirements, Operations Department, Actual And Forecasted Employee Count Growth. This template is free to edit as deemed fit for your organization. Therefore download it now.
-
 Human Resource Management System Growth In Number Of Full Time Employees By Department
This slide covers graphical representation of increasing employee count in the organization. It also includes key insights such as expected employee count in the R and D and operations departments. Deliver an outstanding presentation on the topic using this Human Resource Management System Growth In Number Of Full Time Employees By Department. Dispense information and present a thorough explanation of Research And Development, Operations Departments, Operations Department, New Hire Requirement using the slides given. This template can be altered and personalized to fit your needs. It is also available for immediate download. So grab it now.
-
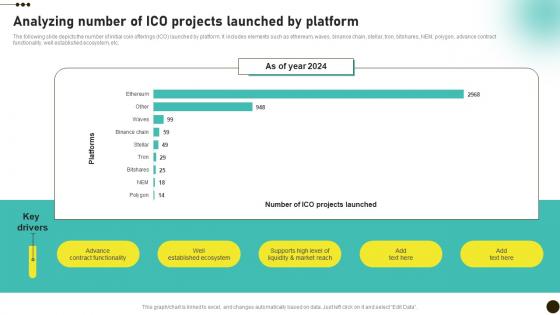 Analyzing Number Of ICO Projects Launched By Investors Initial Coin Offerings BCT SS V
The following slide depicts the number of initial coin offerings ICO launched by platform. It includes elements such as ethereum, waves, binance chain, stellar, tron, bitshares, NEM, polygon, advance contract functionality, well established ecosystem, etc. Deliver an outstanding presentation on the topic using this Analyzing Number Of ICO Projects Launched By Investors Initial Coin Offerings BCT SS V. Dispense information and present a thorough explanation of Market, Supports, Ecosystem using the slides given. This template can be altered and personalized to fit your needs. It is also available for immediate download. So grab it now.
-
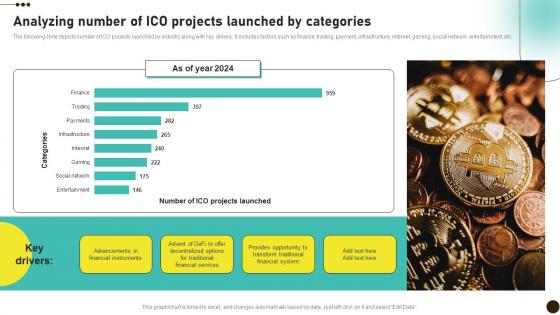 Analyzing Number Of ICO Projects Launched Investors Initial Coin Offerings BCT SS V
The following slide depicts number of ICO projects launched by industry along with key drivers. It includes factors such as finance, trading, payment, infrastructure, internet, gaming, social network, entertainment, etc. Present the topic in a bit more detail with this Analyzing Number Of ICO Projects Launched Investors Initial Coin Offerings BCT SS V. Use it as a tool for discussion and navigation on Projects, Categories, Financial. This template is free to edit as deemed fit for your organization. Therefore download it now.
-
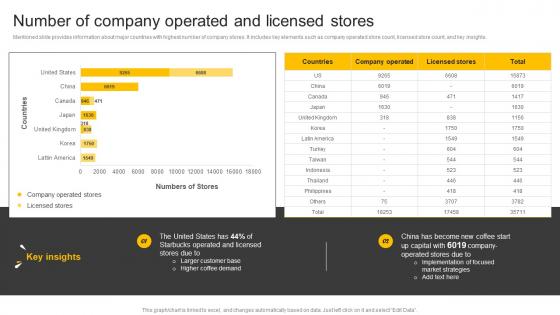 Food And Beverages Number Of Company Operated And Licensed Stores CP SS V
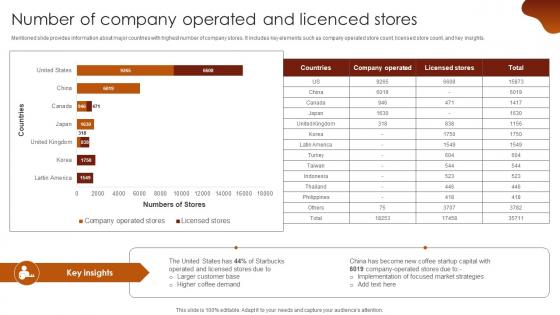
Mentioned slide provides information about major countries with highest number of company stores. It includes key elements such as company operated store count, licensed store count, and key insights. Deliver an outstanding presentation on the topic using this Food And Beverages Number Of Company Operated And Licensed Stores CP SS V Dispense information and present a thorough explanation of Larger Customer Base,Higher Coffee Demand using the slides given. This template can be altered and personalized to fit your needs. It is also available for immediate download. So grab it now.
-
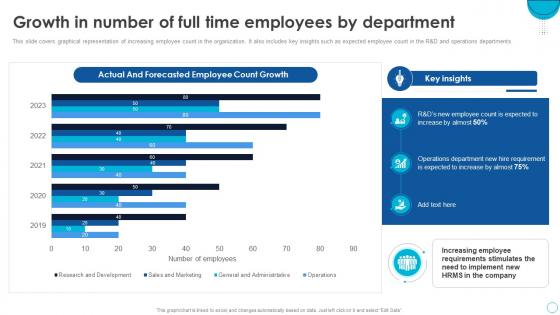 HRMS Software Implementation Plan Growth In Number Of Full Time Employees By Department
This slide covers graphical representation of increasing employee count in the organization. It also includes key insights such as expected employee count in the R and D and operations departments. Present the topic in a bit more detail with this HRMS Software Implementation Plan Growth In Number Of Full Time Employees By Department. Use it as a tool for discussion and navigation on Graphical Representation, Operations Departments, New Hire Requirement, Employee Requirements Stimulates. This template is free to edit as deemed fit for your organization. Therefore download it now.
-
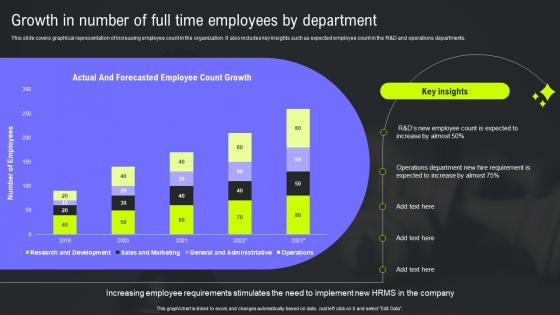 HRMS Integration Strategy Growth In Number Of Full Time Employees By Department
This slide covers graphical representation of increasing employee count in the organization. It also includes key insights such as expected employee count in the RandD and operations departments. Deliver an outstanding presentation on the topic using this HRMS Integration Strategy Growth In Number Of Full Time Employees By Department. Dispense information and present a thorough explanation of Full Time Employees By Department, Operations Departments, Graphical Representation using the slides given. This template can be altered and personalized to fit your needs. It is also available for immediate download. So grab it now.
-
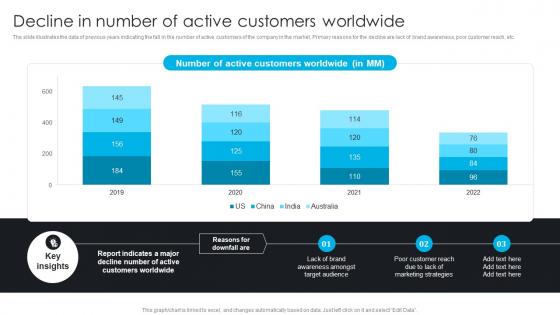 Decline In Number Of Active Customers Worldwide Comprehensive Guide To 360 Degree Marketing Strategy
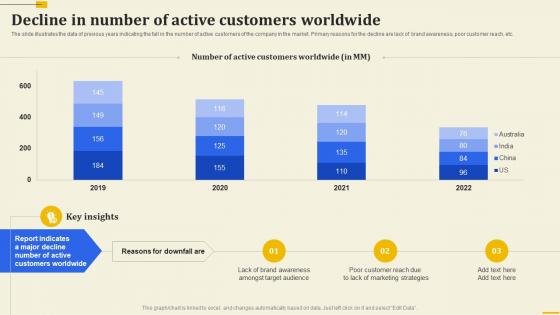
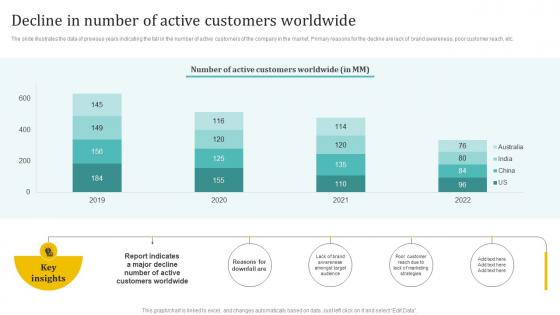
The slide illustrates the data of previous years indicating the fall in the number of active customers of the company in the market. Primary reasons for the decline are lack of brand awareness, poor customer reach, etc. Deliver an outstanding presentation on the topic using this Decline In Number Of Active Customers Worldwide Comprehensive Guide To 360 Degree Marketing Strategy Dispense information and present a thorough explanation of Target Audience, Marketing Strategies, Poor Customer using the slides given. This template can be altered and personalized to fit your needs. It is also available for immediate download. So grab it now.
-
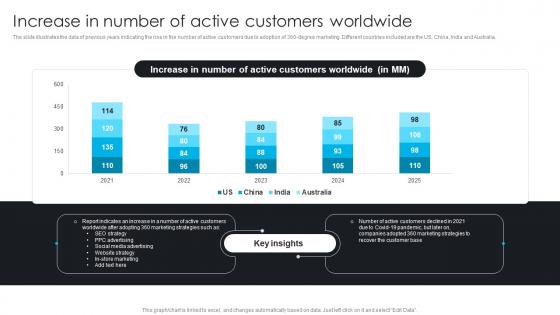 Increase In Number Of Active Customers Worldwide Comprehensive Guide To 360 Degree Marketing Strategy
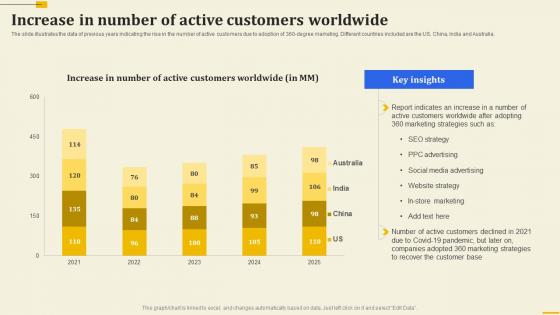
The slide illustrates the data of previous years indicating the rise in the number of active customers due to adoption of 360 degree marketing. Different countries included are the US, China, India and Australia. Deliver an outstanding presentation on the topic using this Increase In Number Of Active Customers Worldwide Comprehensive Guide To 360 Degree Marketing Strategy Dispense information and present a thorough explanation of SEO Strategy, PPC Advertising, Social Media Advertising using the slides given. This template can be altered and personalized to fit your needs. It is also available for immediate download. So grab it now.
-
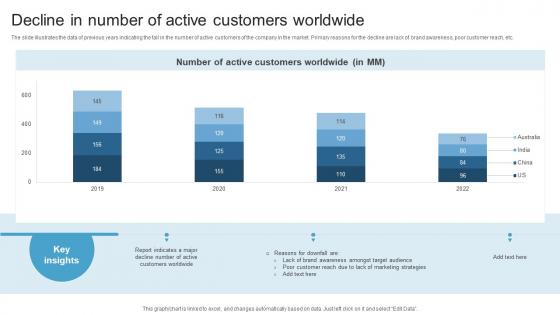 Decline In Number Of Active Customers Worldwide Maximizing ROI With A 360 Degree
The slide illustrates the data of previous years indicating the fall in the number of active customers of the company in the market. Primary reasons for the decline are lack of brand awareness, poor customer reach, etc. Deliver an outstanding presentation on the topic using this Decline In Number Of Active Customers Worldwide Maximizing ROI With A 360 Degree. Dispense information and present a thorough explanation of Decline In Number, Active Customers Worldwide using the slides given. This template can be altered and personalized to fit your needs. It is also available for immediate download. So grab it now.
-
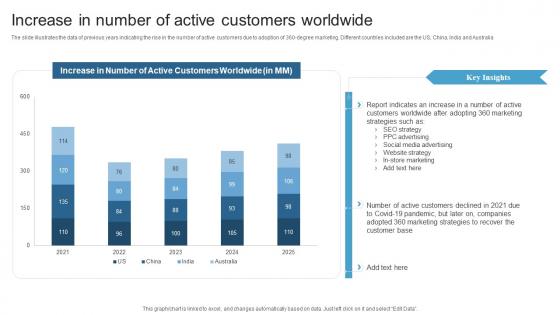 Increase In Number Of Active Customers Worldwide Maximizing ROI With A 360 Degree
The slide illustrates the data of previous years indicating the rise in the number of active customers due to adoption of 360-degree marketing. Different countries included are the US, China, India and Australia. Present the topic in a bit more detail with this Increase In Number Of Active Customers Worldwide Maximizing ROI With A 360 Degree. Use it as a tool for discussion and navigation on Increase In Number, Active Customers Worldwide. This template is free to edit as deemed fit for your organization. Therefore download it now.
-
 Number Of Identity Fraud Incidents Reported Globally Blockchain Role In Education BCT SS
This slide covers increasing number of fraudulent activities related to identity verification various industries such as fintech, banking and educational institutions, etc. It also includes key insights on most affected sectors utilizing verification of digital credentials as major part of operations in these industries. Present the topic in a bit more detail with this Number Of Identity Fraud Incidents Reported Globally Blockchain Role In Education BCT SS Use it as a tool for discussion and navigation on Number Of Identity, Fraud Incidents, Reported Globally This template is free to edit as deemed fit for your organization. Therefore download it now.
-
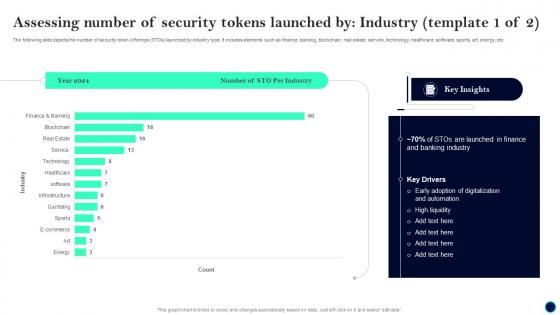 Assessing Number Of Security Beginners Guide To Successfully Launch Security Token BCT SS V
The following slide depicts the number of security token offerings STOs launched by industry type. It includes elements such as finance, banking, blockchain, real estate, service, technology, healthcare, software, sports, art, energy, etc. Present the topic in a bit more detail with this Assessing Number Of Security Beginners Guide To Successfully Launch Security Token BCT SS V. Use it as a tool for discussion and navigation on Sto Per Industry, Banking Industry, Key Insights. This template is free to edit as deemed fit for your organization. Therefore download it now.
-
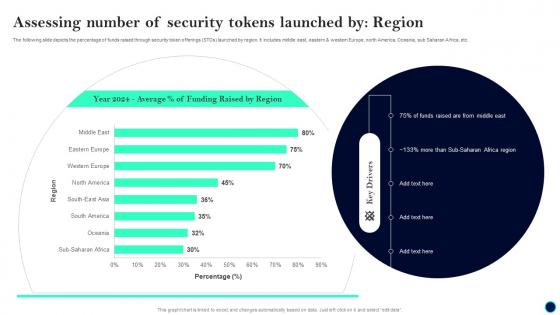 Assessing Number Of Security Tokens Beginners Guide To Successfully Launch Security Token BCT SS V
The following slide depicts the percentage of funds raised through security token offerings STOs launched by region. It includes middle east, eastern and western Europe, north America, Oceania, sub Saharan Africa, etc. Deliver an outstanding presentation on the topic using this Assessing Number Of Security Tokens Beginners Guide To Successfully Launch Security Token BCT SS V. Dispense information and present a thorough explanation of Assessing Number, Security Tokens Launched, Region using the slides given. This template can be altered and personalized to fit your needs. It is also available for immediate download. So grab it now.
-
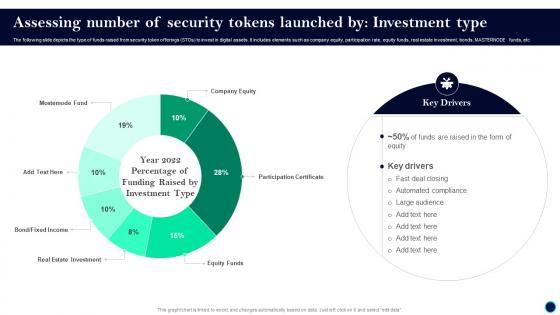 Beginners Guide To Successfully Launch Security Token Assessing Number Of Security BCT SS V
The following slide depicts the type of funds raised from security token offerings STOs to invest in digital assets. It includes elements such as company equity, participation rate, equity funds, real estate investment, bonds, MASTERNODE funds, etc. Present the topic in a bit more detail with this Beginners Guide To Successfully Launch Security Token Assessing Number Of Security BCT SS V. Use it as a tool for discussion and navigation on Key Drivers, Deal Closing, Automated Compliance. This template is free to edit as deemed fit for your organization. Therefore download it now.
-
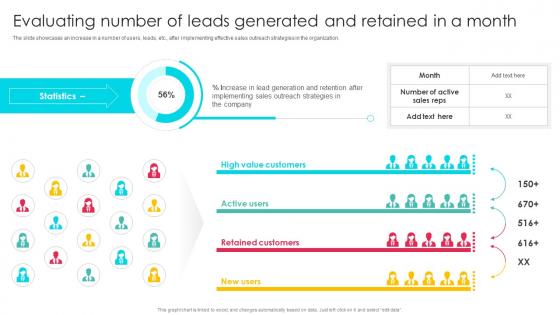 Evaluating Number Of Leads Sales Outreach Strategies For Effective Lead Generation
The slide showcases an increase in a number of users, leads, etc., after implementing effective sales outreach strategies in the organization. Present the topic in a bit more detail with this Evaluating Number Of Leads Sales Outreach Strategies For Effective Lead Generation. Use it as a tool for discussion and navigation on Statistics, Sales Outreach Strategies, Retained Customers. This template is free to edit as deemed fit for your organization. Therefore download it now.
-
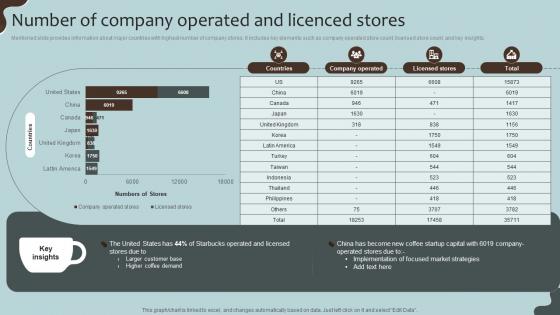 Number Of Company Operated Coffee House Company Profile CP SS V
Mentioned slide provides information about major countries with highest number of company stores. It includes key elements such as company operated store count, licensed store count, and key insights. Present the topic in a bit more detail with this Number Of Company Operated Coffee House Company Profile CP SS V. Use it as a tool for discussion and navigation on Key Insights, Market Strategies, New Coffee Startup. This template is free to edit as deemed fit for your organization. Therefore download it now.
-
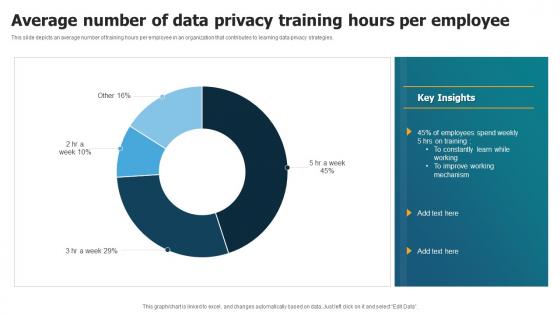 Average Number Of Data Privacy Training Hours Per Employee
This slide depicts an average number of training hours per employee in an organization that contributes to learning data privacy strategies. Introducing our Average Number Of Data Privacy Training Hours Per Employee set of slides. The topics discussed in these slides are Average Number, Training Hours Per Employee. This is an immediately available PowerPoint presentation that can be conveniently customized. Download it and convince your audience.
-
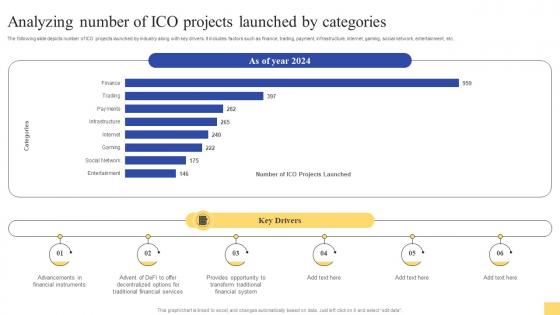 Analyzing Number Of ICO Projects Launched Ultimate Guide For Initial Coin Offerings BCT SS V
The following slide depicts number of ICO projects launched by industry along with key drivers. It includes factors such as finance, trading, payment, infrastructure, internet, gaming, social network, entertainment, etc. Deliver an outstanding presentation on the topic using this Analyzing Number Of ICO Projects Launched Ultimate Guide For Initial Coin Offerings BCT SS V. Dispense information and present a thorough explanation of Financial Instruments, Financial Services, Financial System using the slides given. This template can be altered and personalized to fit your needs. It is also available for immediate download. So grab it now.
-
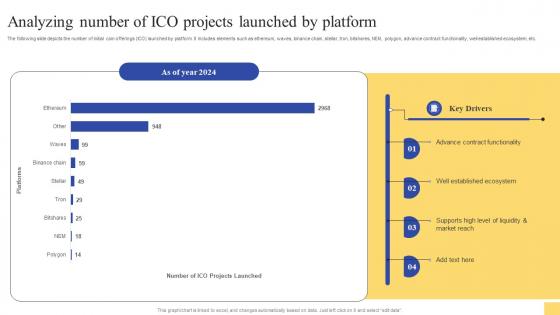 Analyzing Number Of ICO Projects Ultimate Guide For Initial Coin Offerings BCT SS V
The following slide depicts the number of initial coin offerings ICO launched by platform. It includes elements such as ethereum, waves, binance chain, stellar, tron, bitshares, NEM, polygon, advance contract functionality, well established ecosystem, etc. Present the topic in a bit more detail with this Analyzing Number Of ICO Projects Ultimate Guide For Initial Coin Offerings BCT SS V. Use it as a tool for discussion and navigation on Key Drivers, Ecosystem, market reach. This template is free to edit as deemed fit for your organization. Therefore download it now.
-
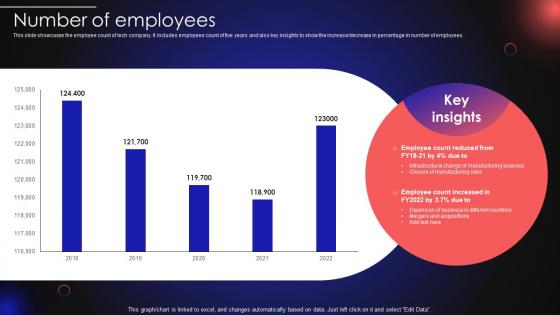 Tech Company Profile Number Of Employees Ppt Summary CP SS
This slide showcases the employee count of tech company. It includes employees count of five years and also key insights to show the increase decrease in percentage in number of employees. Deliver an outstanding presentation on the topic using this Tech Company Profile Number Of Employees Ppt Summary CP SS. Dispense information and present a thorough explanation of Number Of Employees using the slides given. This template can be altered and personalized to fit your needs. It is also available for immediate download. So grab it now.
-
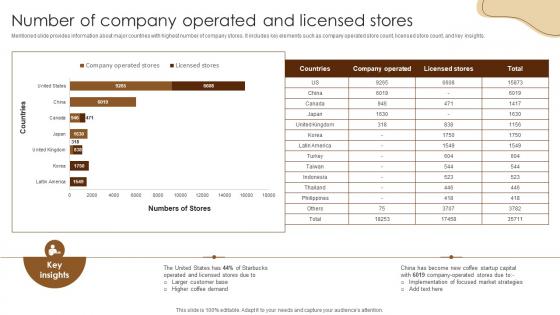 Number Of Company Operated And Coffee Business Company Profile CP SS V
Mentioned slide provides information about major countries with highest number of company stores. It includes key elements such as company operated store count, licensed store count, and key insights. Deliver an outstanding presentation on the topic using this Number Of Company Operated And Coffee Business Company Profile CP SS V. Dispense information and present a thorough explanation of Customer, Operated, Market using the slides given. This template can be altered and personalized to fit your needs. It is also available for immediate download. So grab it now.
-
 Decline In Number Of Active Customers Worldwide Implementation Of 360 Degree Marketing
The slide illustrates the data of previous years indicating the fall in the number of active customers of the company in the market. Primary reasons for the decline are lack of brand awareness, poor customer reach, etc. Present the topic in a bit more detail with this Decline In Number Of Active Customers Worldwide Implementation Of 360 Degree Marketing. Use it as a tool for discussion and navigation on Decline In Number, Active Customers Worldwide. This template is free to edit as deemed fit for your organization. Therefore download it now.
-
 Increase In Number Of Active Customers Worldwide Implementation Of 360 Degree Marketing
The slide illustrates the data of previous years indicating the rise in the number of active customers due to adoption of 360-degree marketing. Different countries included are the US, China, India and Australia. Present the topic in a bit more detail with this Increase In Number Of Active Customers Worldwide Implementation Of 360 Degree Marketing. Use it as a tool for discussion and navigation on Increase In Number, Active Customers Worldwide. This template is free to edit as deemed fit for your organization. Therefore download it now.
-
 Number Of Company Operated And Licenced Stores Luxury Coffee Brand Company Profile CP SS V
Mentioned slide provides information about major countries with highest number of company stores. It includes key elements such as company operated store count, licensed store count, and key insights. Present the topic in a bit more detail with this Number Of Company Operated And Licenced Stores Luxury Coffee Brand Company Profile CP SS V. Use it as a tool for discussion and navigation on Number Of Company Operated, Licenced Stores. This template is free to edit as deemed fit for your organization. Therefore download it now.
-
 Increase In Number Of Online Appointment Bookings Online And Offline Marketing Plan For Hospitals
This slide represents the positive impact of marketing strategies such as website marketing, SEO strategy, content marketing, etc. on the online booking appointments of the hospital. Present the topic in a bit more detail with this Increase In Number Of Online Appointment Bookings Online And Offline Marketing Plan For Hospitals. Use it as a tool for discussion and navigation on Increase In Number, Online Appointment Bookings. This template is free to edit as deemed fit for your organization. Therefore download it now.
-
 Decline In Number Of Active Customers Holistic Approach To 360 Degree Marketing
The slide illustrates the data of previous years indicating the fall in the number of active customers of the company in the market. Primary reasons for the decline are lack of brand awareness, poor customer reach, etc. Present the topic in a bit more detail with this Decline In Number Of Active Customers Holistic Approach To 360 Degree Marketing. Use it as a tool for discussion and navigation on Active, Worldwide, Customers. This template is free to edit as deemed fit for your organization. Therefore download it now.
-
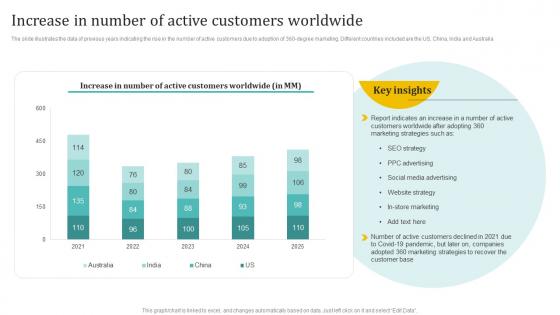 Increase In Number Of Active Customers Holistic Approach To 360 Degree Marketing
The slide illustrates the data of previous years indicating the rise in the number of active customers due to adoption of 360 degree marketing. Different countries included are the US, China, India and Australia Present the topic in a bit more detail with this Increase In Number Of Active Customers Holistic Approach To 360 Degree Marketing. Use it as a tool for discussion and navigation on Number, Customers, Worldwide. This template is free to edit as deemed fit for your organization. Therefore download it now.
-
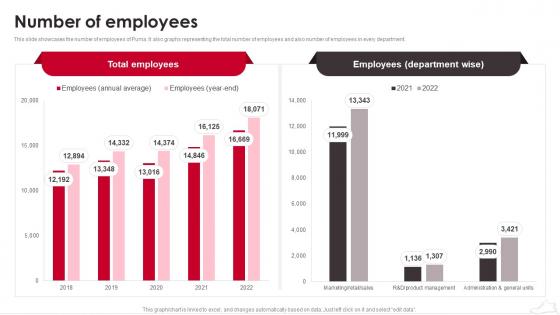 Puma Company Profile Number Of Employees Ppt Graphics CP SS
This slide showcases the number of employees of Puma. It also graphs representing the total number of employees and also number of employees in every department. Present the topic in a bit more detail with this Puma Company Profile Number Of Employees Ppt Graphics CP SS. Use it as a tool for discussion and navigation on Number Of Employees. This template is free to edit as deemed fit for your organization. Therefore download it now.
-
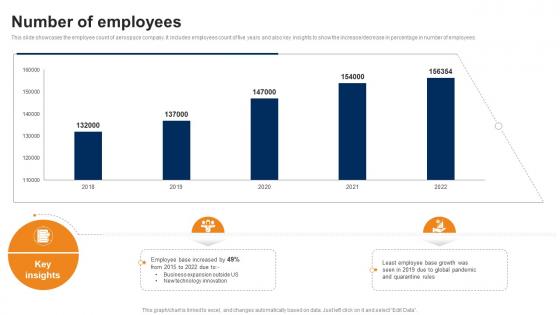 Number Of Employees Manufacturing Company Profile CP SS
This slide showcases the employee count of aerospace company. It includes employees count of five years and also key insights to show the increase and decrease in percentage in number of employees. Present the topic in a bit more detail with this Number Of Employees Manufacturing Company Profile CP SS. Use it as a tool for discussion and navigation on Number Of Employees. This template is free to edit as deemed fit for your organization. Therefore download it now.
-
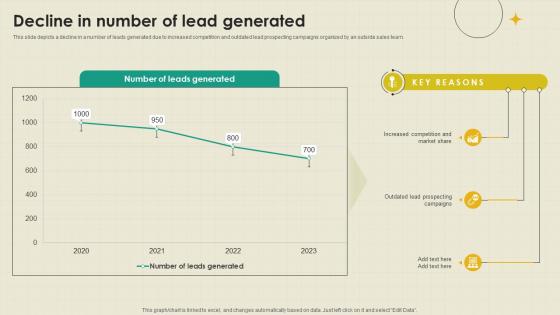 Decline In Number Of Lead Generated B2B Outside Sales Strategy Development SA SS
This slide depicts a decline in a number of leads generated due to increased competition and outdated lead prospecting campaigns organized by an outside sales team. Deliver an outstanding presentation on the topic using this Decline In Number Of Lead Generated B2B Outside Sales Strategy Development SA SS. Dispense information and present a thorough explanation of Market Share, Outdated Lead, Prospecting Campaigns using the slides given. This template can be altered and personalized to fit your needs. It is also available for immediate download. So grab it now.
-
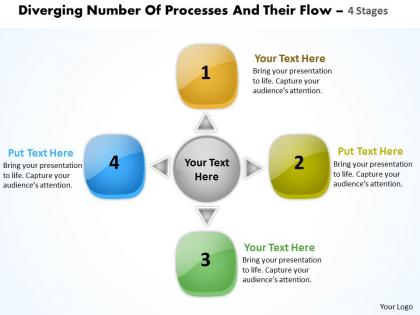 Diverging number of processes and their flow 4 stages circular diagram powerpoint templates
We are proud to present our diverging number of processes and their flow 4 stages circular diagram powerpoint templates. This type of chart is useful when showing how items are associated with a central idea. Use this template to highlight the key issues of your presentation.
-
 Content Marketing To Generate Maximum Number Of Leads Implementing Outbound MKT SS
This slide covers overview to content marketing which helps in enhancing lead generation for businesses. It involves different types such as online, blog, podcasts and paid ad content marketing. Introducing Content Marketing To Generate Maximum Number Of Leads Implementing Outbound MKT SS to increase your presentation threshold. Encompassed with four stages, this template is a great option to educate and entice your audience. Dispence information on Introduction, Content Marketing, Businesses, using this template. Grab it now to reap its full benefits.
-
 Number Of Connected Iot Devices Illustrations
This PowerPoint icon illustrates the number of connected IoT devices worldwide. It features a colourful bar graph, with a range of hues to represent different levels of connected devices. Perfect for presentations on the growth of the IoT industry.
-
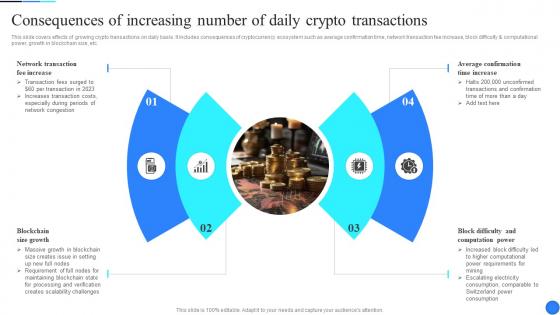 Consequences Of Increasing Number Of Comprehensive Guide To Blockchain Scalability BCT SS
This slide covers effects of growing crypto transactions on daily basis. It includes consequences of cryptocurrency ecosystem such as average confirmation time, network transaction fee increase, block difficulty and computational power, growth in blockchain size, etc. Increase audience engagement and knowledge by dispensing information using Consequences Of Increasing Number Of Comprehensive Guide To Blockchain Scalability BCT SS. This template helps you present information on four stages. You can also present information on Blockchain Size Growth, Block Difficulty And Computation Power, Average Confirmation Time Increase using this PPT design. This layout is completely editable so personaize it now to meet your audiences expectations.
-
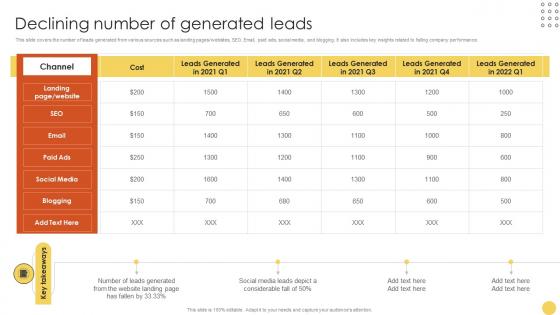 Declining Number Of Generated Leads Advanced Lead Generation Tactics Strategy SS V
This slide covers the number of leads generated from various sources such as landing pages websites, SEO, Email, paid ads, social media, and blogging. It also includes key insights related to falling company performance. Present the topic in a bit more detail with this Declining Number Of Generated Leads Advanced Lead Generation Tactics Strategy SS V. Use it as a tool for discussion and navigation on Website, Considerable, Generated. This template is free to edit as deemed fit for your organization. Therefore download it now.
-
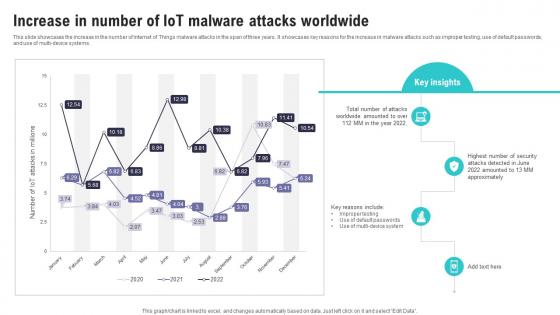 Increase In Number Of IoT Malware Attacks Worldwide IoT Security And Privacy Safeguarding IoT SS
This slide showcases the increase in the number of Internet of Things malware attacks in the span of three years. It showcases key reasons for the increase in malware attacks such as improper testing, use of default passwords, and use of multi device systems. Present the topic in a bit more detail with this Increase In Number Of IoT Malware Attacks Worldwide IoT Security And Privacy Safeguarding IoT SS. Use it as a tool for discussion and navigation on Worldwide Amounted, Default Passwords, Attacks Detected. This template is free to edit as deemed fit for your organization. Therefore download it now.
-
 Numbers 13 28 we even saw descendants of anak powerpoint church sermon
We are proud to present our numbers 13 28 we even saw descendants of anak powerpoint church sermon. Urge them to be more forgiving with our Numbers 13.28 Get them acquainted with the Divine. Teach them forgiveness with our Courage PowerPoint sermon slides for pastors. Convince them of its great virtue. Numbers 13.28 But the people who live there are powerful, and the cities are fortified and very large. We even saw descendants of Anak there.
-
 Numbers 22 24 the angel of the lord stood powerpoint church sermon
We are proud to present our numbers 22 24 the angel of the lord stood powerpoint church sermon. Numbers 22.24 Then the angel of the LORD stood in a narrow path through the vineyards, with walls on both sides. Acquaint them with the symbols of the Church with our Numbers 22.24. They will absorb the deeper meaning. Meaning of symbols become clearer with our Path PowerPoint sermon slides for pastors. They understand their relevance to the Church.
-
 0514 acts 61 the number of the disciples powerpoint church sermon
We are proud to present our 0514 acts 61 the number of the disciples powerpoint church sermon. Acts 6.1 In those days when the number of disciples was increasing, the Hellenistic Jews among them complained against the Hebraic Jews because their widows were being overlooked in the daily distribution of food. Hail the Glorious with our Acts 61. Extol the brilliance of His creation. Extol the Glorious with our Time PowerPoint sermon slides for pastors. Hail His brilliant creation.
-
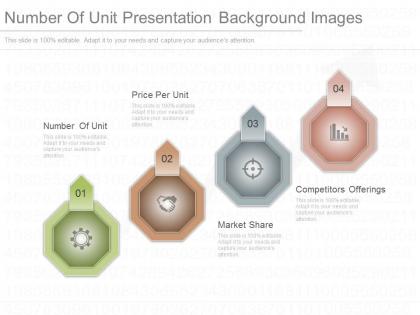 Number of unit presentation background images
Presenting number of unit presentation background images. This is a number of unit presentation background images. This is a four stage process. The stages in this process are number of unit, price per unit, market share, competitors offerings.
-
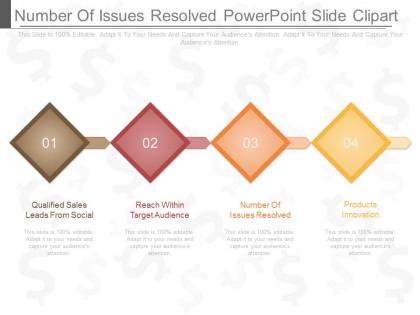 Number of issues resolved powerpoint slide clipart
Presenting number of issues resolved powerpoint slide clipart. This is a number of issues resolved powerpoint slide clipart. This is a four stage process. The stages in this process are qualified sales leads from social, reach within target audience, number of issues resolved, products innovation.
-
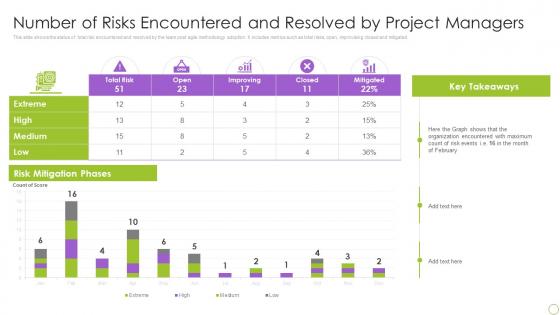 Number Of Risks Encountered And Resolved By Project Managers Ppt Portfolio
Present the topic in a bit more detail with this Number Of Risks Encountered And Resolved By Project Managers Ppt Portfolio. Use it as a tool for discussion and navigation on Percent Change In Workplace Productivity Post Adoption. This template is free to edit as deemed fit for your organization. Therefore download it now.


