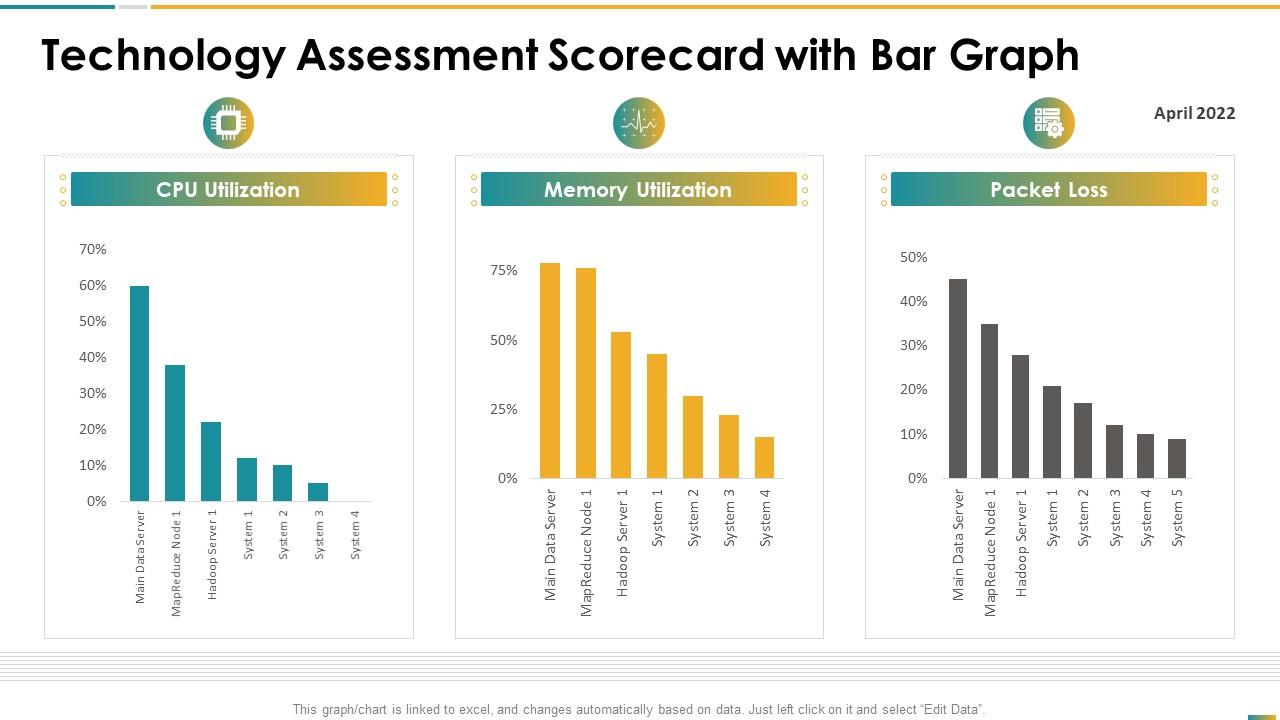
Technology assessment scorecard with bar graph ppt slides image
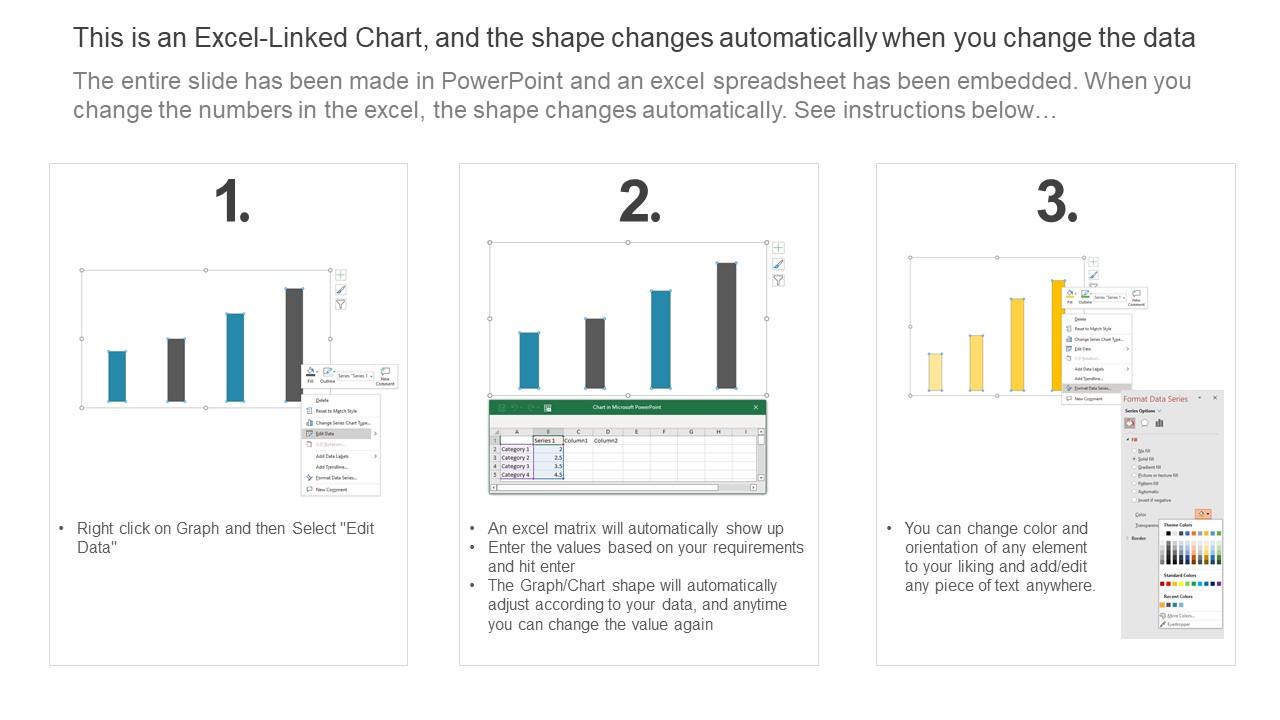
This graph or chart is linked to excel, and changes automatically based on data. Just left click on it and select Edit Data.
This graph or chart is linked to excel, and changes automatically based on data. Just left click on it and select Edit Data.
- Google Slides is a new FREE Presentation software from Google.
- All our content is 100% compatible with Google Slides.
- Just download our designs, and upload them to Google Slides and they will work automatically.
- Amaze your audience with SlideTeam and Google Slides.
-
Want Changes to This PPT Slide? Check out our Presentation Design Services
- WideScreen Aspect ratio is becoming a very popular format. When you download this product, the downloaded ZIP will contain this product in both standard and widescreen format.
-

- Some older products that we have may only be in standard format, but they can easily be converted to widescreen.
- To do this, please open the SlideTeam product in Powerpoint, and go to
- Design ( On the top bar) -> Page Setup -> and select "On-screen Show (16:9)” in the drop down for "Slides Sized for".
- The slide or theme will change to widescreen, and all graphics will adjust automatically. You can similarly convert our content to any other desired screen aspect ratio.
Compatible With Google Slides

Get This In WideScreen
You must be logged in to download this presentation.
PowerPoint presentation slides
This graph or chart is linked to excel, and changes automatically based on data. Just left click on it and select Edit Data. Present the topic in a bit more detail with this Technology Assessment Scorecard With Bar Graph Ppt Slides Image. Use it as a tool for discussion and navigation on CPU Utilization, Memory Utilization, Packet Loss. This template is free to edit as deemed fit for your organization. Therefore download it now.
People who downloaded this PowerPoint presentation also viewed the following :
Technology assessment scorecard with bar graph ppt slides image with all 7 slides:
Use our Technology Assessment Scorecard With Bar Graph Ppt Slides Image to effectively help you save your valuable time. They are readymade to fit into any presentation structure.
-
Excellent template with unique design.
-
Informative presentations that are easily editable.


