Implementation of artificial intelligence powerpoint presentation slides
Introducing Implementation Of Artificial Intelligence PowerPoint Presentation Slides. The presentation contains various templates like business intelligence market overview, architecture framework, data design, data integration design, BI design, advanced final output results, KPI metrics, and dashboards. Other important information like industries that use BI and critical drivers is also depicted in our artificial intelligence PPT deck. Display valuable business insights with the help of our professionally designed operational intelligence PPT slideshow. This commercial intelligence presentation aptly showcases how BI assists in developing business. You can convey your BI design and implementation in a compact manner with our handy business intelligence PowerPoint diagrams. Take the assistance of industrial AI PPT layouts to demonstrate sophisticated subjects like information architecture and dimensional modeling easily. This integrated business planning PowerPoint theme also sheds light on advanced analytics techniques and methods. Download the artificial intelligence PowerPoint slideshow to represent your plan to expand business horizons.
Introducing Implementation Of Artificial Intelligence PowerPoint Presentation Slides. The presentation contains various tem..
- Google Slides is a new FREE Presentation software from Google.
- All our content is 100% compatible with Google Slides.
- Just download our designs, and upload them to Google Slides and they will work automatically.
- Amaze your audience with SlideTeam and Google Slides.
-
Want Changes to This PPT Slide? Check out our Presentation Design Services
- WideScreen Aspect ratio is becoming a very popular format. When you download this product, the downloaded ZIP will contain this product in both standard and widescreen format.
-

- Some older products that we have may only be in standard format, but they can easily be converted to widescreen.
- To do this, please open the SlideTeam product in Powerpoint, and go to
- Design ( On the top bar) -> Page Setup -> and select "On-screen Show (16:9)” in the drop down for "Slides Sized for".
- The slide or theme will change to widescreen, and all graphics will adjust automatically. You can similarly convert our content to any other desired screen aspect ratio.
Compatible With Google Slides

Get This In WideScreen
You must be logged in to download this presentation.
PowerPoint presentation slides
It has PPT slides covering wide range of topics showcasing all the core areas of your business needs. This complete deck focuses on Implementation Of Artificial Intelligence Powerpoint Presentation Slides and consists of professionally designed templates with suitable graphics and appropriate content. This deck has total of fifty six slides. Our designers have created customizable templates for your convenience. You can make the required changes in the templates like colour, text and font size. Other than this, content can be added or deleted from the slide as per the requirement. Get access to this professionally designed complete deck PPT presentation by clicking the download button below.
People who downloaded this PowerPoint presentation also viewed the following :
Content of this Powerpoint Presentation
Slide 1: This slide introduces Implementation of Artificial Intelligence. State Your Company Name and begin.
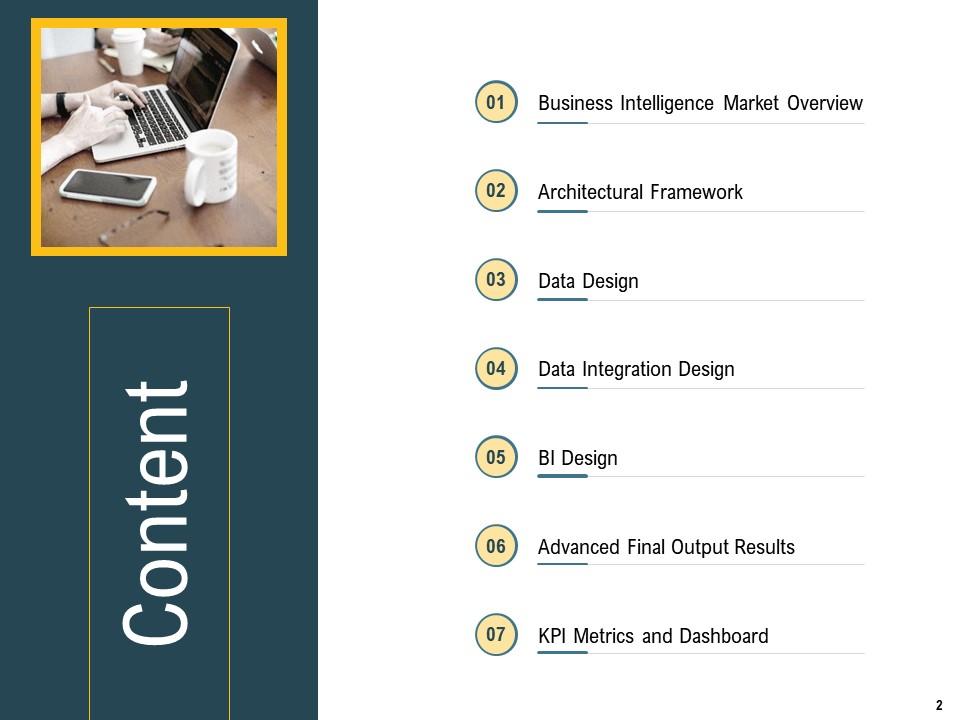
Slide 2: This slide shows Content describing- Business Intelligence Market Overview, Architectural Framework, Data Design, etc.
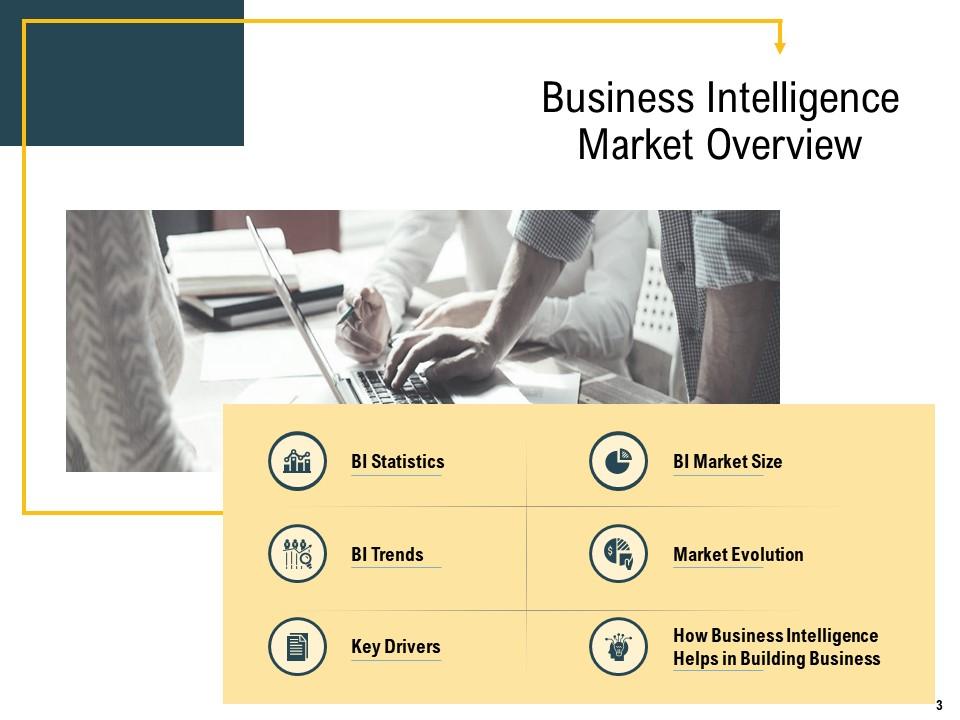
Slide 3: This slide shows Business Intelligence Market Overview.
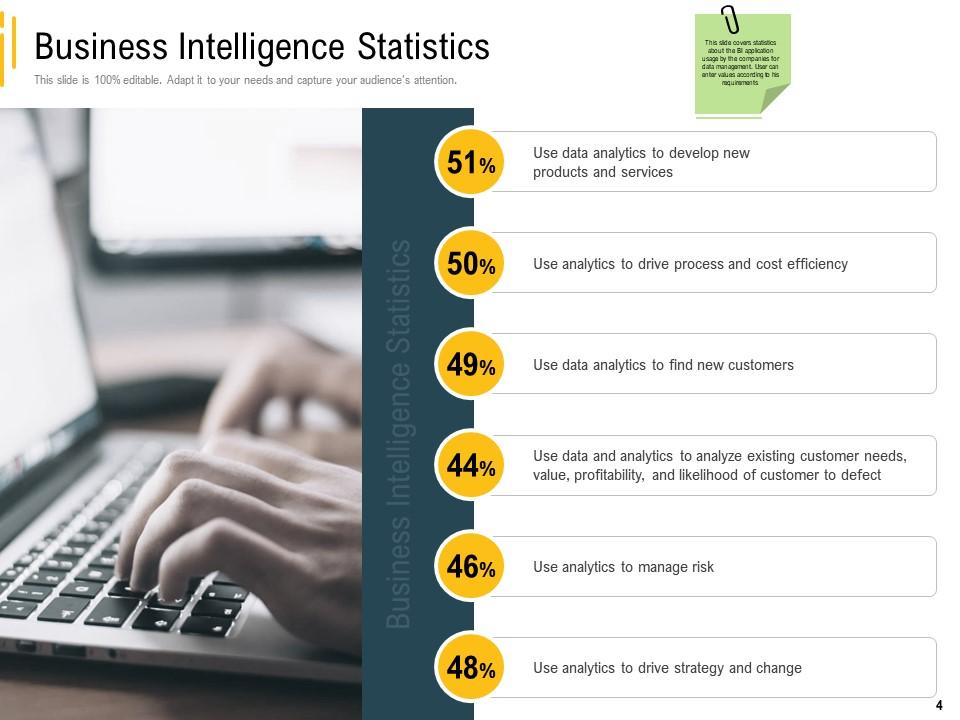
Slide 4: This slide covers statistics about the BI application usage by the companies for data management.
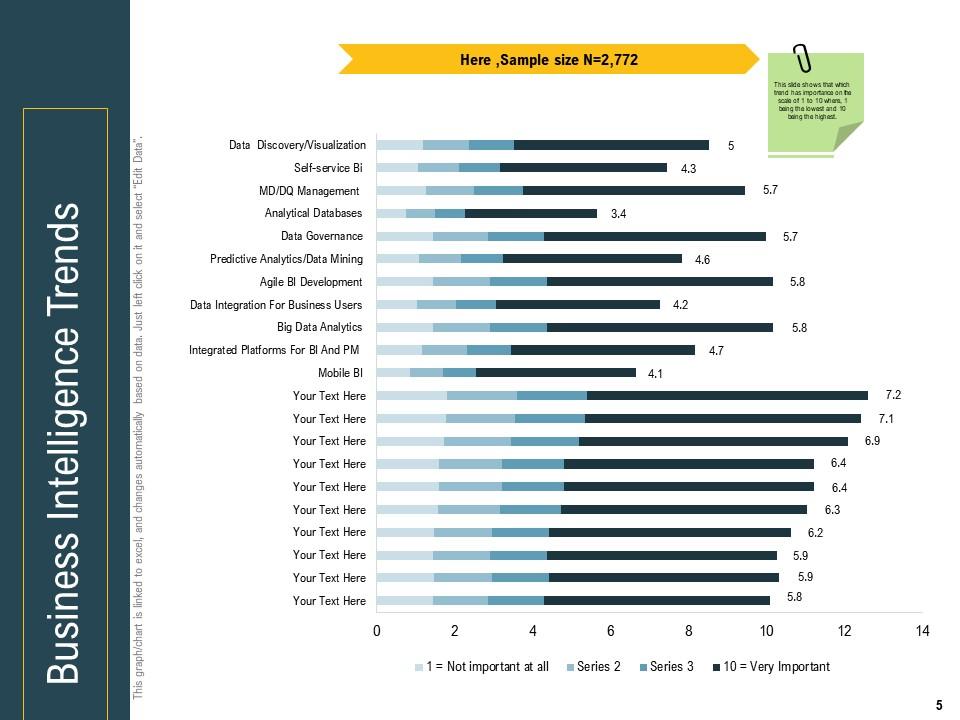
Slide 5: This slide presents that which trend has importance on the scale of 1 to 10 where, 1 being the lowest and 10 being the highest.
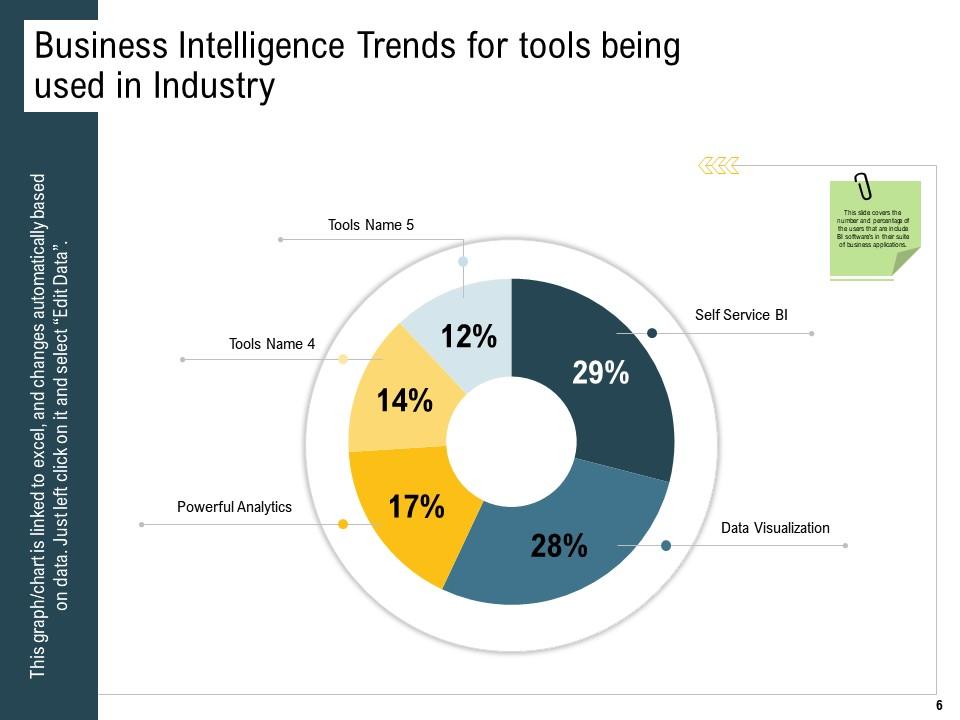
Slide 6: This slide covers the number and percentage of the users that are include BI software’s in their suite of business applications.
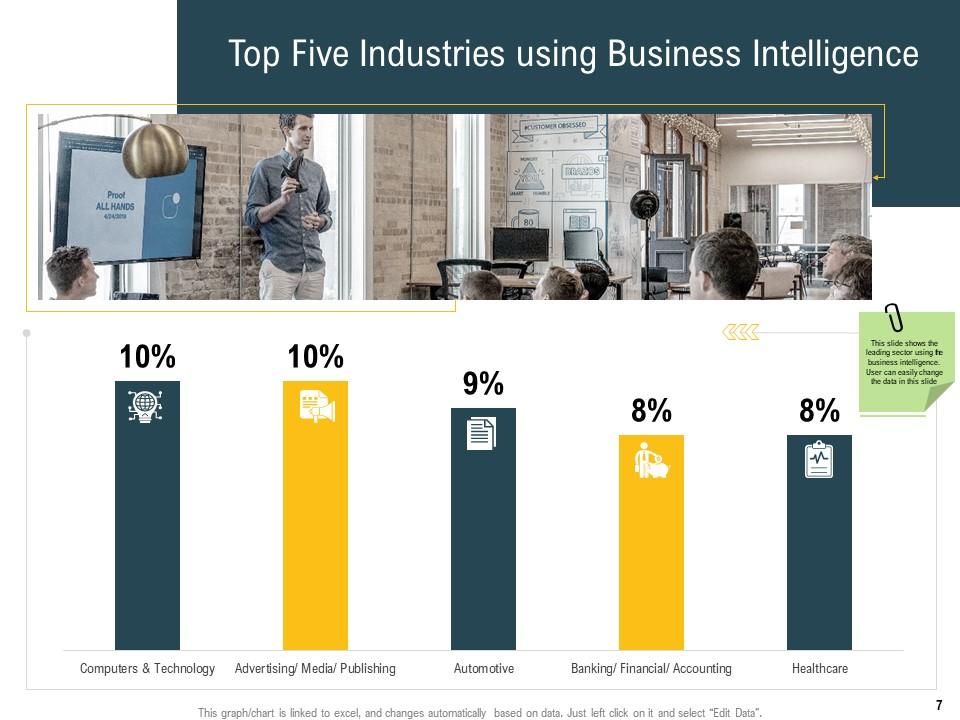
Slide 7: This slide displays the leading sector using the business intelligence. User can easily change the data in this slide
Slide 8: This slide represents Key Drivers with related icons.
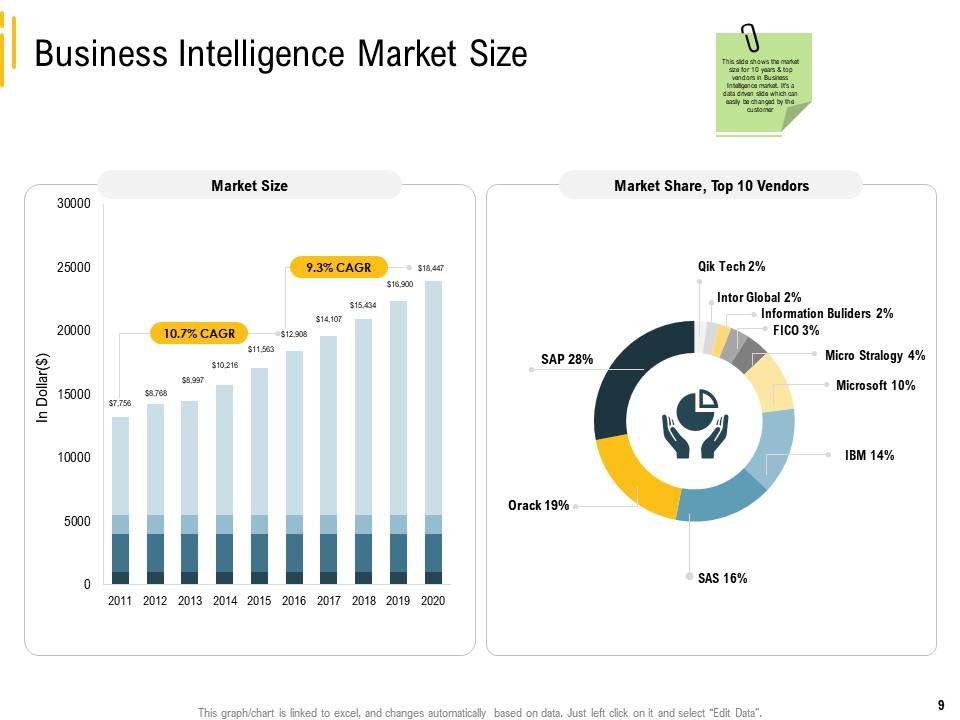
Slide 9: This slide showcases the market size for 10 years & top vendors in Business Intelligence market. It’s a data driven slide which can easily be changed by the customer
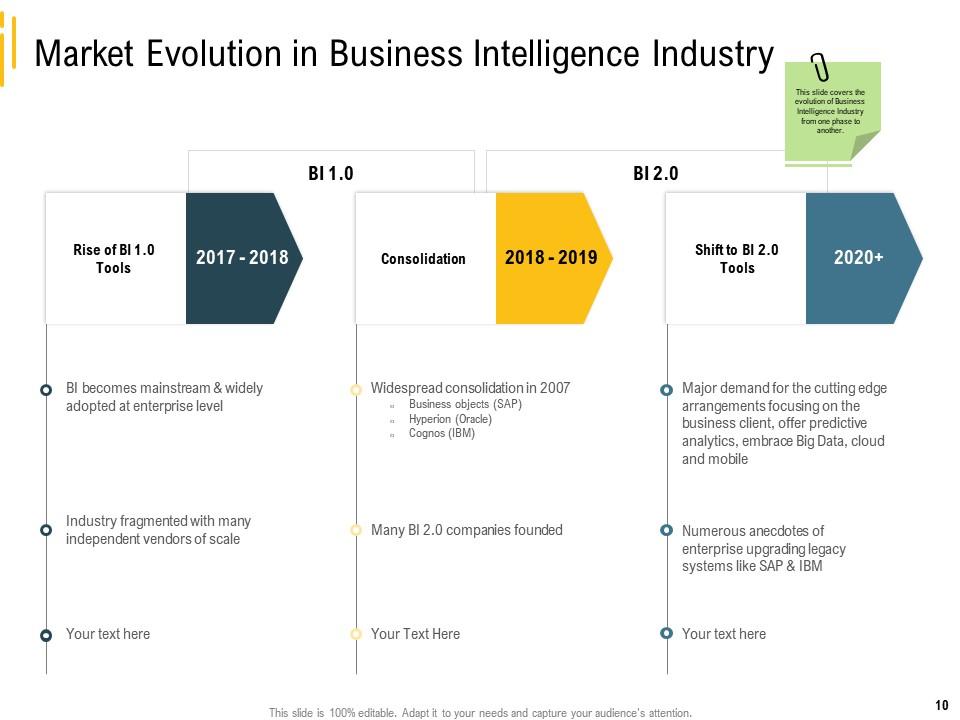
Slide 10: This slide covers the evolution of Business Intelligence Industry from one phase to another.
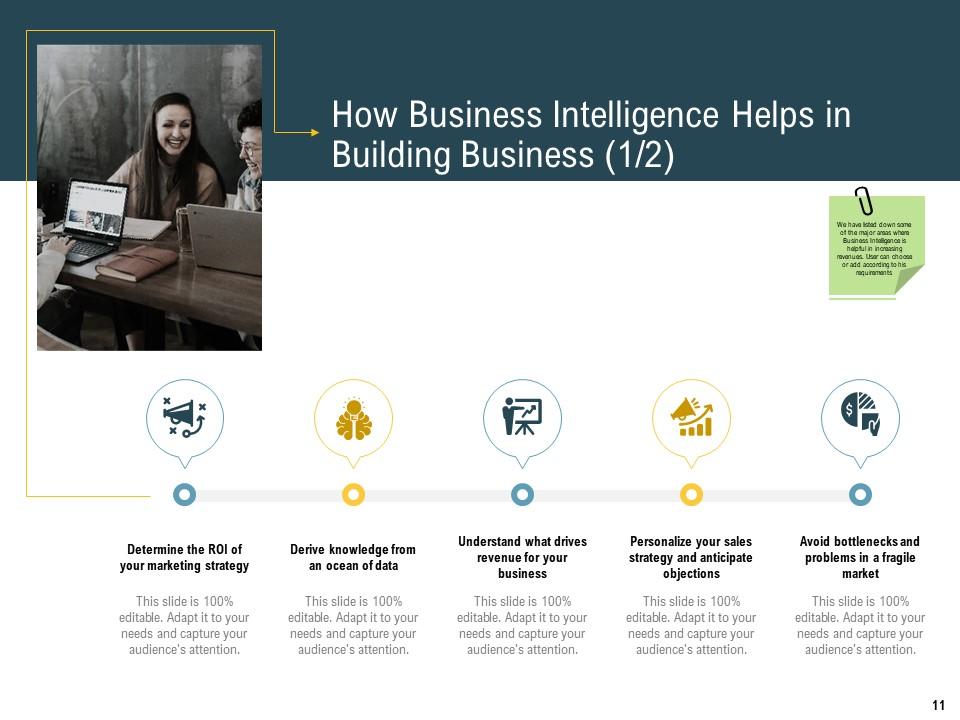
Slide 11: This slide shows How Business Intelligence Helps in Building Business.
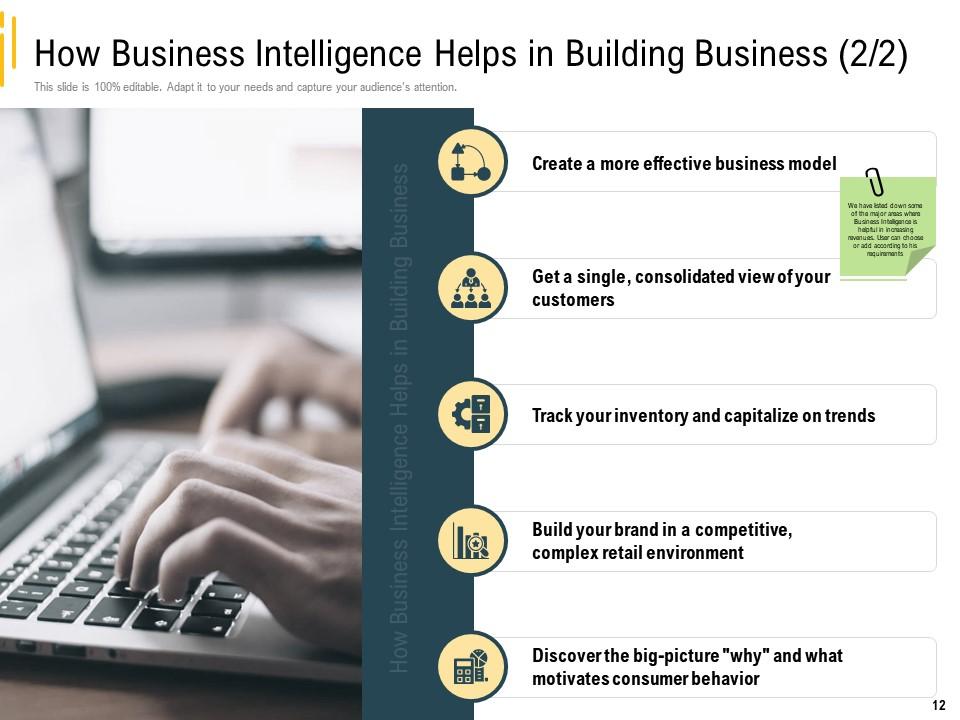
Slide 12: This is another slide showing How Business Intelligence Helps in Building Business.
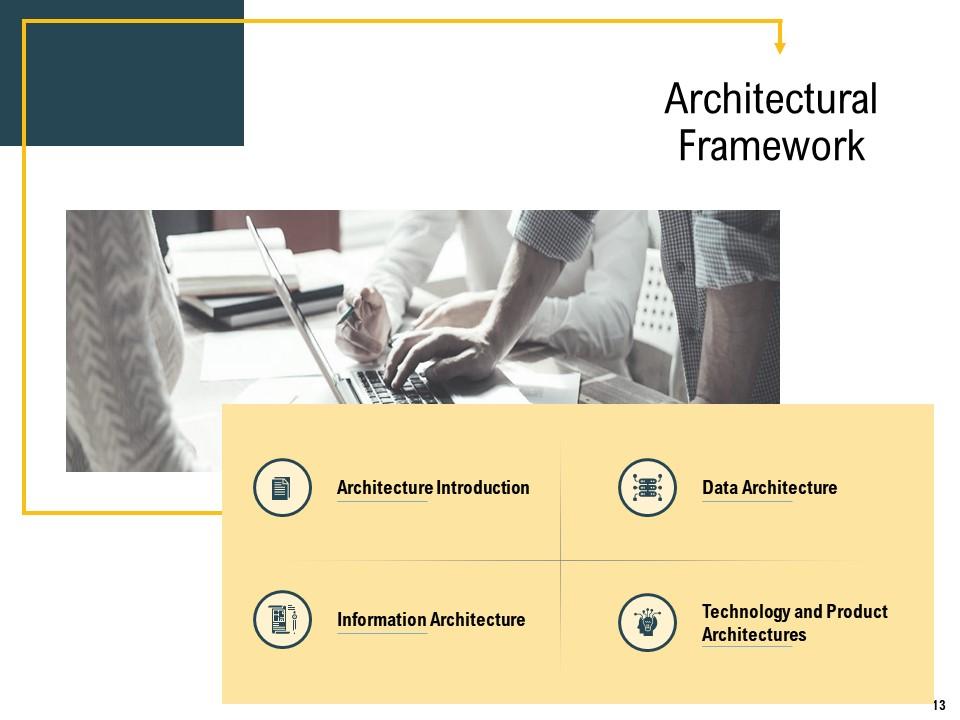
Slide 13: This slide presents Architectural Framework describing Architecture Introduction, Information Architecture, Data Architecture, etc.
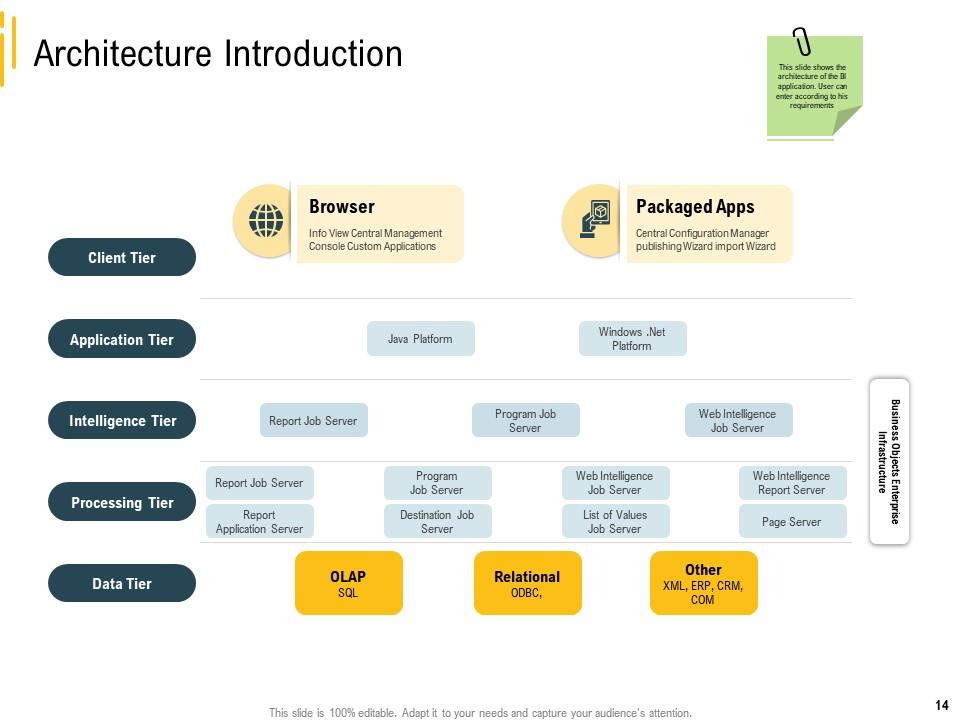
Slide 14: This slide displays the architecture of the BI application.
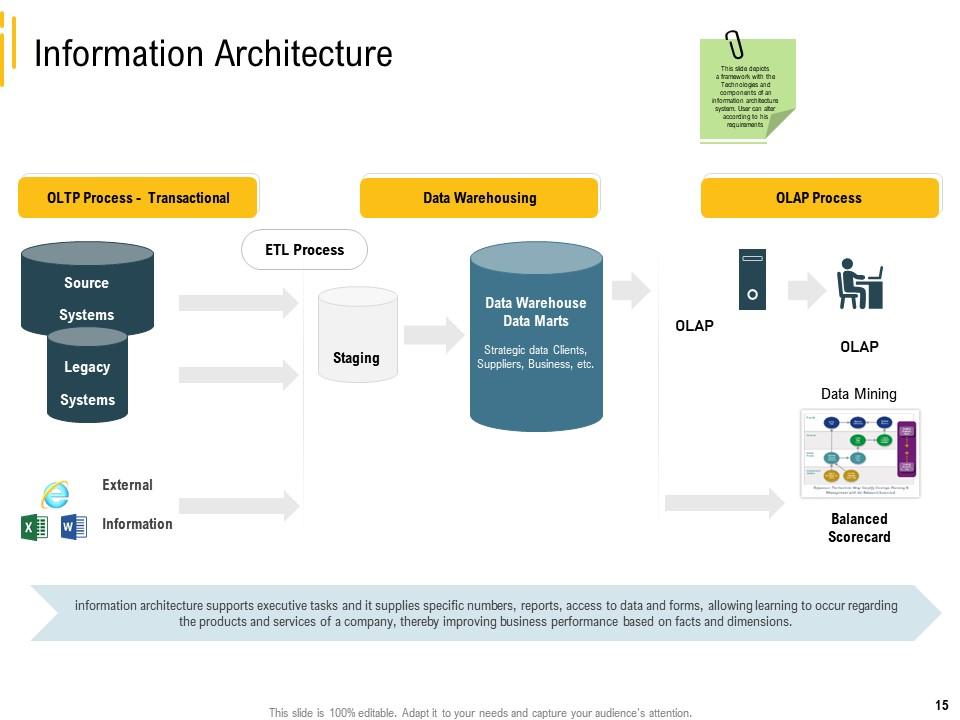
Slide 15: This slide depicts a framework with the Technologies and components of an information architecture system. User can alter according to his requirements
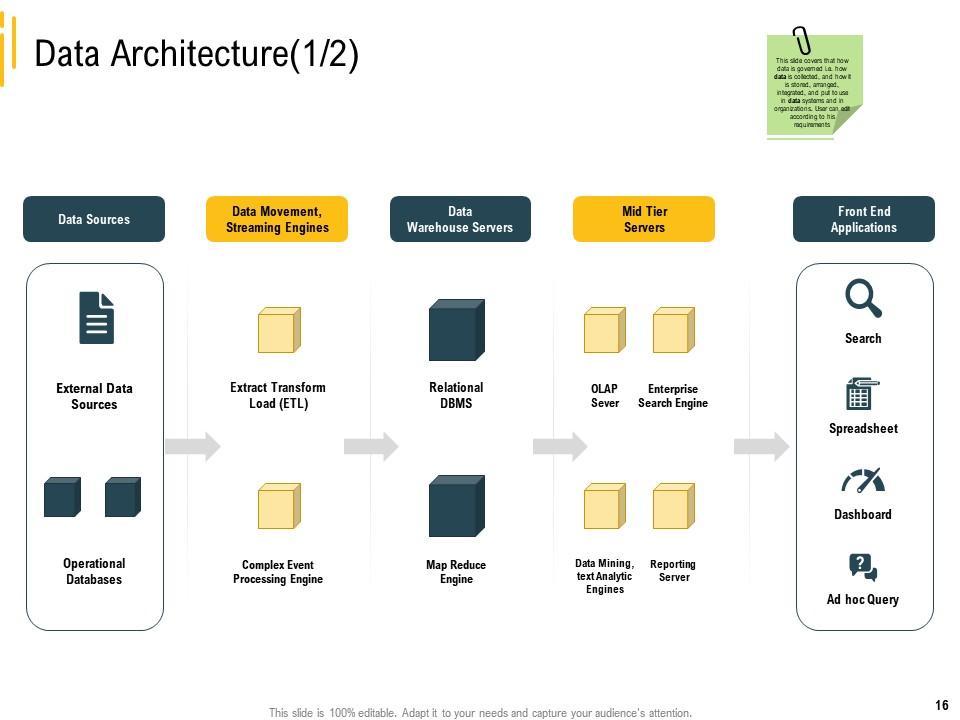
Slide 16: This slide covers that how data is governed i.e. how data is collected, and how it is stored, arranged, integrated, and put to use in data systems and in organizations. User can edit according to his requirements
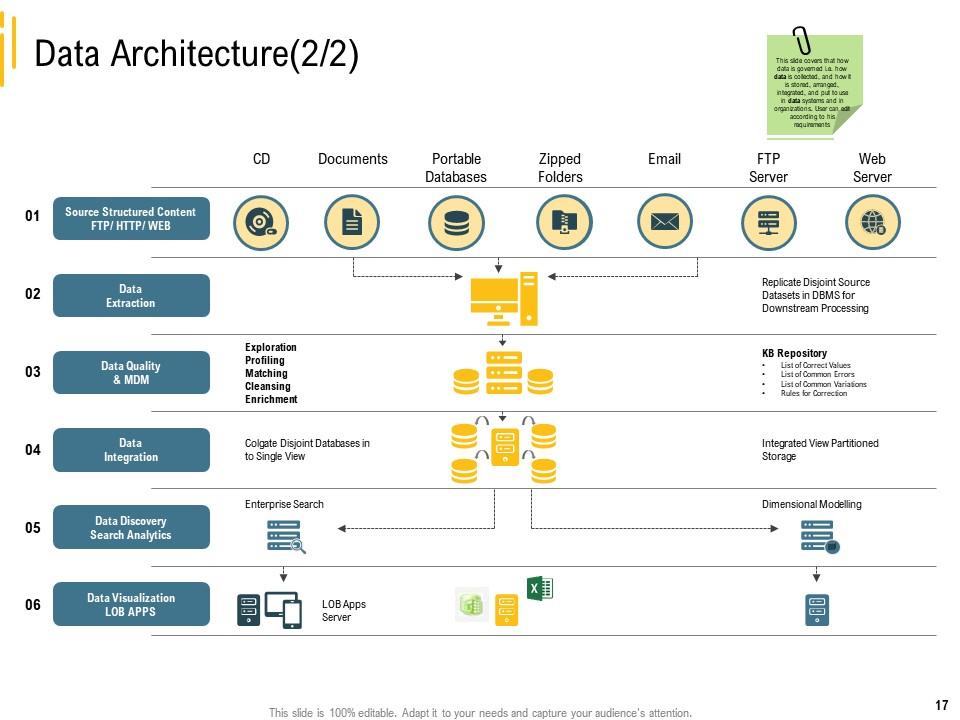
Slide 17: This slide covers that how data is governed i.e. how data is collected, and how it is stored, arranged, integrated, and put to use in data systems and in organizations. User can edit according to his requirements
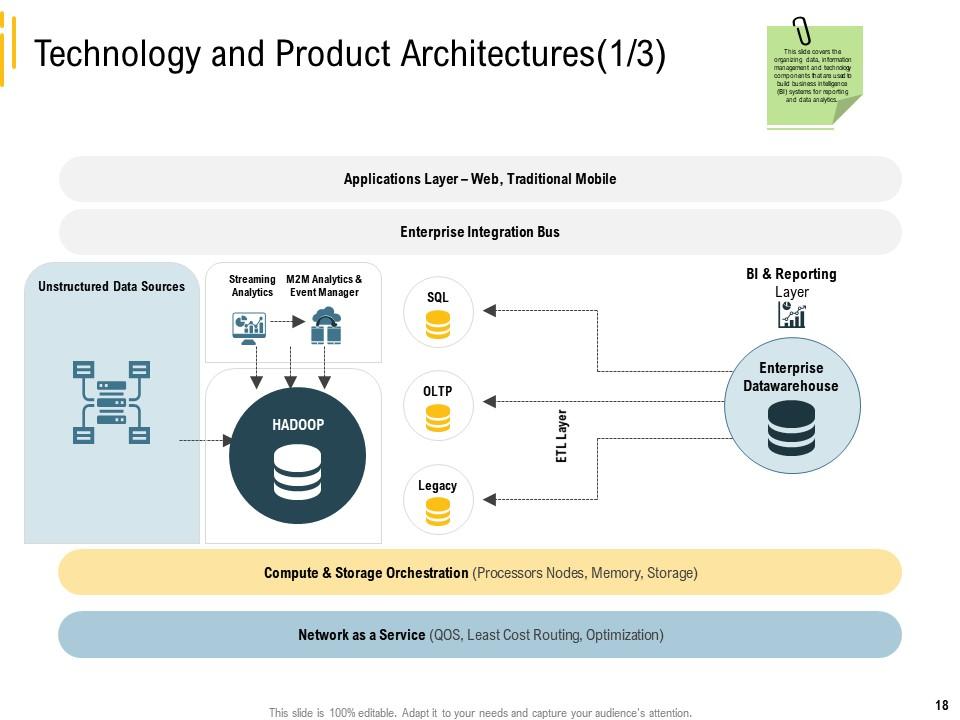
Slide 18: This slide presents the organizing data, information management and technology components that are used to build business intelligence (BI) systems for reporting and data analytics.
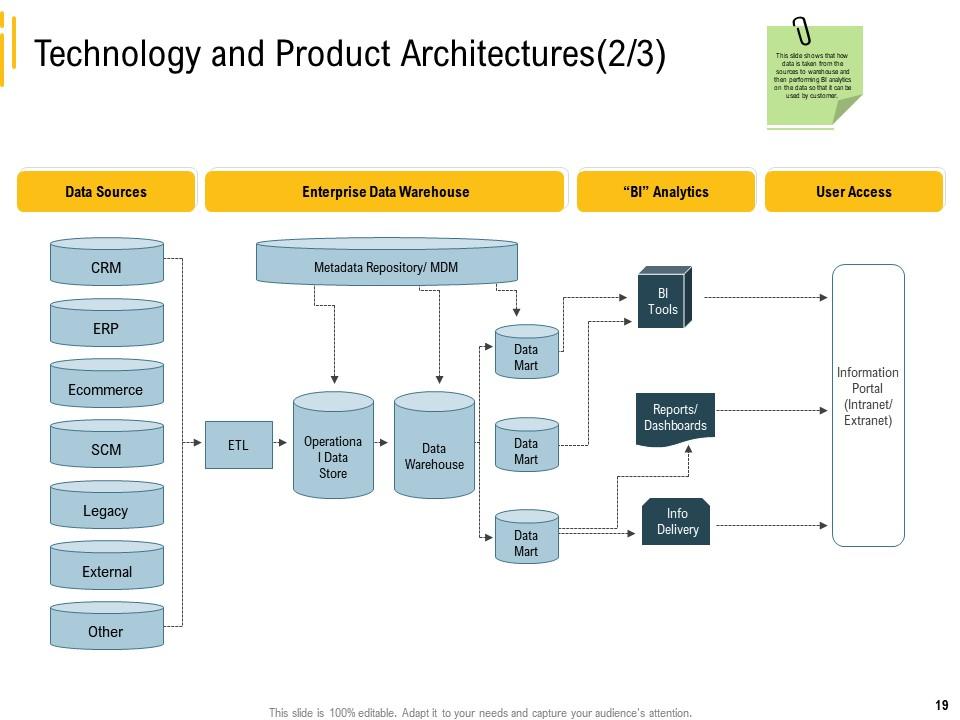
Slide 19: This slide displays that how data is taken from the sources to warehouse and then performing BI analytics on the data so that it can be used by customer.
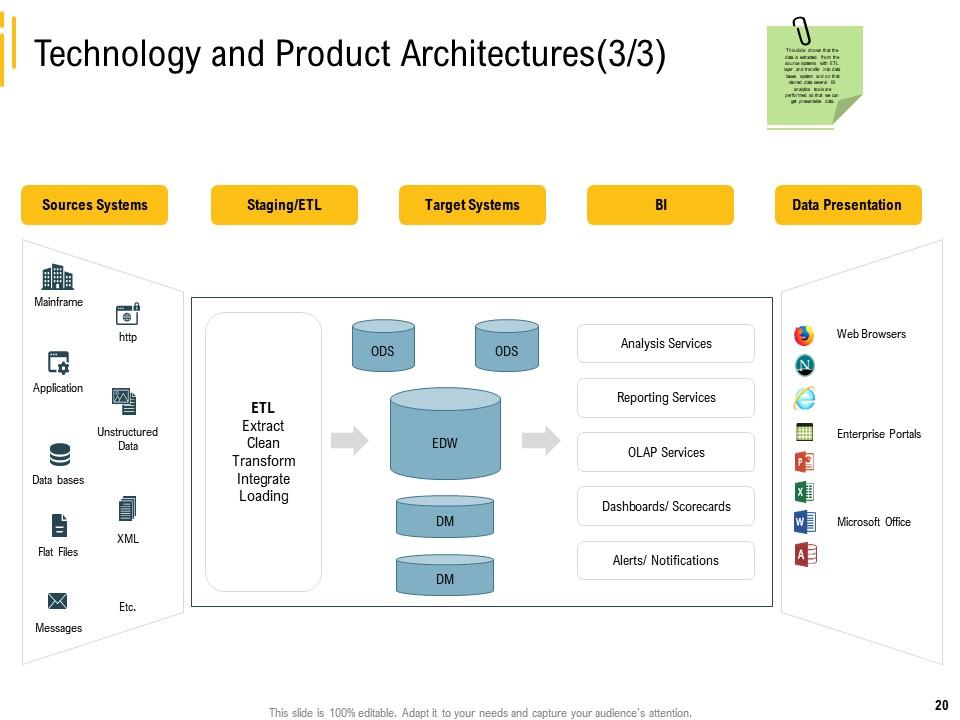
Slide 20: This slide shows that the data is extracted from the source systems with ETL layer and transfer into data bases system and on that stored data several BI analytics tools are performed so that we can get presentable data.
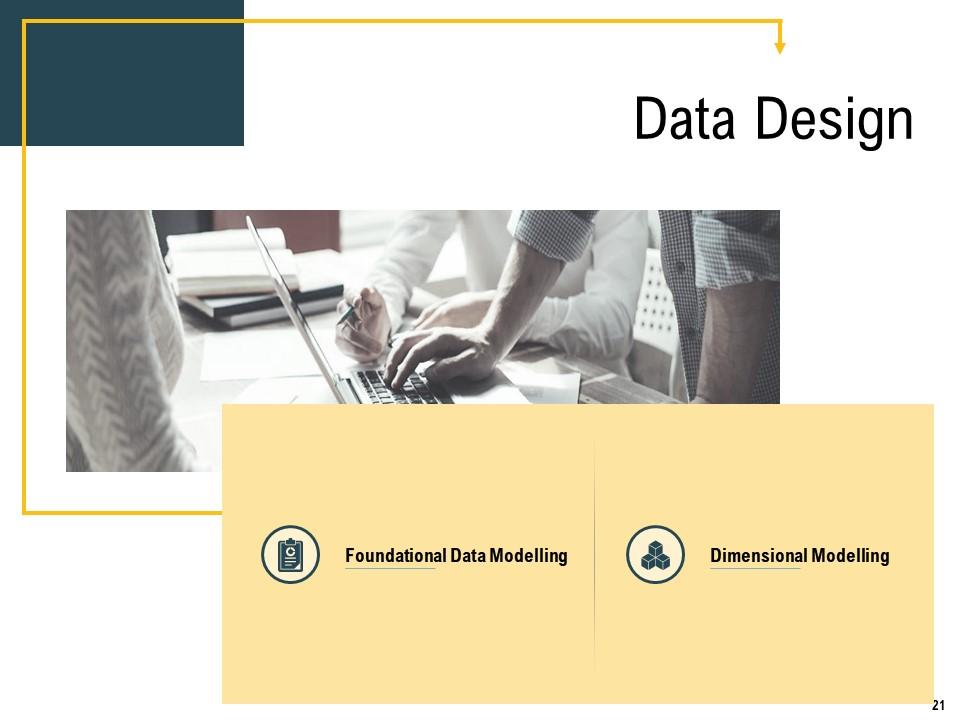
Slide 21: This slide presents Data Design describing- Foundational Data Modelling, Dimensional Modelling, etc.
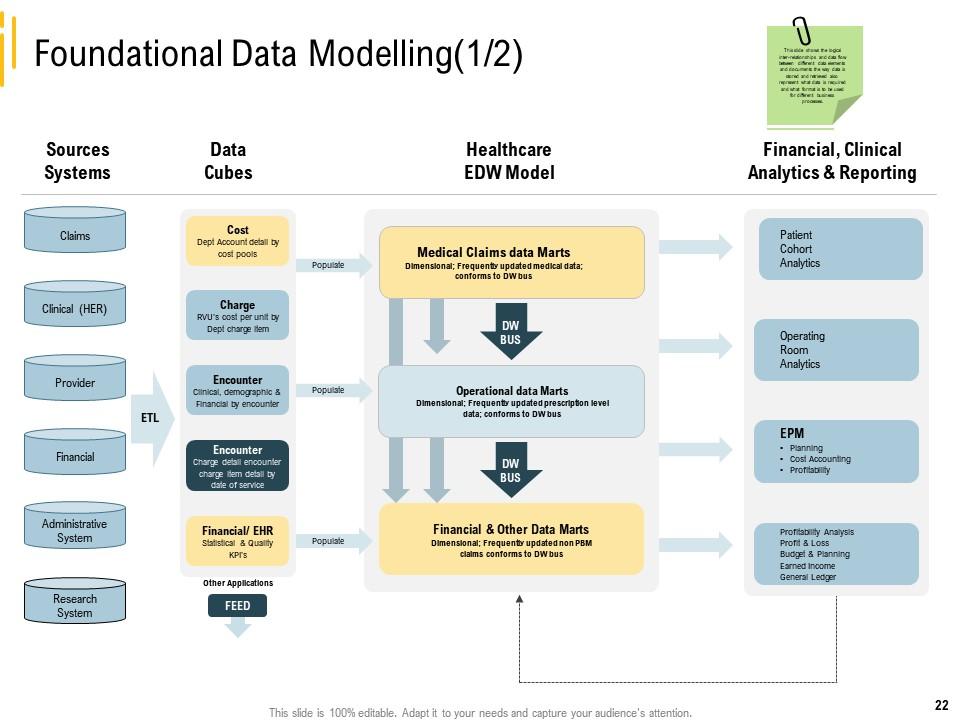
Slide 22: This slide displays the logical inter-relationships and data flow between different data elements and documents the way data is stored and retrieved also represent what data is required and what format is to be used for different business processes.
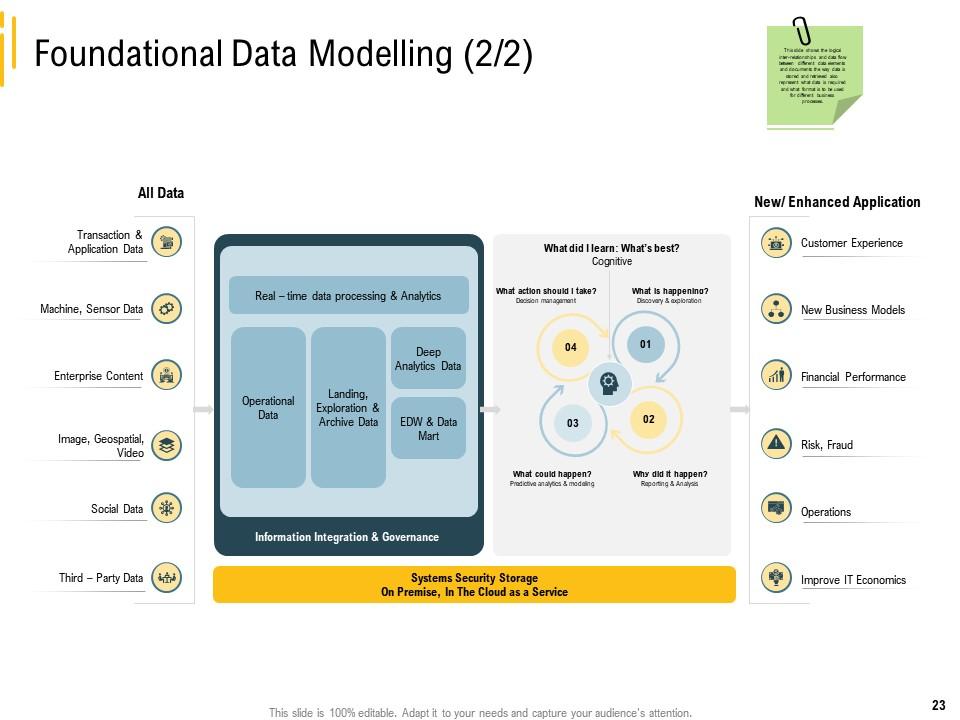
Slide 23: This slide shows the logical inter-relationships and data flow between different data elements and documents the way data is stored and retrieved also represent what data is required and what format is to be used for different business processes.
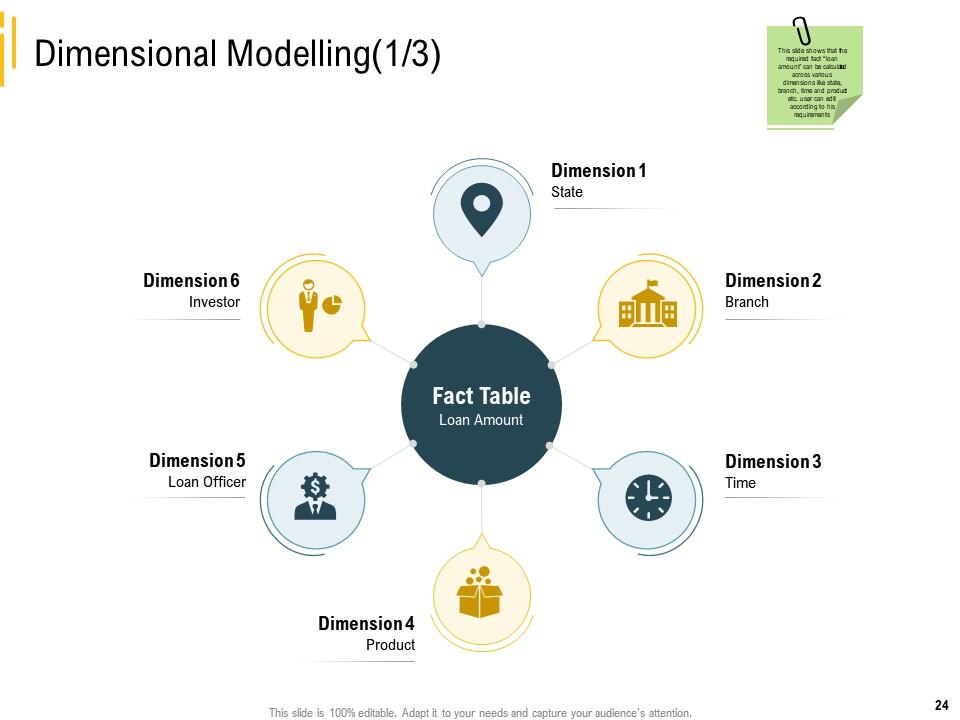
Slide 24: This slide showcases that the required fact “loan amount’ can be calculated across various dimensions like state, branch, time and product etc. user can edit according to his requirements
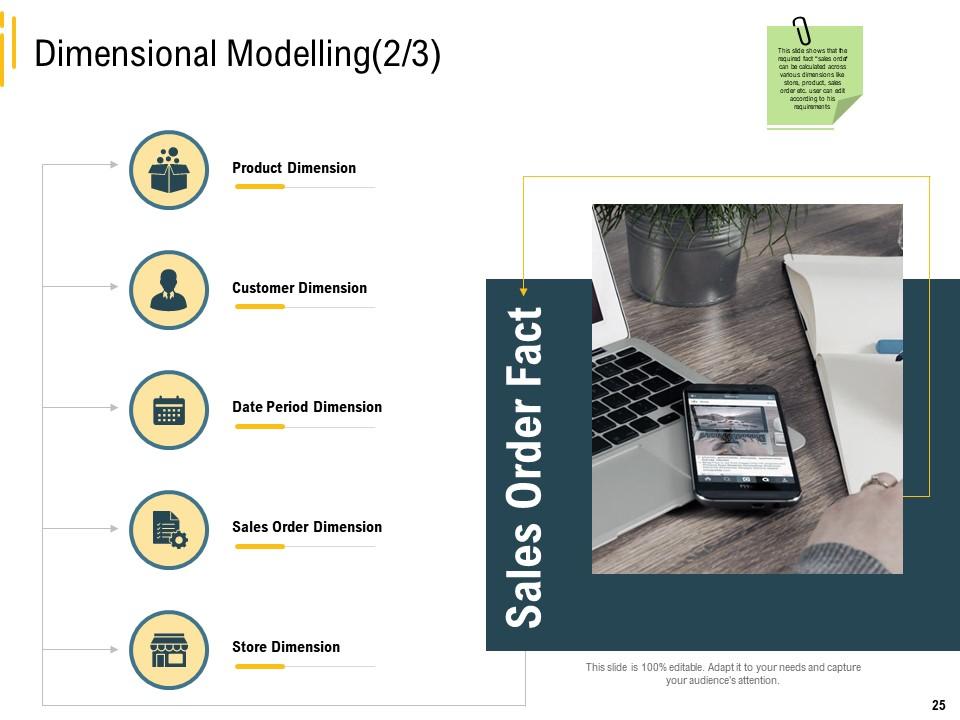
Slide 25: This slide shows that the required fact “sales order’ can be calculated across various dimensions like store, product, sales order etc. user can edit according to his requirements
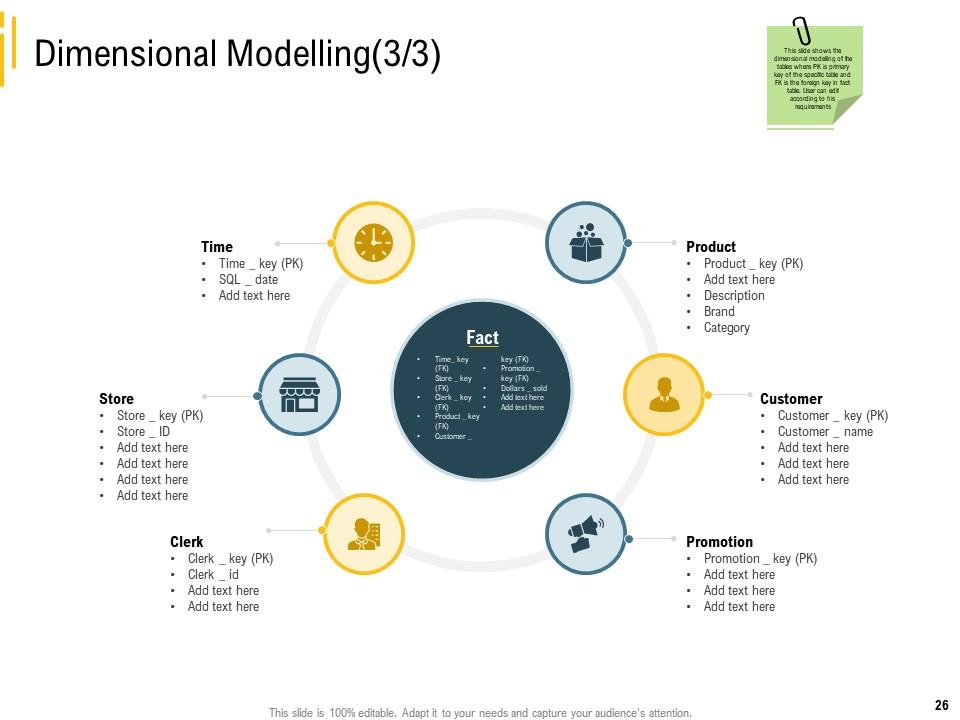
Slide 26: This slide presents the dimensional modelling of the tables where PK is primary key of the specific table and FK is the foreign key in fact table. User can edit according to his requirements
Slide 27: This slide displays Data Integration Design with related imagery.
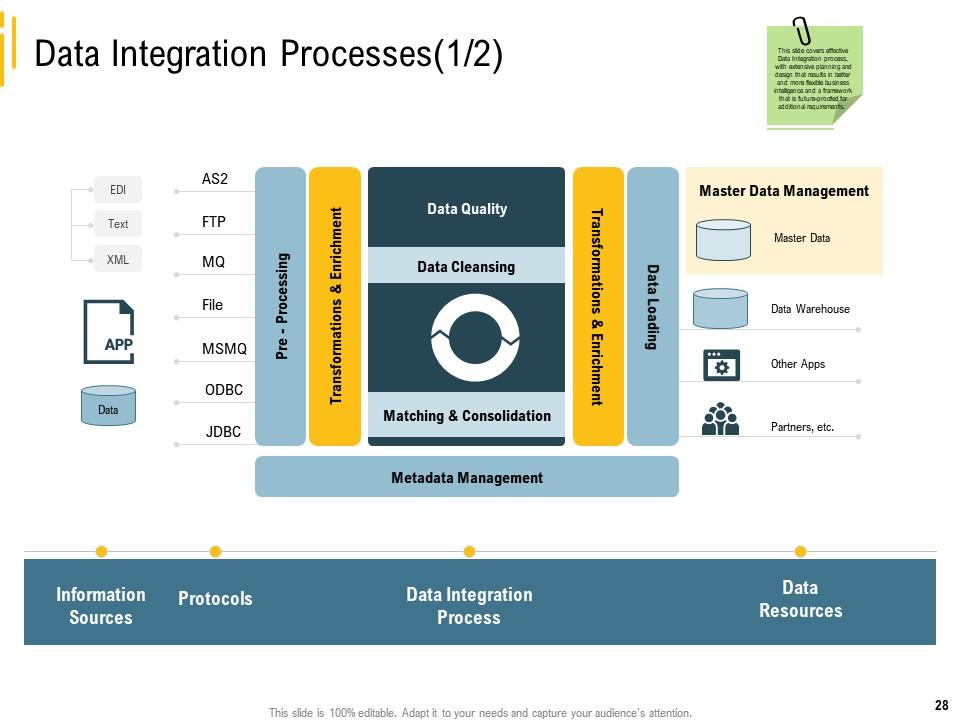
Slide 28: This slide covers effective Data Integration process, with extensive planning and design that results in better and more flexible business intelligence and a framework that is future-proofed for additional requirements.
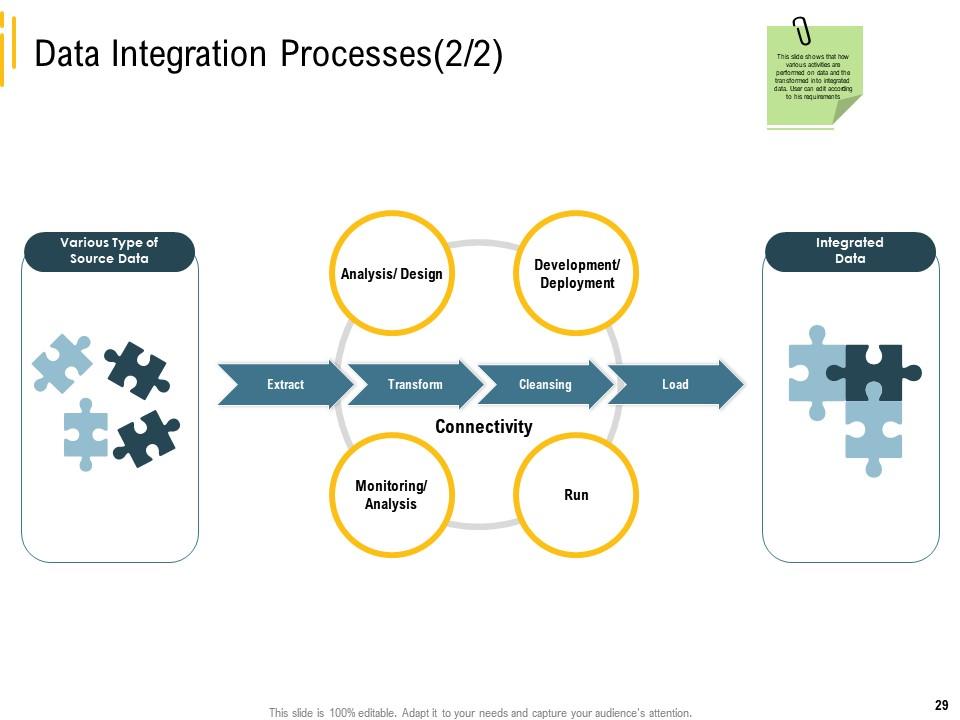
Slide 29: This slide shows that how various activities are performed on data and the transformed into integrated data. User can edit according to his requirements
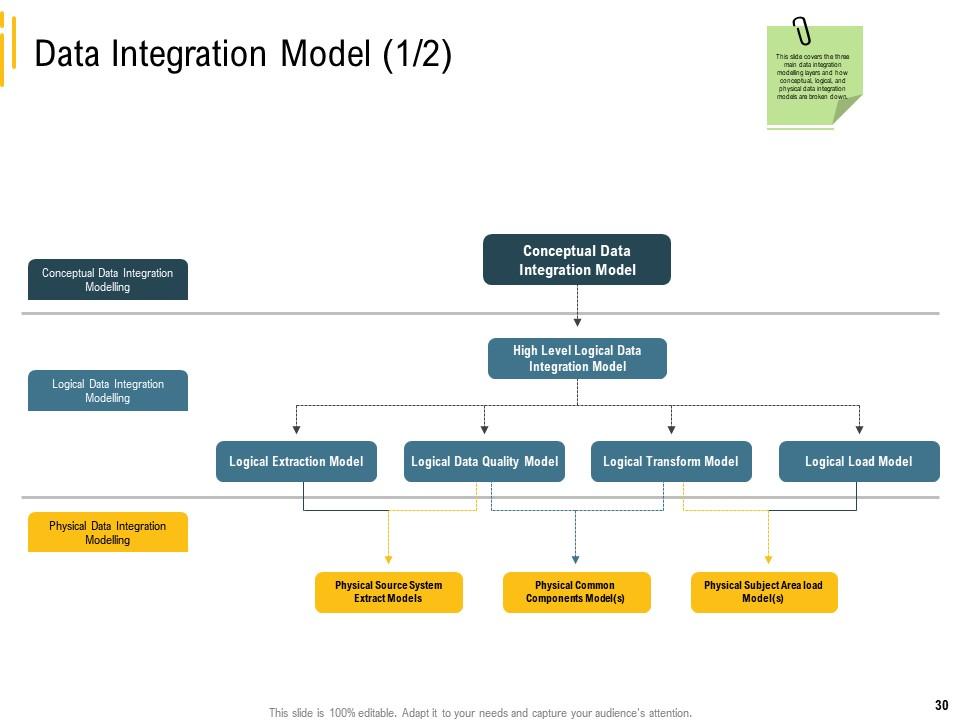
Slide 30: This slide covers the three main data integration modelling layers and how conceptual, logical, and physical data integration models are broken down.
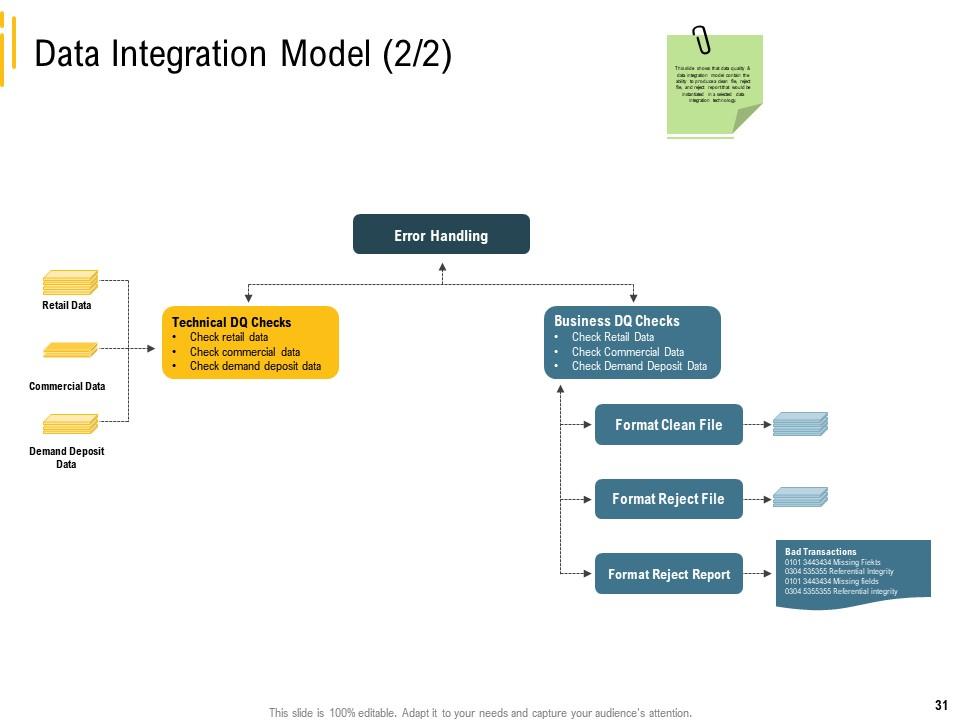
Slide 31: This slide shows that data quality & data integration model contain the ability to produce a clean file, reject file, and reject report that would be instantiated in a selected data integration technology.
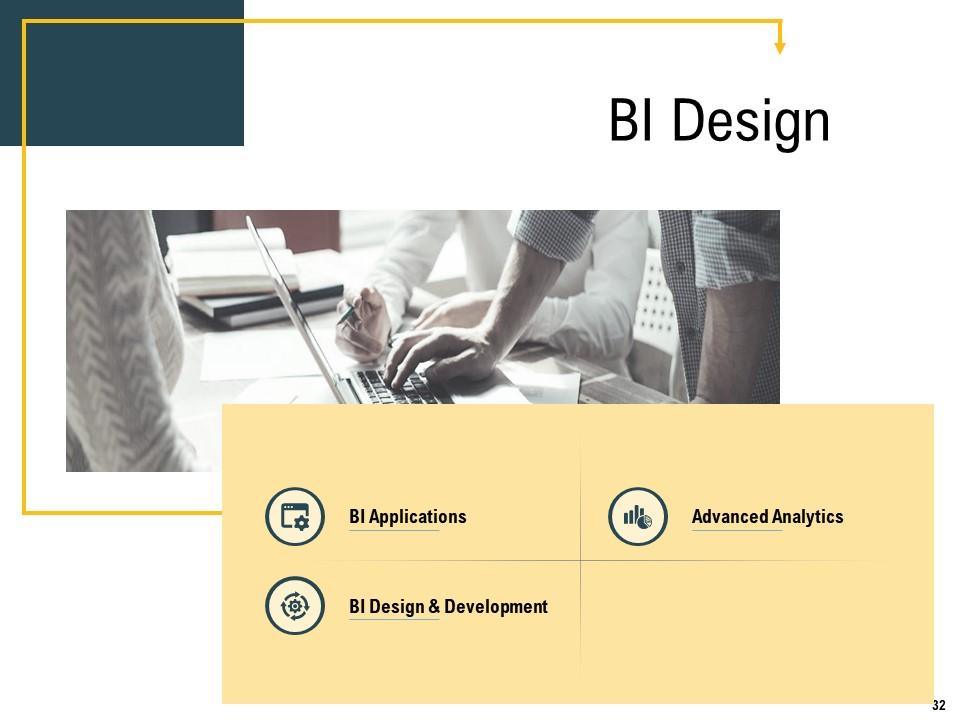
Slide 32: This slide presents BI Design describing- BI Design & Development, Advanced Analytics, BI Applications, etc.
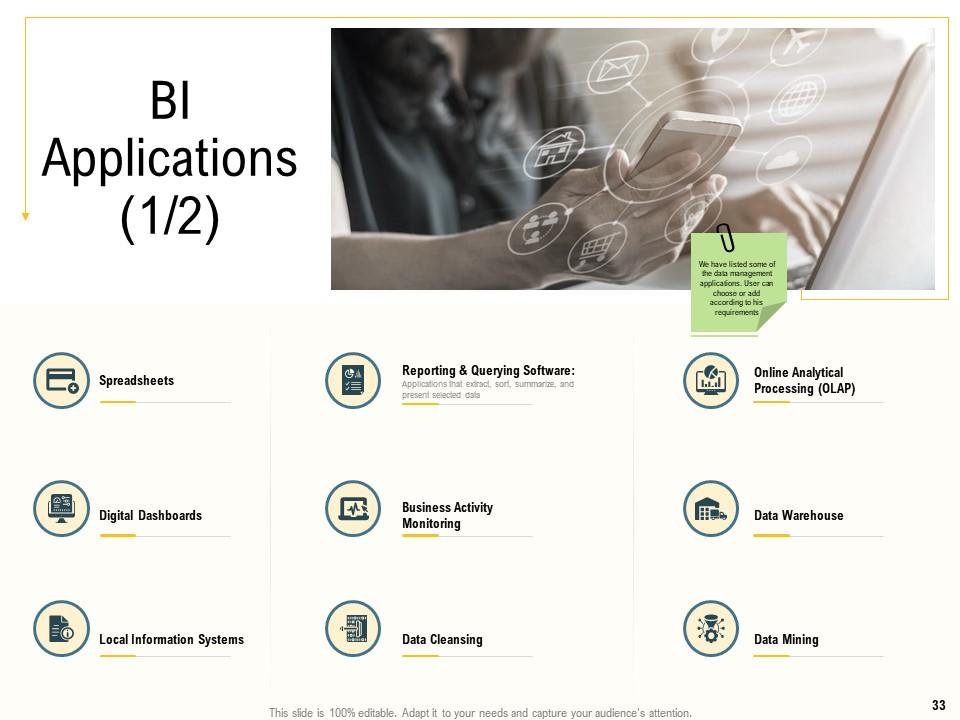
Slide 33: This slide displays BI Applications describing- Data Cleansing, Spreadsheets, Digital Dashboards, etc.
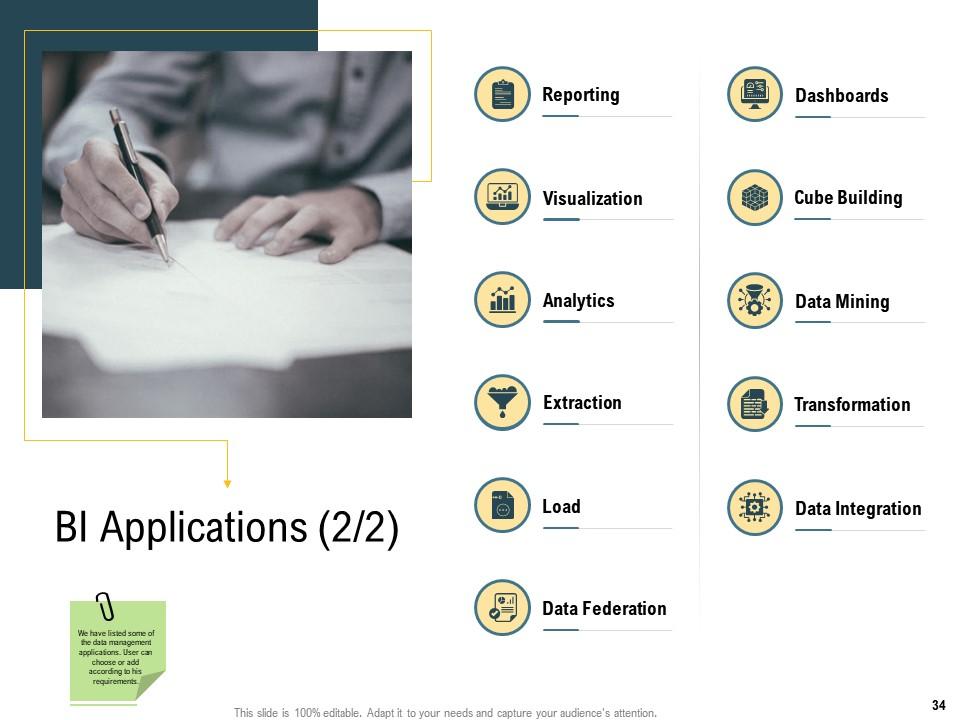
Slide 34: This is another slide shows BI Applications describing- Data Mining, Data Integration, Visualization, etc.
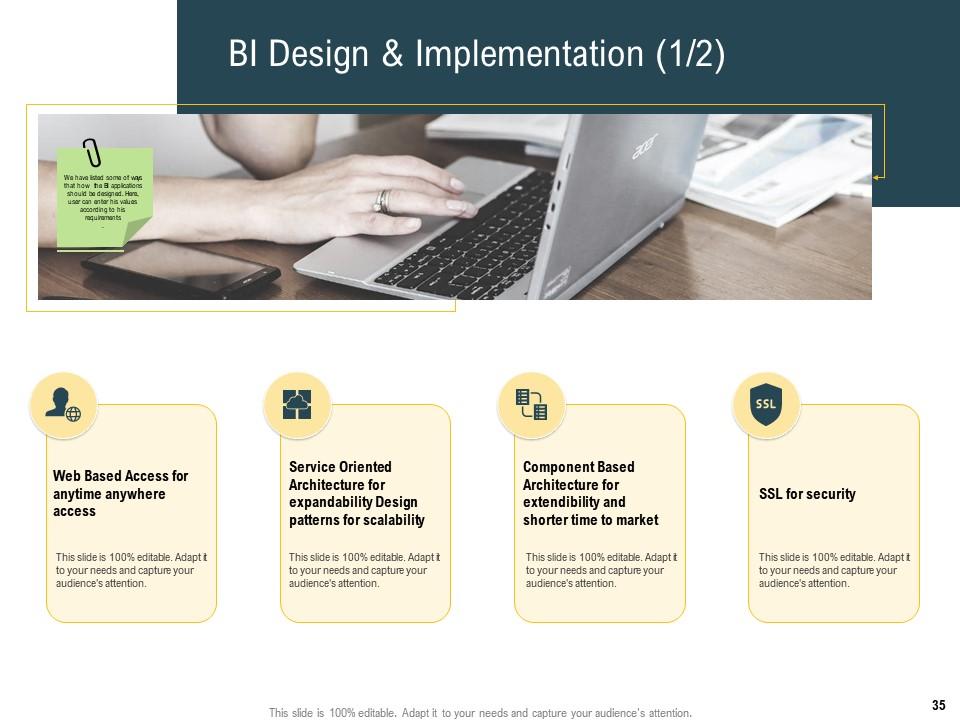
Slide 35: This slide presents BI Design & Implementation.
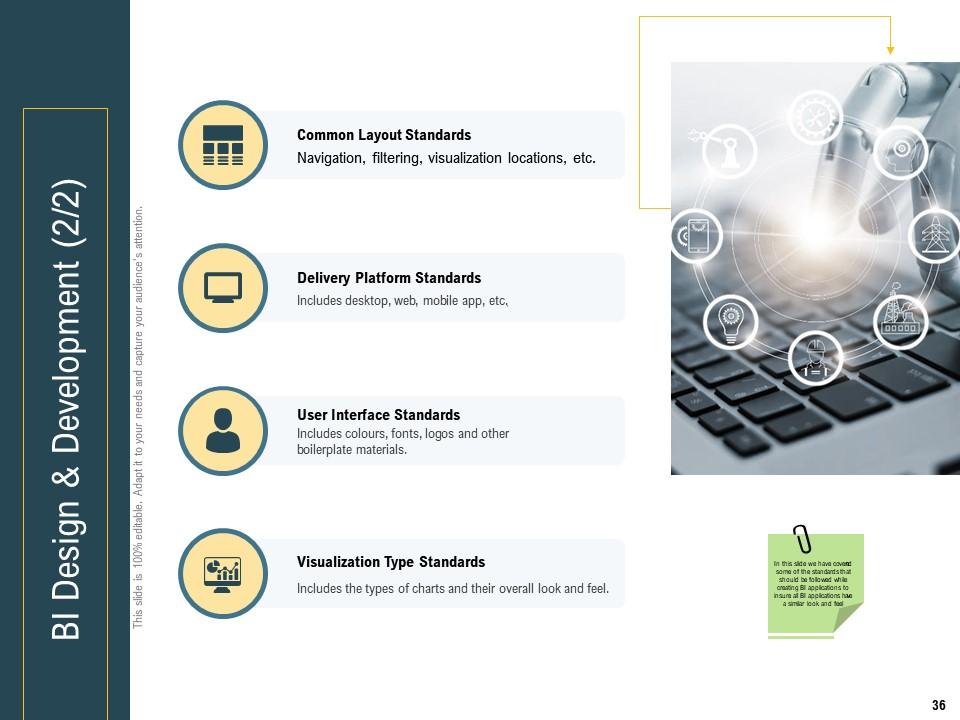
Slide 36: This slide shows BI Design & Development.
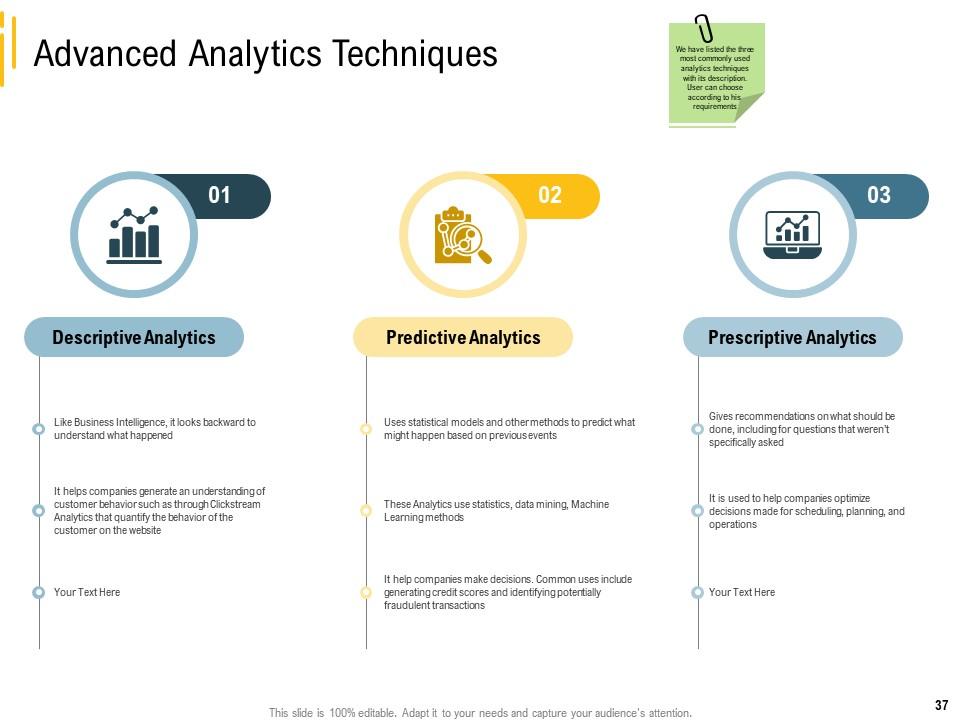
Slide 37: This slide presents Advanced Analytics Techniques like Descriptive Analytics, Predictive Analytics, Prescriptive Analytics, etc.
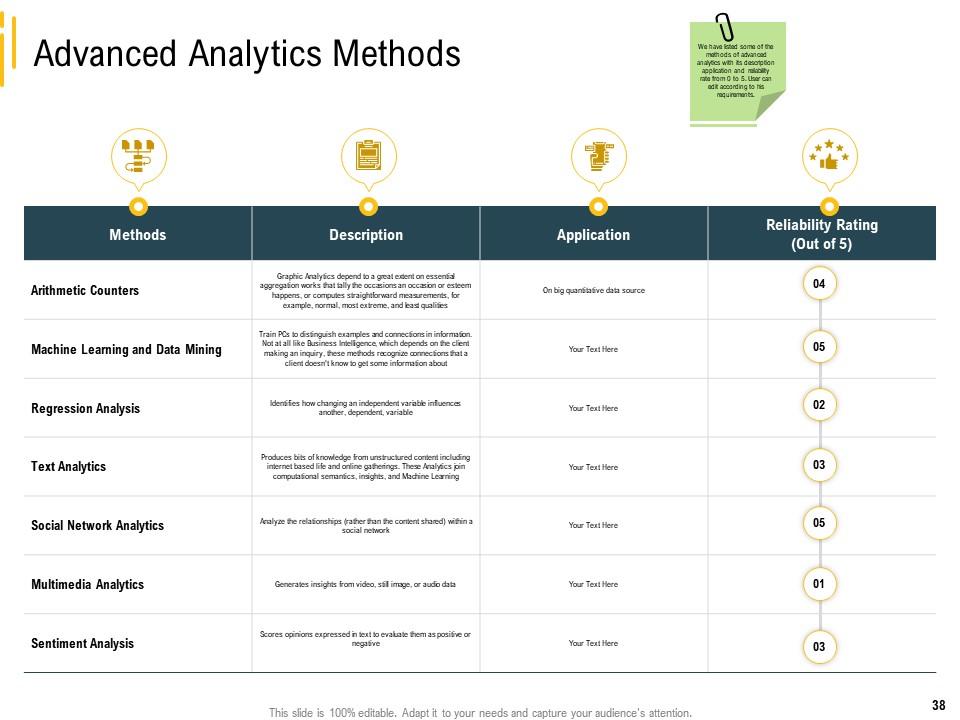
Slide 38: This slide displays Advanced Analytics Methods in tabular form.
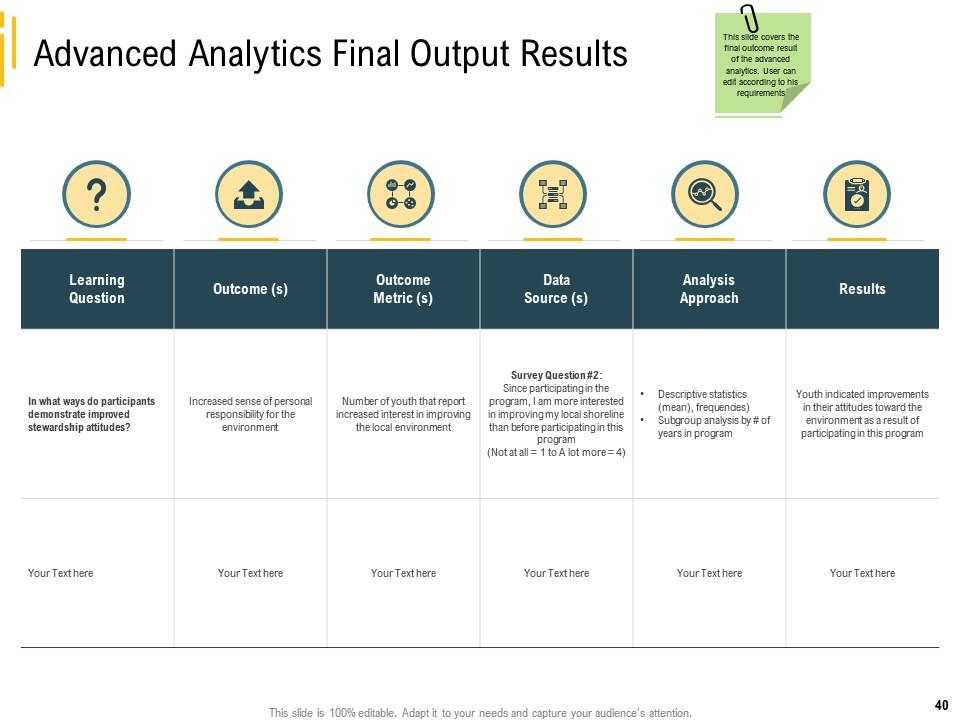
Slide 39: This slide shows Advanced Analytics Final Output Results.
Slide 40: This slide covers the final outcome result of the advanced analytics. User can edit according to his requirements '
Slide 41: This slide shows Business Intelligence Kpis & Dashboard.
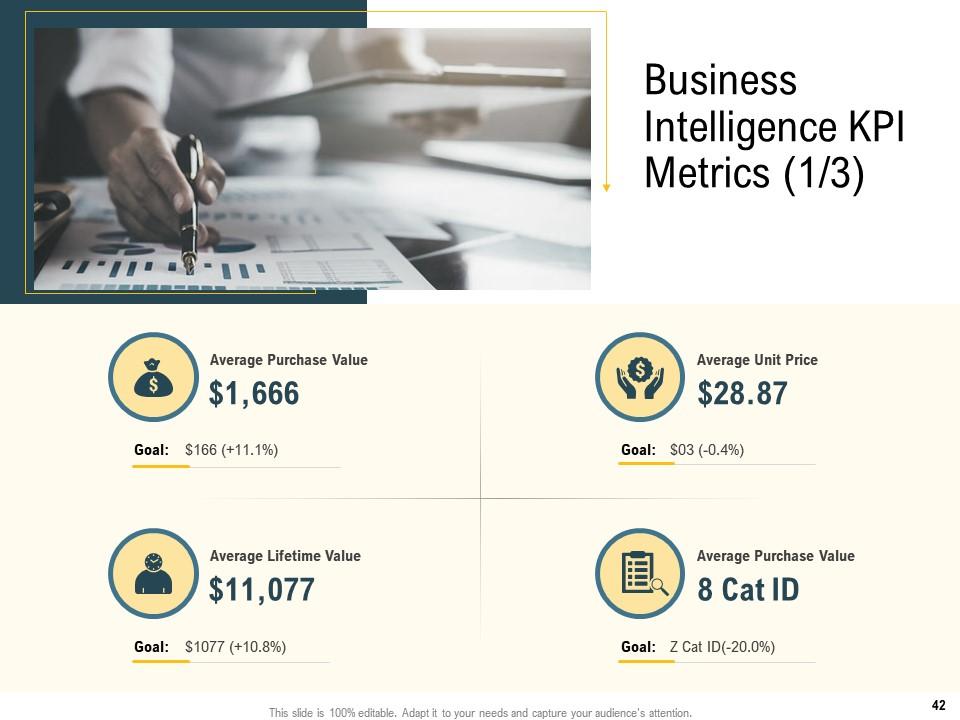
Slide 42: This is another slide showing Business Intelligence KPI Metrics.
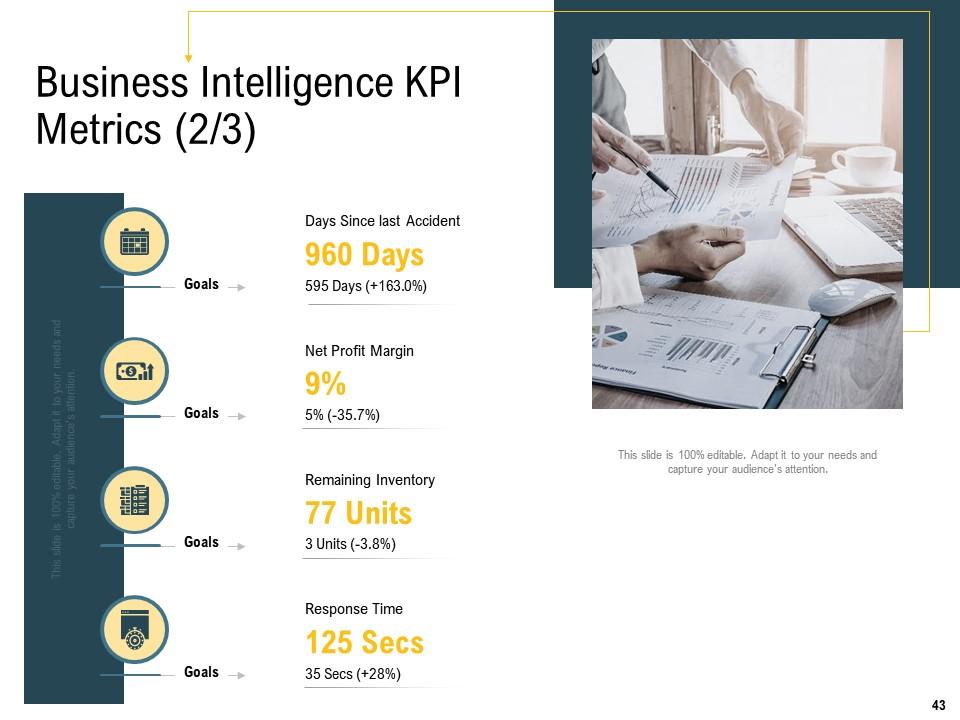
Slide 43: This slide presents Business Intelligence KPI Metrics with related imagery.
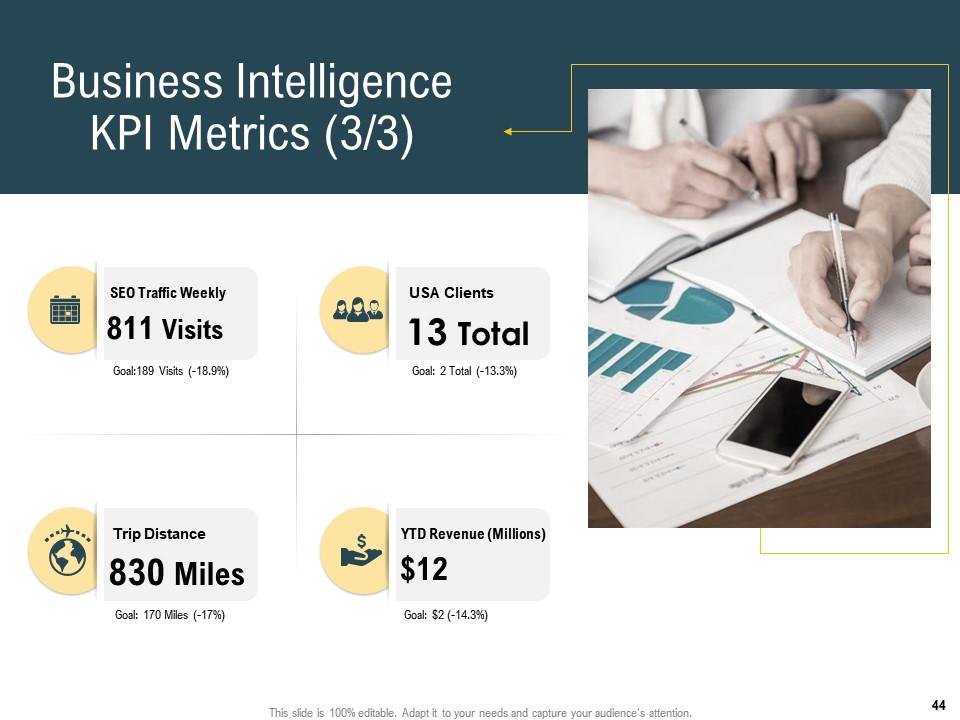
Slide 44: This slide represents Business Intelligence KPI Metrics.
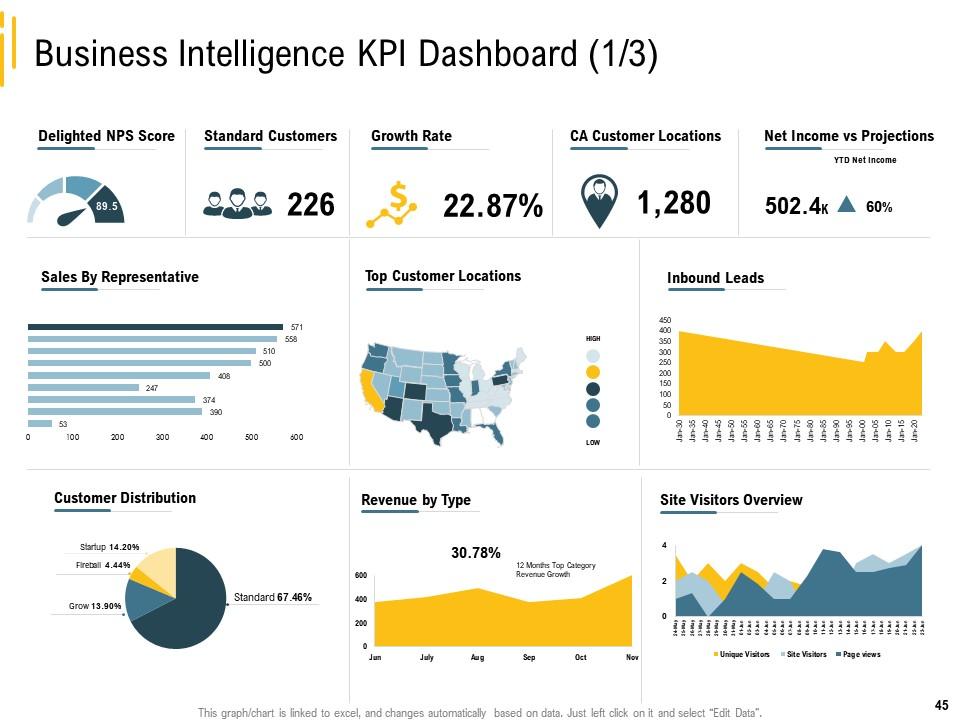
Slide 45: This slide showcases Business Intelligence KPI Dashboard.
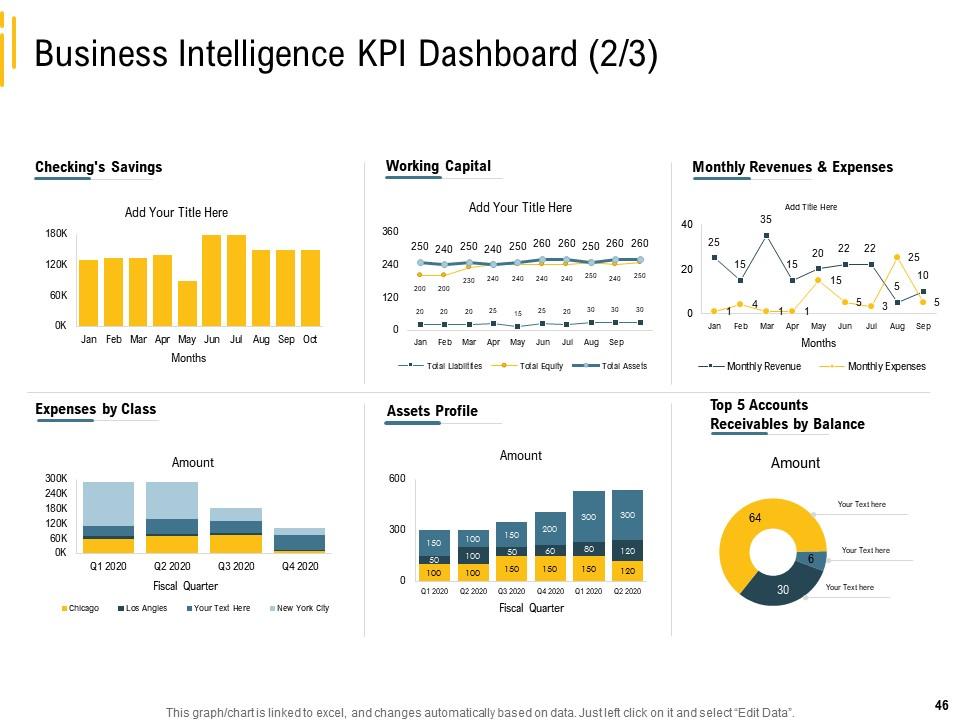
Slide 46: This slide shows Business Intelligence KPI Dashboard.
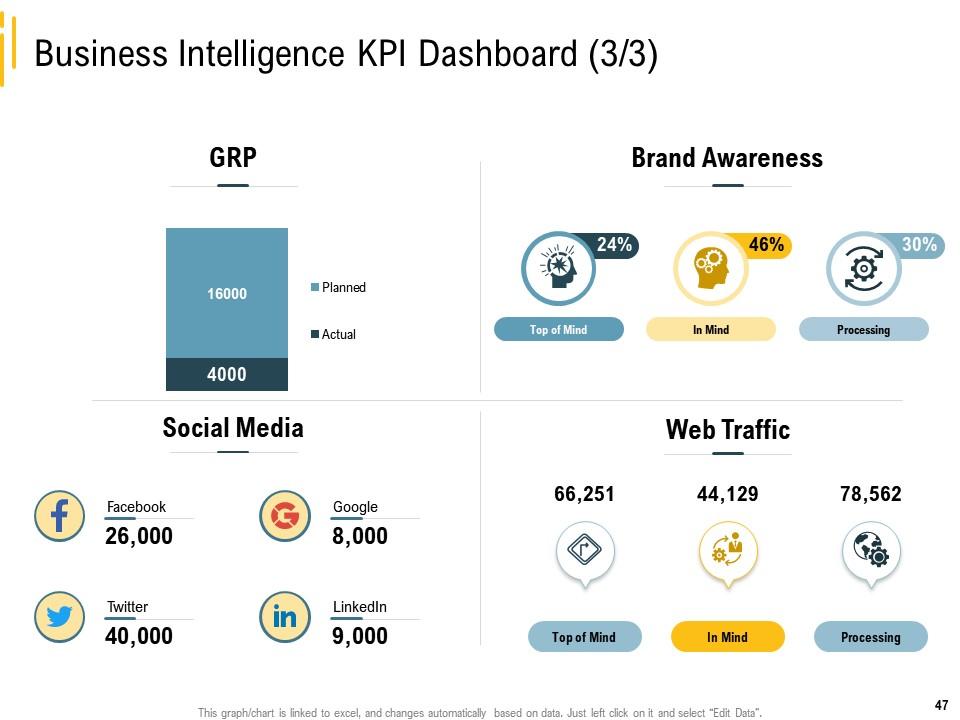
Slide 47: This slide presents Business Intelligence KPI Dashboard.
Slide 48: This slide displays Implementation of Artificial Intelligence Icons.
Slide 49: This slide is titled as Additional Slides for moving forward.
Slide 50: This is About Us slide to show company specifications, etc.
Slide 51: This is Our Team slide with names and designation.
Slide 52: This is Our Mission slide. State your firm's mission here.
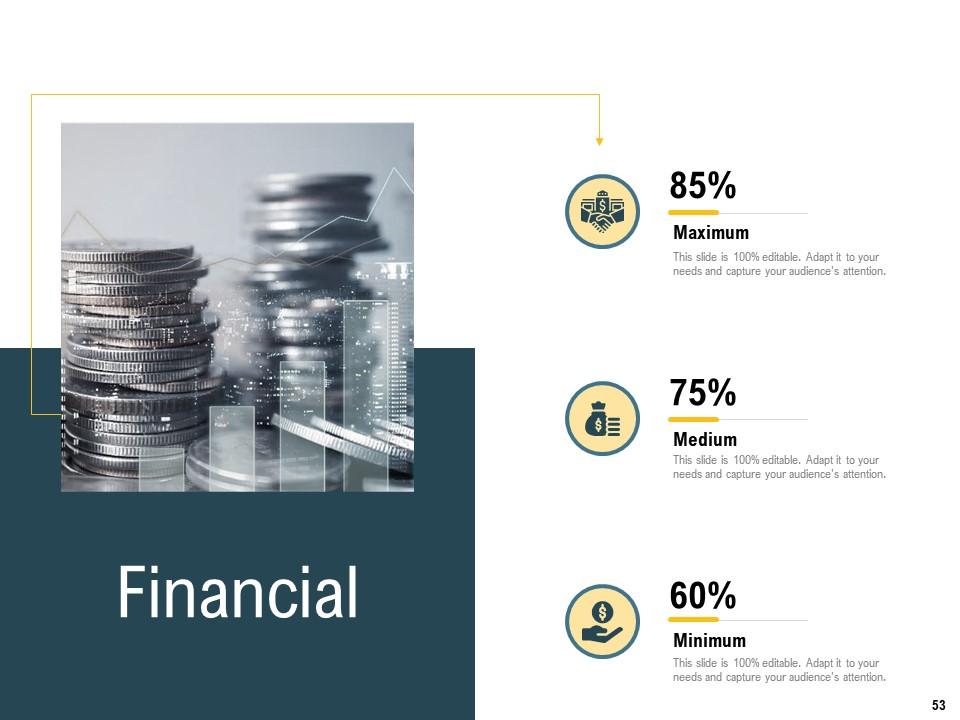
Slide 53: This is a Financial slide. Show your finance related stuff here.
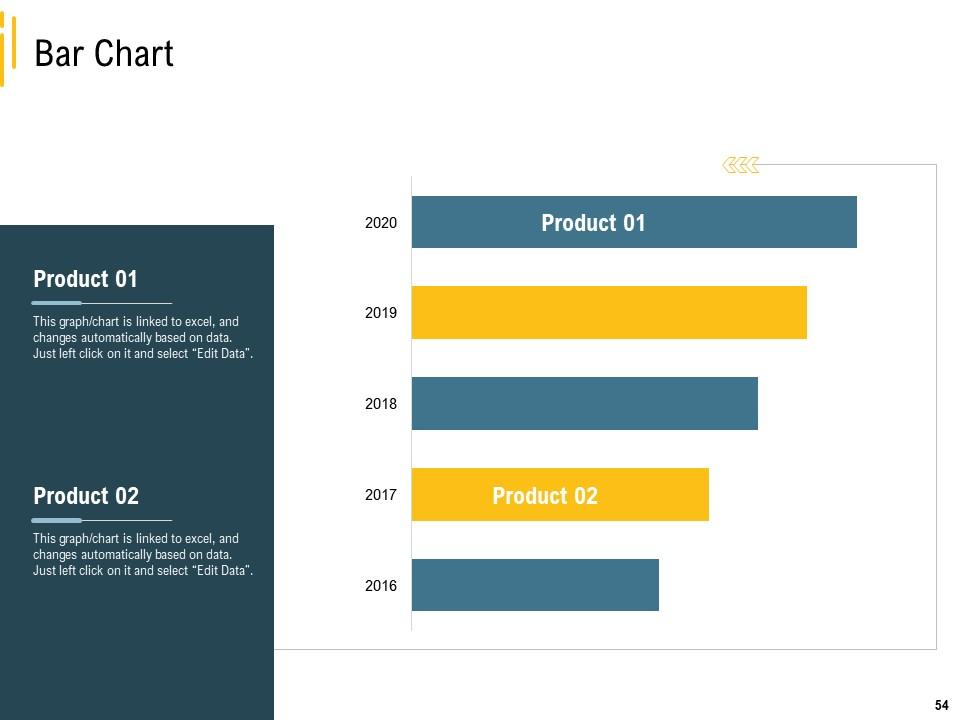
Slide 54: This slide shows Bar Chart with two products comparison.
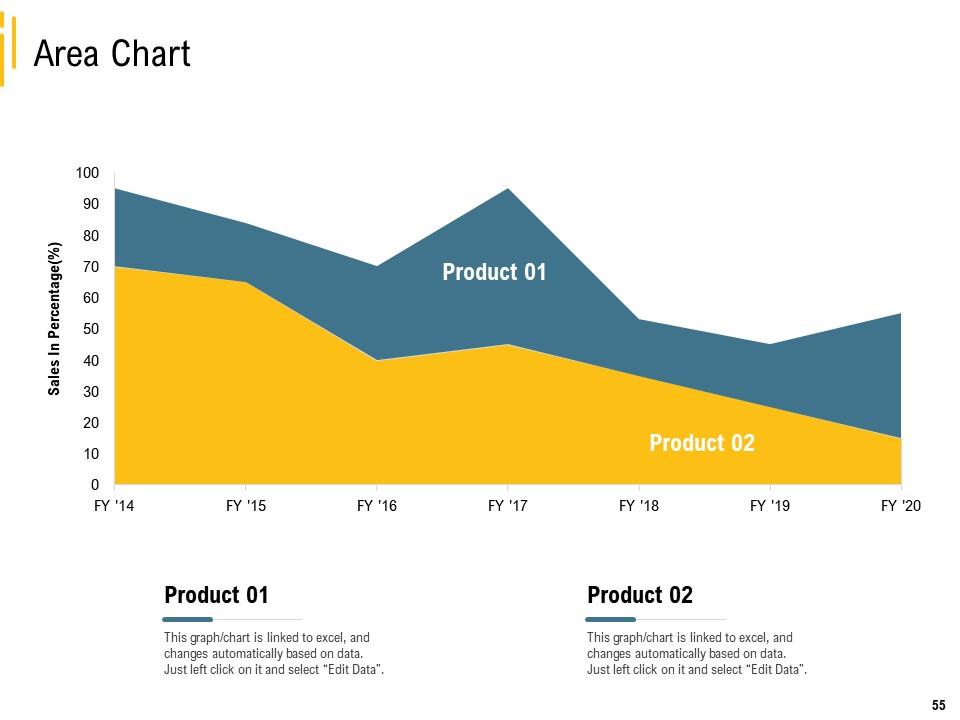
Slide 55: This slide presents Area Chart with two products comparison.
Slide 56: This is a Thank You slide with address, contact numbers and email address.
Implementation of artificial intelligence powerpoint presentation slides with all 56 slides:
Use our Implementation Of Artificial Intelligence Powerpoint Presentation Slides to effectively help you save your valuable time. They are readymade to fit into any presentation structure.
-
Innovative and attractive designs.
-
Design layout is very impressive.
-
Good research work and creative work done on every template.
-
Easily Understandable slides.
-
Informative design.
-
Innovative and Colorful designs.
-
Commendable slides with attractive designs. Extremely pleased with the fact that they are easy to modify. Great work!
-
Informative design.
-
Presentation Design is very nice, good work with the content as well.
-
The Designed Graphic are very professional and classic.


