


Business intelligence and analytics powerpoint presentation slides
Introducing Business Intelligence And Analytics PowerPoint Presentation Slides. The presentation contains various templates explaining market overview, architecture framework, data design, data integration design, BI design, advanced final output results, KPI metrics, and dashboards. Display valuable business insights with the help of our professionally designed operational intelligence PPT slideshow. Other important information like industries that use BI and key drivers is also depicted in our artificial intelligence PPT deck. This commercial intelligence presentation aptly showcases how BI assists in developing business. Take the assistance of industrial AI PPT layouts to demonstrate sophisticated subjects like information architecture, and dimensional modeling easily. You can convey your BI design and implementation in a compact manner with our extremely useful business intelligence PowerPoint diagrams. This integrated business planning PowerPoint theme also sheds light on advanced analytics techniques and methods. Download the artificial intelligence ppt to represent your plan to expand business horizons.
Introducing Business Intelligence And Analytics PowerPoint Presentation Slides. The presentation contains various templates..


-

- Google Slides is a new FREE Presentation software from Google.
- All our content is 100% compatible with Google Slides.
- Just download our designs, and upload them to Google Slides and they will work automatically.
- Amaze your audience with SlideTeam and Google Slides.
-

Want Changes to This PPT Slide? Check out our Presentation Design Services
-

- WideScreen Aspect ratio is becoming a very popular format. When you download this product, the downloaded ZIP will contain this product in both standard and widescreen format.
-

- Some older products that we have may only be in standard format, but they can easily be converted to widescreen.
- To do this, please open the SlideTeam product in Powerpoint, and go to
- Design ( On the top bar) -> Page Setup -> and select "On-screen Show (16:9)” in the drop down for "Slides Sized for".
- The slide or theme will change to widescreen, and all graphics will adjust automatically. You can similarly convert our content to any other desired screen aspect ratio.
Compatible With Google Slides

Get This In WideScreen
You must be logged in to download this presentation.


Do you want to remove this product from your favourites?
PowerPoint presentation slides
Presenting Business Intelligence And Analytics Powerpoint Presentation Slides. You can modify the font size, type, and color of the slide as per your requirements. This slide can be downloaded into formats like PDF, JPG, and PNG without any problem. It is Google Slides friendly which makes it accessible at once. This slide is available in both the standard(4:9) and the widescreen(16:9) aspect ratio.

People who downloaded this PowerPoint presentation also viewed the following :
Content of this Powerpoint Presentation
Data is one of the most powerful tools in today’s landscape; it plays a significant role in taking businesses to the path of success. Data-driven decisions provide you with a competitive edge in a world entirely of competition, and it has become so critical to harness the power of data. Business intelligence and analytics are related to extracting valuable insights from data and making informed decisions. There are various tools for this endeavor in this organization, and tracking them is essential.
Download our business intelligence transformation toolkit with major milestones!!!
SlideTeam has designed some ready-to-use PPT templates to give an overview of the process in sight. These templates use creative and attractive visuals to make the PPT presentation captivating. Organizations that strive to keep an overview of business intelligence and analytics can have these templates so they can track the process and keep the overview in a single place.
If you want to prepare a report on business intelligence, explore our ready-to-use PPT template!!
Template 1: Business Intelligence Statistics

This template mainly deals with statistics about business intelligence applications and usage by various companies in data management. Through this ready-to-use PPT slide, you can demonstrate the percentage along with the additional space to describe what organizations do. For instance, it highlights that 51% of the companies use data analytics to develop new products and services, 46% of companies to manage risks, and 48% of the total companies use analytics to drive strategy and change. As these are entirely editable templates, you can add the information according to your company’s needs.
Template 2: Business Intelligence Trends
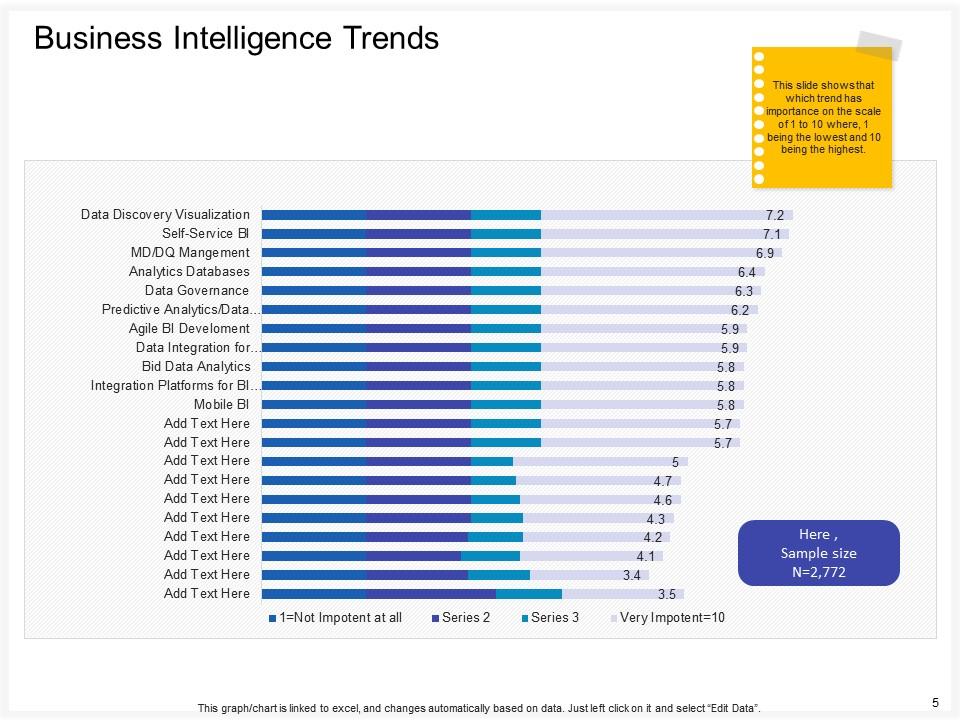
This template helps demonstrate the business intelligence trends on a scale of 1 to 10. Various business intelligence techniques are used by various organizations nowadays. These PPT slides help in organizing the trendiest techniques according to their popularity. Some of them are data discovery visualization, an integration platform for business intelligence, mobile business intelligence, big data analytics, data integration, agile business intelligence, data governance, analytic databases, and many more. There is an additional space to add more techniques according to your requirements.
Template 3: Business Intelligence Trends for Tools being used in Industry
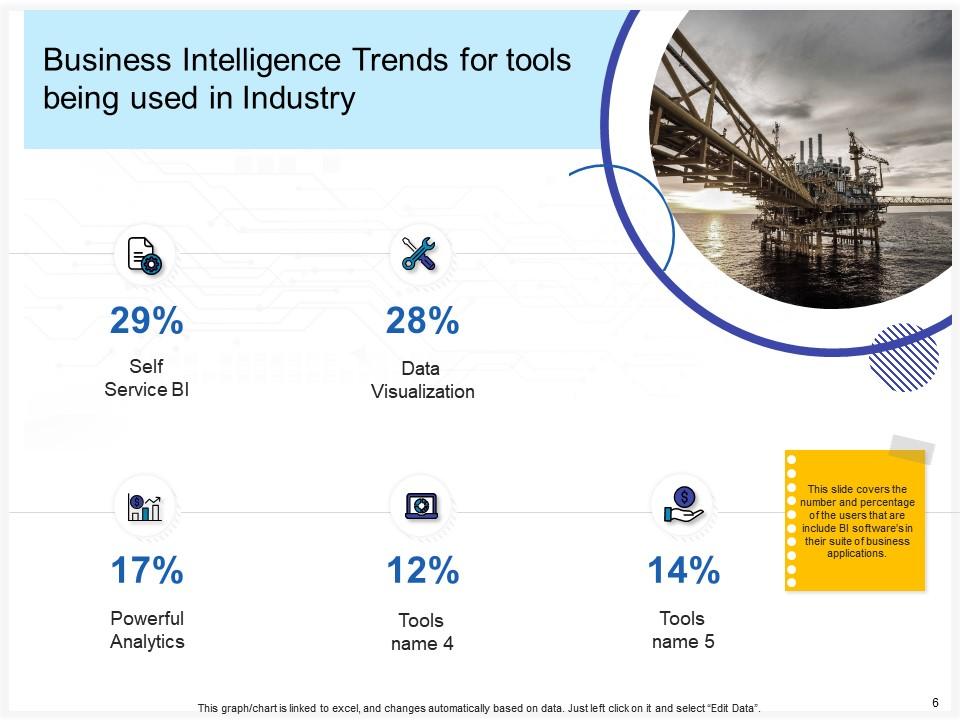
Some tools are used in industry for business intelligence. This PPT slide quickly demonstrates these tools, such as self-service BI, Powerful Analytics, Data Visualization, Self-Service BI, and many more. Impressive icons show the number and percentage of users who add business intelligence software to business applications.
Template 4: Top 5 Industries using Business Intelligence
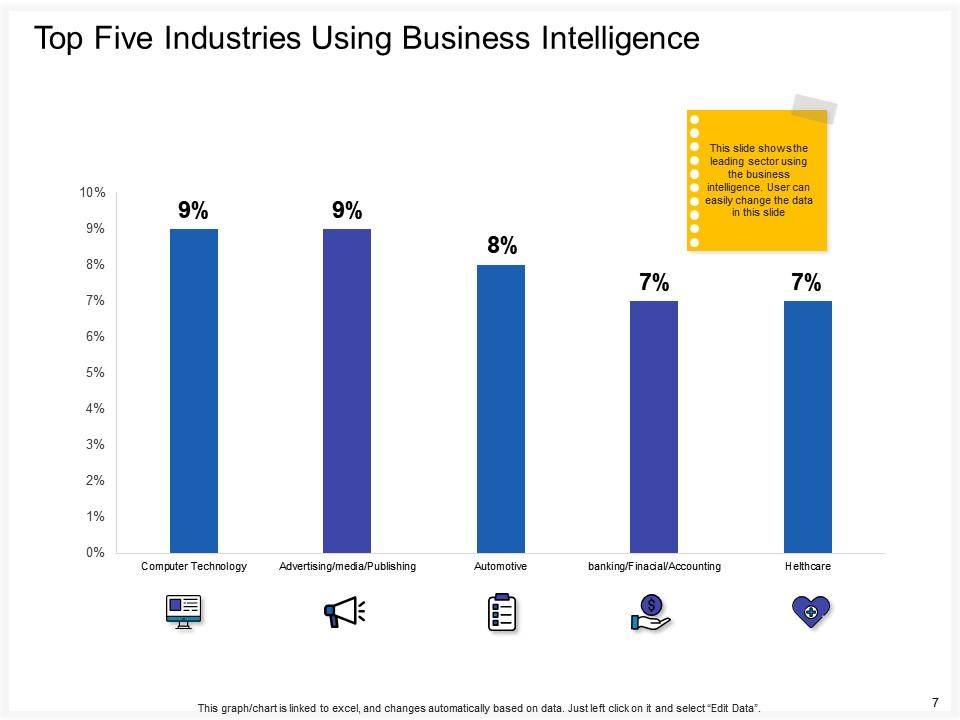
There are different kinds of industries that use business intelligence. These ready-to-use PPT slides help in demonstrating which industry uses it more. This template helps you to add industries like computer technology, advertising, media, publishing, automotive, banking, financial, accounting, and healthcare. Through the help of graphs and innovative icons, you can highlight the leading sector with business intelligence.
Template 5: Key Drivers
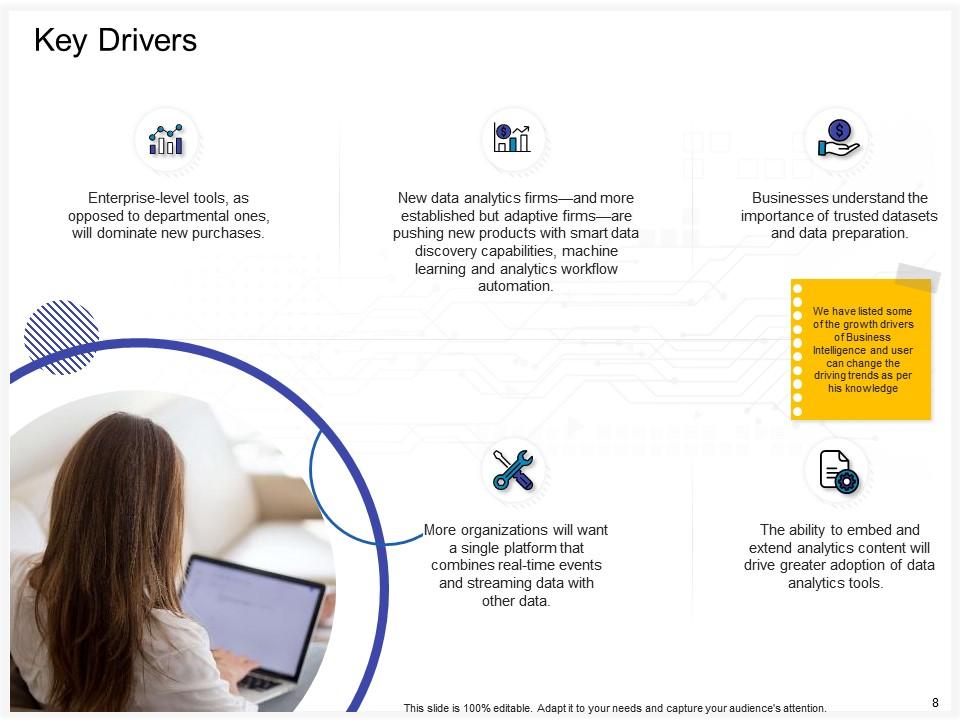
An organization must be aware of its growth drivers, and this template helps demonstrate that. There are some enterprise-level tools that certainly dominate the new purchases. These slides highlight the importance of trusted datasets and data preparation ability to embed and extend analytics content, organizations want a single platform that combines real-time events and streaming data with other data through creative icons.
Template 6: Business Intelligence Market Size
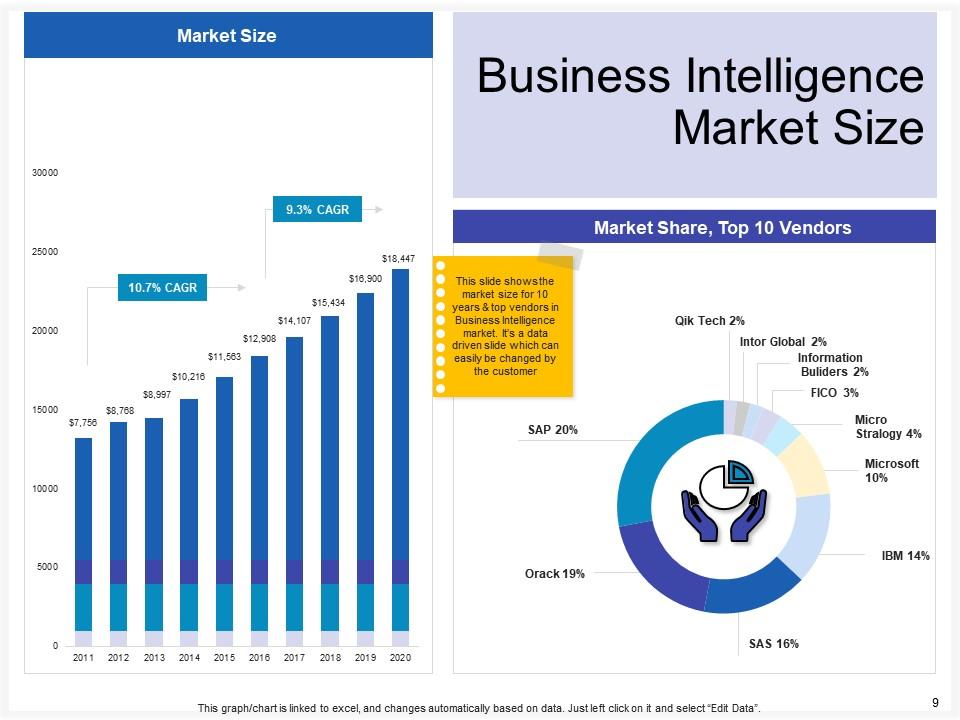
Demonstrate the market size of business intelligence with this specific template. This slide will allow you to highlight the Business Intelligence market size through attractive visuals and charts. The above image clearly shows the market size of BI. As these slides are editable, you can edit the market size according to your needs and the actual size at that time. You can also determine whether the market size of BI has increased or decreased through different years.
Template 7: Market Evolution in the Business Intelligence Industry
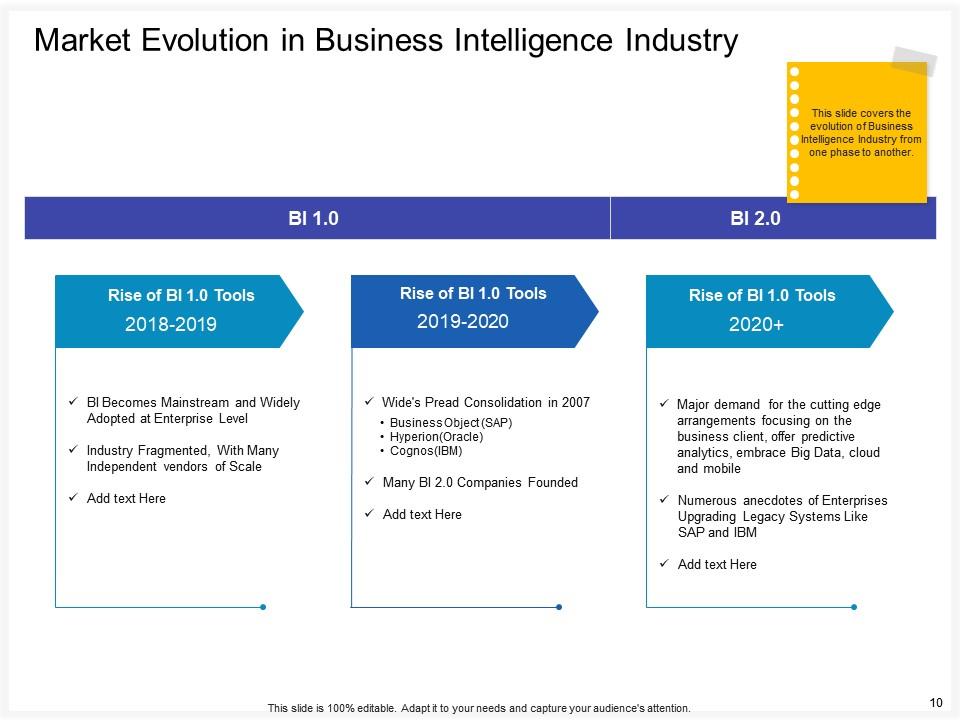
Evolution happens in everything, be it machines, humans, or business intelligence. This PPT template helps describe the rise in BI tools over the years. You can easily define the rise in different years in separate columns. You can easily discuss the evolution of BI in different phases. The impressive icons and attractive template design make the differentiation simple and easy to understand.
Template 8: How Business Intelligence Helps in Building Businesses
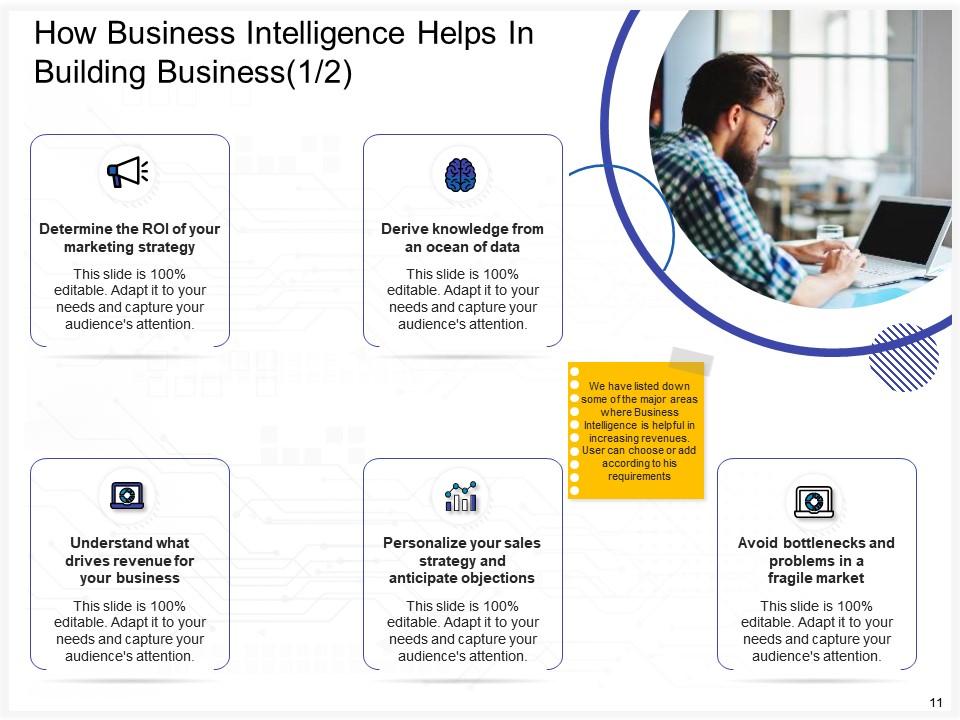
Business Intelligence plays a crucial role in building businesses, and this template helps demonstrate this. There are separate spaces that define how BI helps in building businesses. BI helps in understanding what drives revenue for your business, personalizing your sales strategy, avoiding problems in fragile markets, deriving knowledge from an ocean of data, and determining the ROI of your marketing strategy.
Template 9: How Business Intelligence Helps in Building Businesses
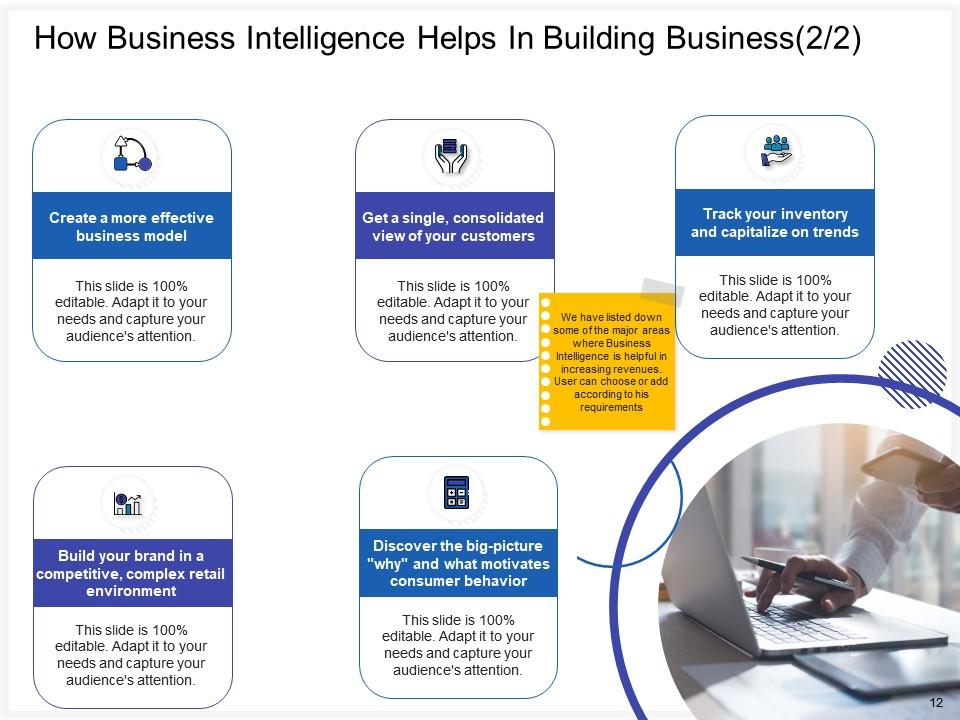
This is another template that defines the role of BI in building businesses. The BI helps in creating a more effective business model, getting consolidated views of customers, building brand in competitive, complex retail environment, discovering what motivates consumer behavior, and tracking inventory. The information can be easily understood through this ready-to-use creative template.
Template 10: Architecture Introduction
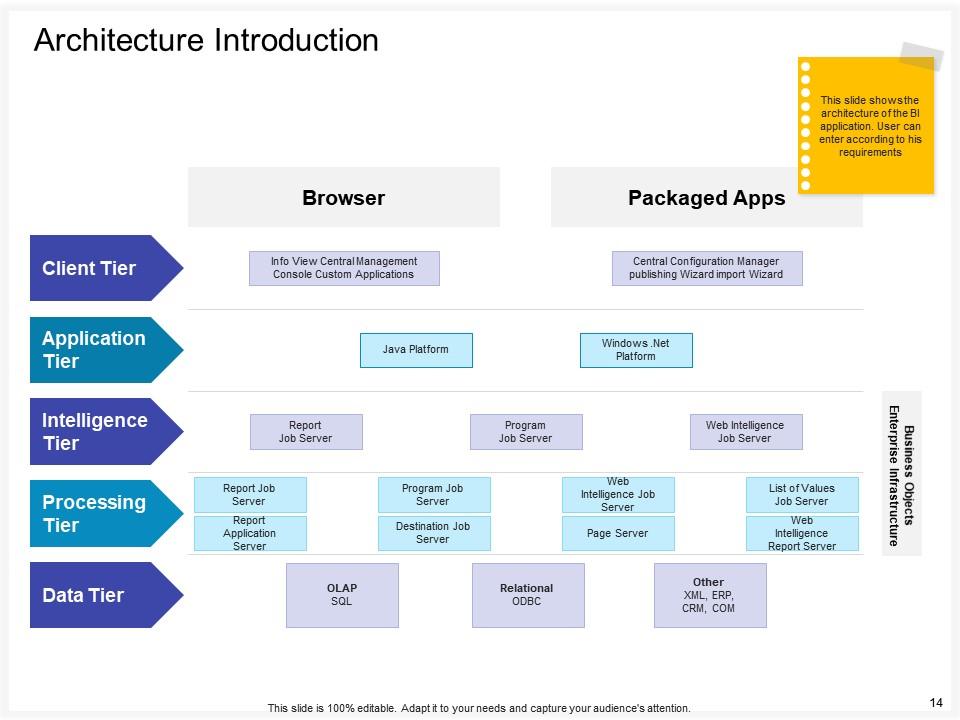
This template helps demonstrate the architectural plan of Business Intelligence according to requirements. Client tier, application tier, intelligence tier, processing tier, data tier, and other platforms and browsers like report job server, window platform, java platform, list of values job server, destination job server, and web intelligence job server can be easily demonstrated through this PPT template.
In conclusion, the power of data can be unleashed through data. Explore the fundamental concepts, tools, and techniques that enable businesses to transform raw data into insights. Our PPT slides will help expand your knowledge and act as a comprehensive guide to navigating the complex world of BI and Analytics. Get these slides to understand how to make data-driven decisions.
P.S. Download our Mini Project Charter for Business Intelligence Transformation PowerPoint PPT Template Bundles!!
Business intelligence and analytics powerpoint presentation slides with all 61 slides:
Use our Business Intelligence And Analytics Powerpoint Presentation Slides to effectively help you save your valuable time. They are readymade to fit into any presentation structure.
-
Easily Editable.
-
Awesome use of colors and designs in product templates.
-
Helpful product design for delivering presentation.
-
Innovative and attractive designs.
