Three months roadmap for data analytics with different phase
The data analytics roadmap templates we’ve shared with you today are a great way to get started planning your own data analysis strategy. With clear phases and detailed steps, these templates can help you map out your project and ensure that you don’t miss any important steps along the way. Plus, they come in handy PowerPoint slides so you can easily share them with team members or stakeholders. So what are you waiting for? Grab these amazing data analytics powerpoint templates now and start planning your successful data-driven future.
The data analytics roadmap templates we’ve shared with you today are a great way to get started planning your own data anal..
- Google Slides is a new FREE Presentation software from Google.
- All our content is 100% compatible with Google Slides.
- Just download our designs, and upload them to Google Slides and they will work automatically.
- Amaze your audience with SlideTeam and Google Slides.
-
Want Changes to This PPT Slide? Check out our Presentation Design Services
- WideScreen Aspect ratio is becoming a very popular format. When you download this product, the downloaded ZIP will contain this product in both standard and widescreen format.
-

- Some older products that we have may only be in standard format, but they can easily be converted to widescreen.
- To do this, please open the SlideTeam product in Powerpoint, and go to
- Design ( On the top bar) -> Page Setup -> and select "On-screen Show (16:9)” in the drop down for "Slides Sized for".
- The slide or theme will change to widescreen, and all graphics will adjust automatically. You can similarly convert our content to any other desired screen aspect ratio.
Compatible With Google Slides

Get This In WideScreen
You must be logged in to download this presentation.
PowerPoint presentation slides
Presenting Three Months Roadmap For Data Analytics With Different Phase PowerPoint Template. This PPT presentation is Google Slides compatible hence it is easily accessible. You can download and save this PowerPoint layout in different formats like PDF, PNG, and JPG. This PPT theme is available in both 4,3 and 16,9 aspect ratios. This PowerPoint template is customizable so you can modify the font size, font type, color, and shapes as per your requirements.
People who downloaded this PowerPoint presentation also viewed the following :
Content of this Powerpoint Presentation
Description:
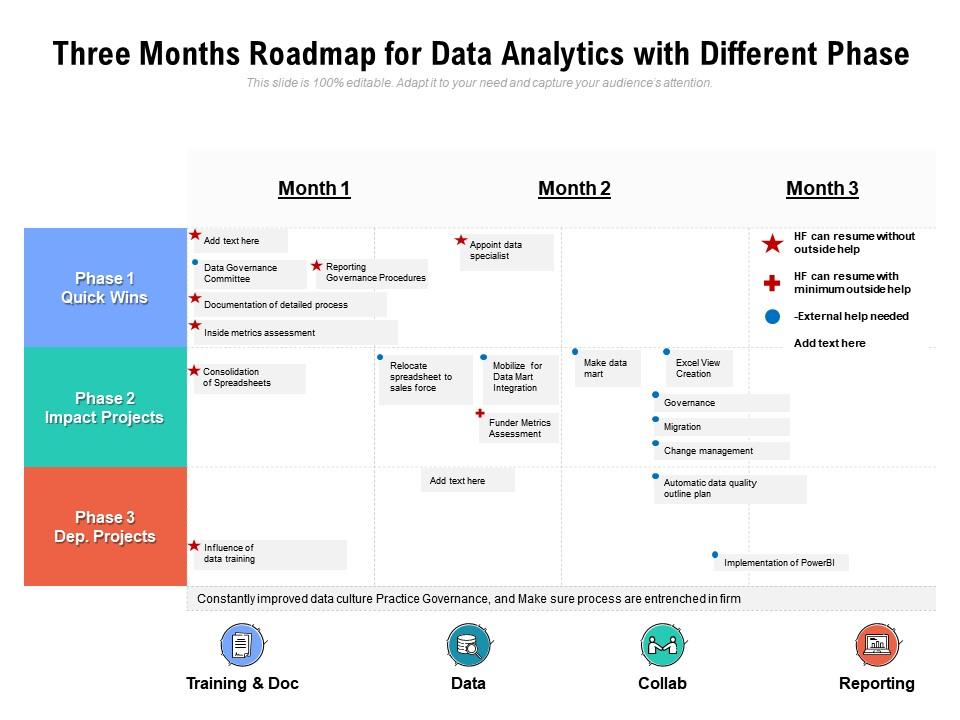
The image shows a PowerPoint slide titled "Three Months Roadmap for Data Analytics with Different Phases," which is organized into three main columns representing three months. Each month is associated with different phases of a project or strategy in data analytics.
Month 1 focuses on "Quick Wins," including establishing a data governance committee, reporting governance procedures, detailed process documentation, and internal metrics assessment. It suggests immediate actions that can provide visible improvements.
Month 2 moves onto "Impact Projects," like appointing a data specialist, mobilizing for Data Mart integration, and making a data mart. These tasks aim for more strategic and impactful outcomes.
Month 3 is about "Dep. Projects," with actions such as HR being able to resume with minimum outside help and implementation of PowerBI. It shows a progression towards more dependent, complex projects that require more resources or external help.
Use Cases:
Industries where this slide could be effectively used:
1. Technology:
Use: Implementing data analytics initiatives.
Presenter: Data Analyst.
Audience: Project Team.
2. Healthcare:
Use: Enhancing data governance and patient data analysis.
Presenter: Healthcare Administrator.
Audience: Medical Staff, IT Department.
3. Finance:
Use: Streamlining financial reporting and compliance.
Presenter: Financial Controller.
Audience: Finance Team, Regulators.
4. Retail:
Use: Improving inventory and customer data management.
Presenter: Retail Manager.
Audience: Marketing and Inventory Teams.
5. Education:
Use: Analyzing student data for improved outcomes.
Presenter: Educational Researcher.
Audience: Academic Staff, School Board.
6. Manufacturing:
Use: Optimizing production through data analysis.
Presenter: Operations Manager.
Audience: Production and Quality Assurance Teams.
7. Government:
Use: Managing public data and service effectiveness.
Presenter: Policy Analyst.
Audience: Public Service Managers, Stakeholders.
Three months roadmap for data analytics with different phase with all 2 slides:
Use our Three Months Roadmap For Data Analytics With Different Phase to effectively help you save your valuable time. They are readymade to fit into any presentation structure.
-
Visually stunning presentation, love the content.
-
Perfect template with attractive color combination.


