

Top 10 Asian paints financial ratio analysis ppt PowerPoint Presentation Templates in 2026
The Asian Paints Financial Ratio Analysis PPT is a comprehensive presentation designed to provide insights into the financial performance of Asian Paints, one of the leading paint companies in Asia. This PPT serves as a vital resource for stakeholders, including investors, analysts, and management, by offering a detailed examination of key financial ratios that reflect the company's operational efficiency, profitability, liquidity, and solvency. By utilizing this PPT, users can effectively analyze metrics such as the current ratio, quick ratio, return on equity, and debt-to-equity ratio, among others. Each ratio is presented with clear definitions, calculations, and interpretations, enabling users to grasp the financial health of Asian Paints quickly. The customizable nature of the PPT allows users to tailor the content to their specific needs, incorporating additional data, charts, and graphs that highlight trends over time. This presentation can be utilized in various scenarios, including investor meetings, financial workshops, and academic settings, making it a versatile tool for anyone looking to understand the financial dynamics of Asian Paints. With its user-friendly design and informative content, the Financial Ratio Analysis PPT is an essential asset for informed decision-making and strategic planning.


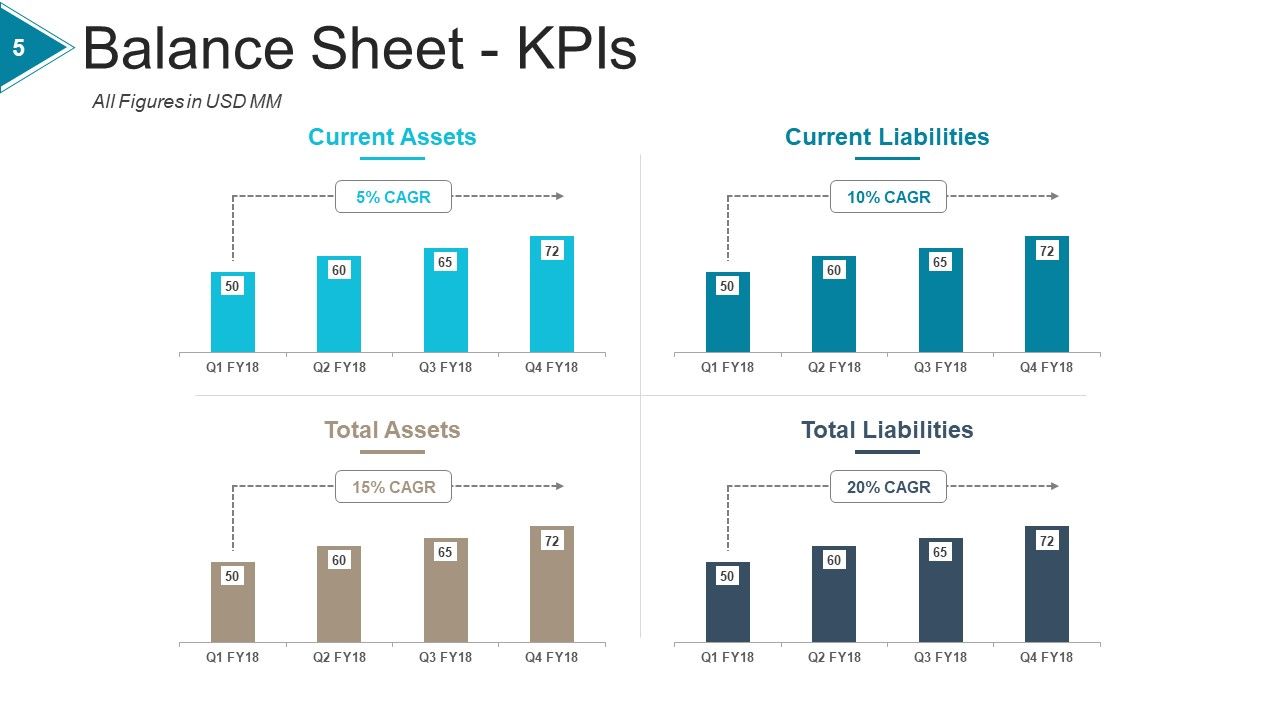


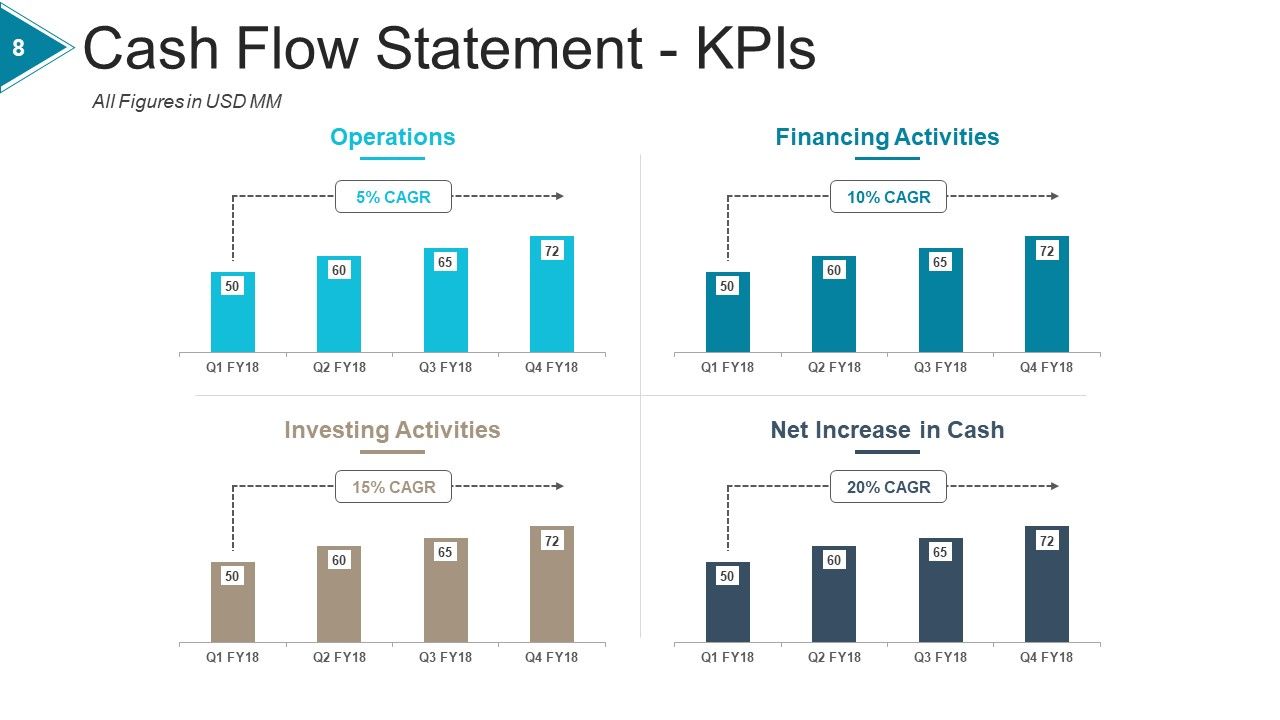
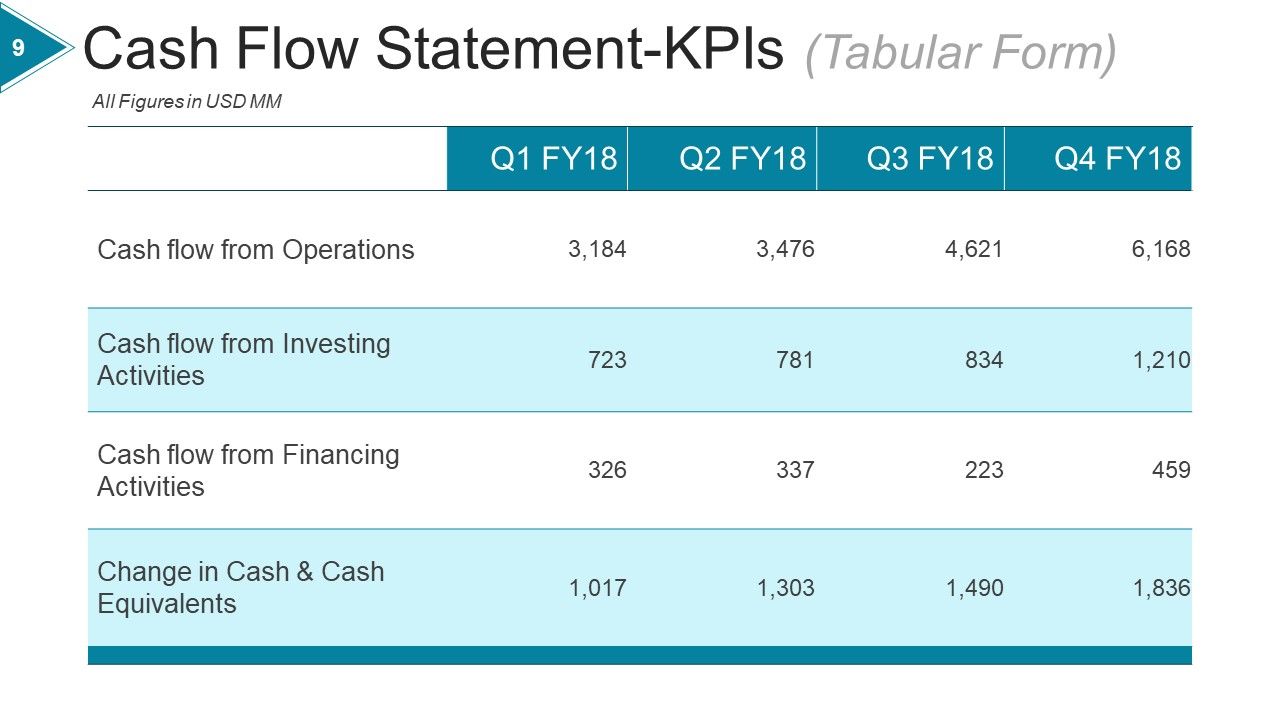


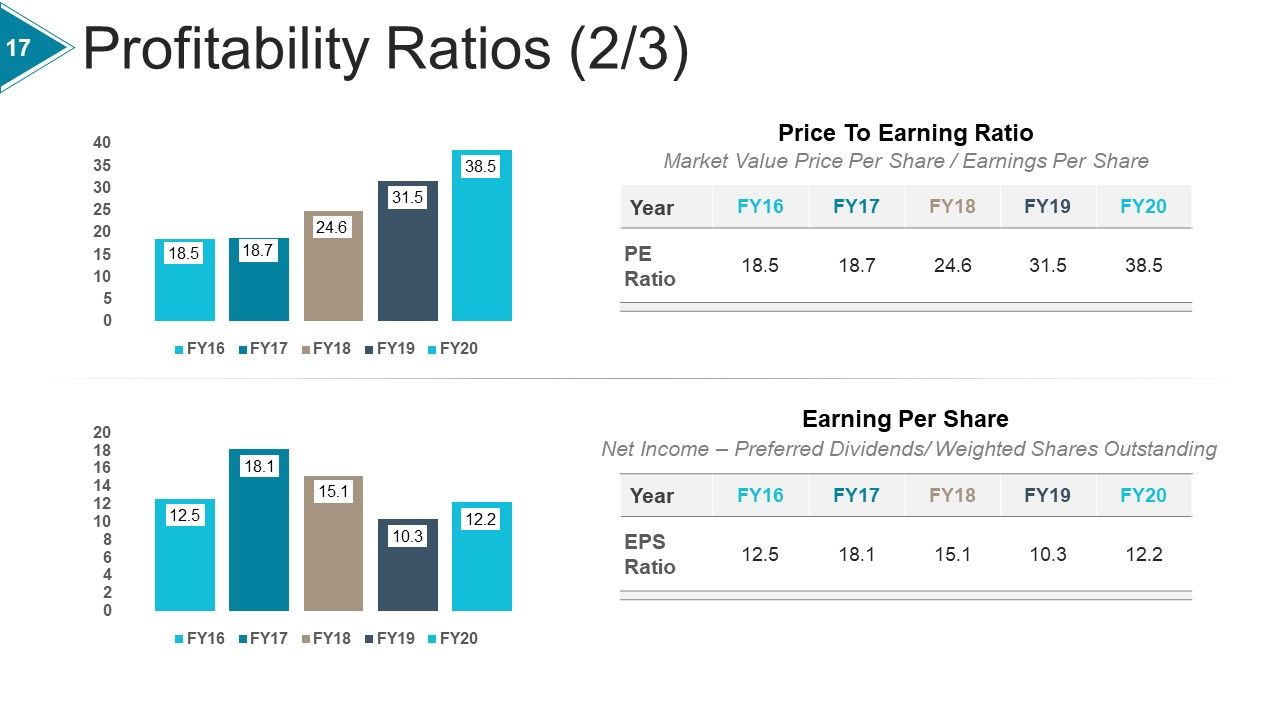


Financial Ratio Analysis Powerpoint Presentation Slides
Presenting Financial Ratio Analysis PowerPoint Presentation Slides. Pictures do no blur out even when they are projected on large screen. PPT icons can be utilized by sales and marketing teams and business managers. Immediately downloadable slide and supports formats like JPEG and PDF. Fully adjusted with Google slides. Easy to add company logo, trademark or name. Modify colors, text and fonts as per your business requirements.

Try Before you Buy Download Free Sample Product
 Save Hours of Time
 100% Editable
 Compatible with Google Slides
-
Product Description

-
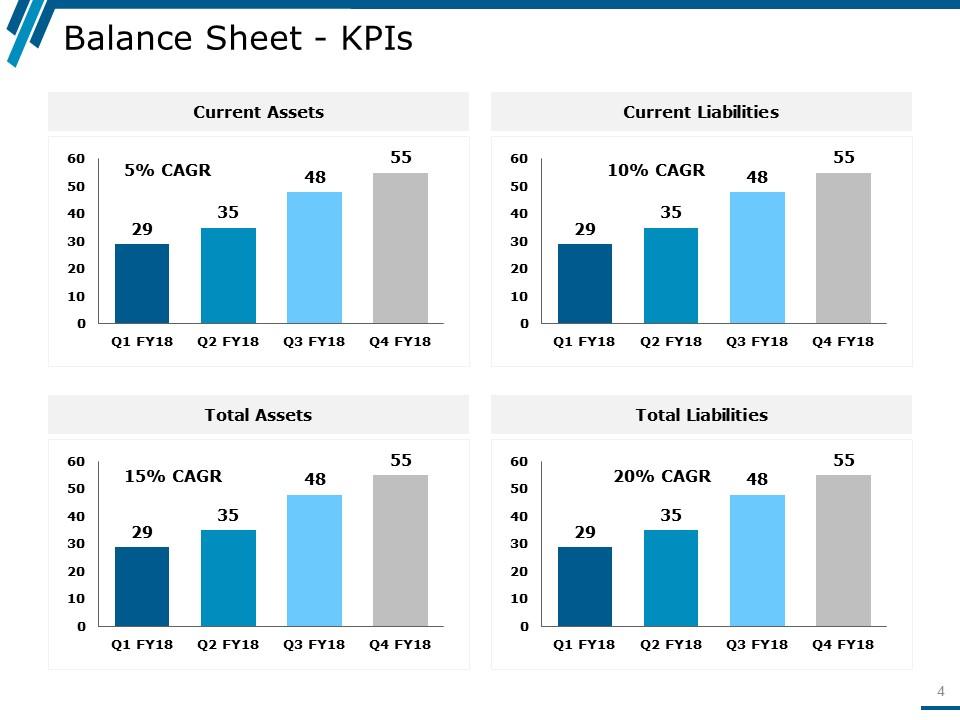
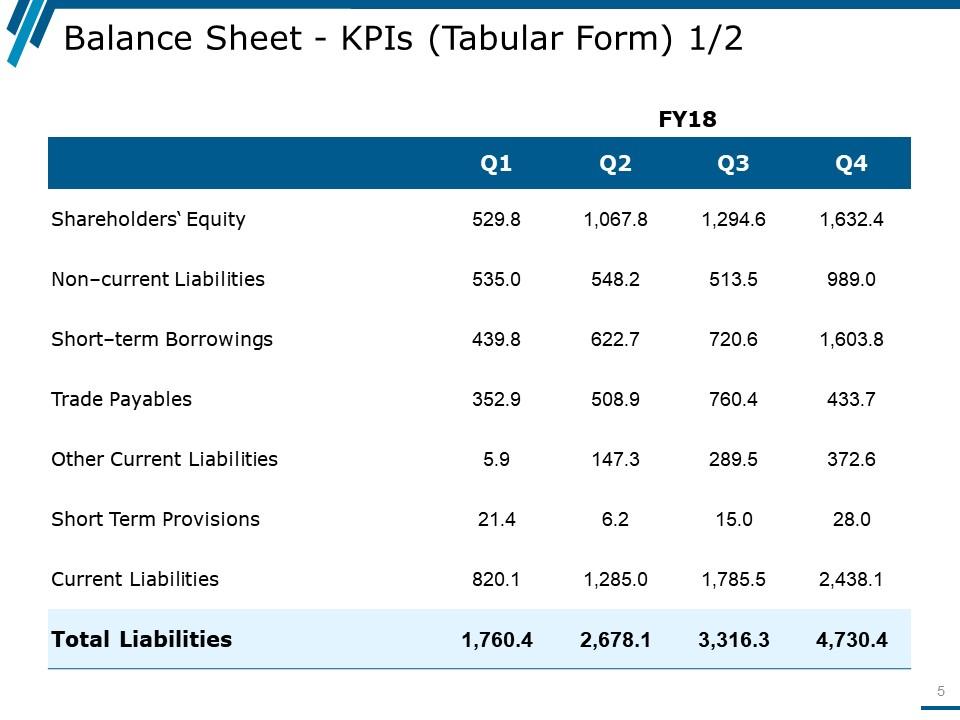
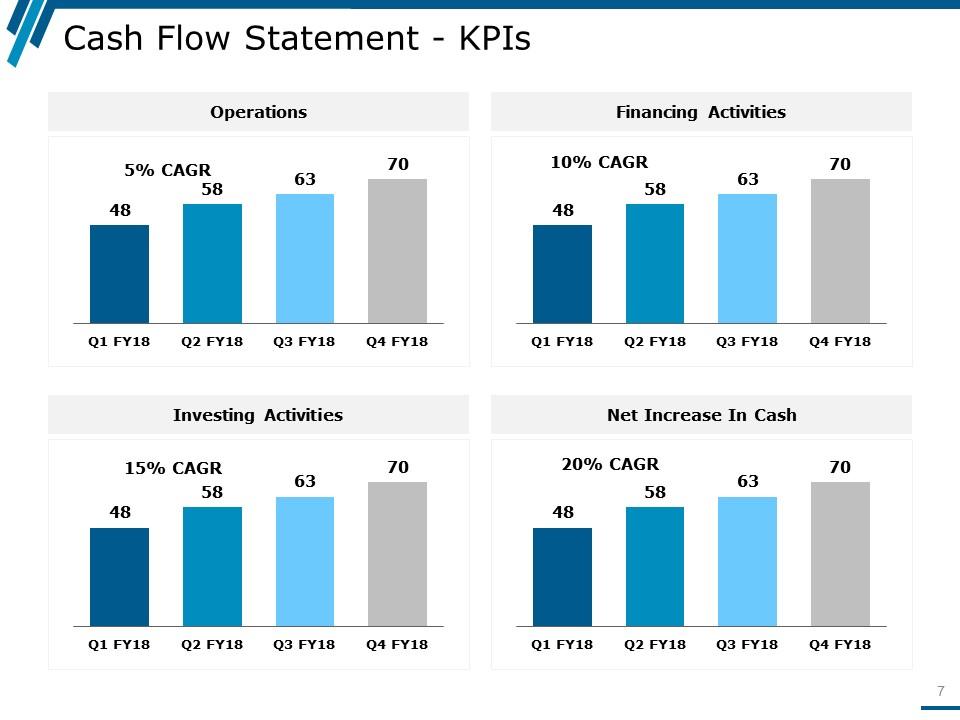
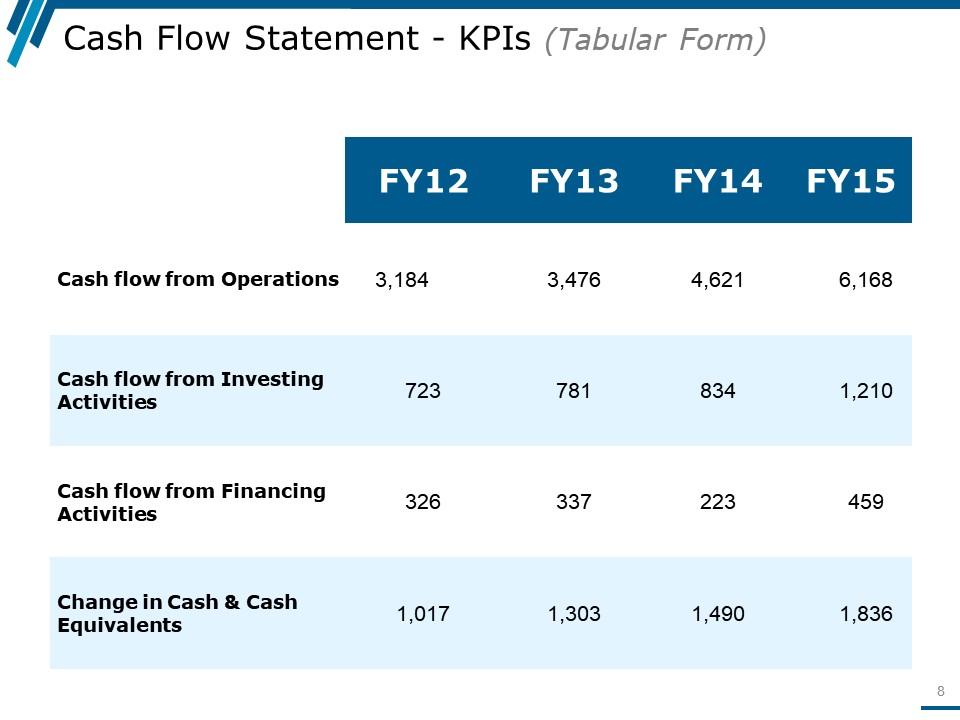
Whenever you want to inform about your financial updates and projections to management and stakeholders, you have the perfect answer to choose from our financial ratio analysis PowerPoint presentation slides. This Financial Ratio Analysis presentation slide has been crafted by our team of artists to accommodate your need to represent financial details like balance sheet of your company, financial achievements of company, liabilities of company, income and profit and loss statements. This multi icons-based template can be used to update wide variety of information to clients and investors such as your financial projections, companies’ achievements and income statement analysis on yearly basis or monthly basis. Financial ratio analysis PPT template is useful to showcase your business strategy, comparison of business income reports, balance sheet updates, profitability, liquidity updates and activity ratios. This financial ratio presentation covers many areas related to financial, general business overview, funding updates or financial dashboards of your enterprise. Acquire an effective counter with our Financial Ratio Analysis Powerpoint Presentation Slides. They are good for convincing critics.
-
Related keywords


Akzo nobel decorative paints net revenue 2014-2018
This is a professionally designed visual chart for Akzo Nobel Decorative Paints Net Revenue 2014 to 2018. This is part of our Data and Statistics products selection, and you will need a Paid account to download the actual report with accurate data and sources. Downloaded report will contain the editable graph with accurate data, an excel table with the actual data, the exact source of the data and the release date. This slide provides a graph of Business Segment Decorative Paints business Net Revenue in JPY MM of Akzo Nobel N.V. for the years 2014 to 2018. Download it immediately and use it for your business.
Try Before you Buy Download Free Sample Product
Save Hours of Time
100% Editable
Compatible with Google Slides
-
Product Description
-
This slide provides a graph of Business Segment Decorative Paints business Net Revenue in JPY MM of Akzo Nobel N.V. for the years 2014 to 2018.
-
Related keywords


Types financial ratio analysis ppt powerpoint presentation pictures introduction cpb
Presenting Types Financial Ratio Analysis Ppt Powerpoint Presentation Pictures Introduction Cpb slide which is completely adaptable. The graphics in this PowerPoint slide showcase two stages that will help you succinctly convey the information. In addition, you can alternate the color, font size, font type, and shapes of this PPT layout according to your content. This PPT presentation can be accessed with Google Slides and is available in both standard screen and widescreen aspect ratios. It is also a useful set to elucidate topics like Types Financial Ratio Analysis. This well-structured design can be downloaded in different formats like PDF, JPG, and PNG. So, without any delay, click on the download button now.
Try Before you Buy Download Free Sample Product
Save Hours of Time
100% Editable
Compatible with Google Slides
-
Product Description
-
Our Types Financial Ratio Analysis Ppt Powerpoint Presentation Pictures Introduction Cpb are topically designed to provide an attractive backdrop to any subject. Use them to look like a presentation pro.
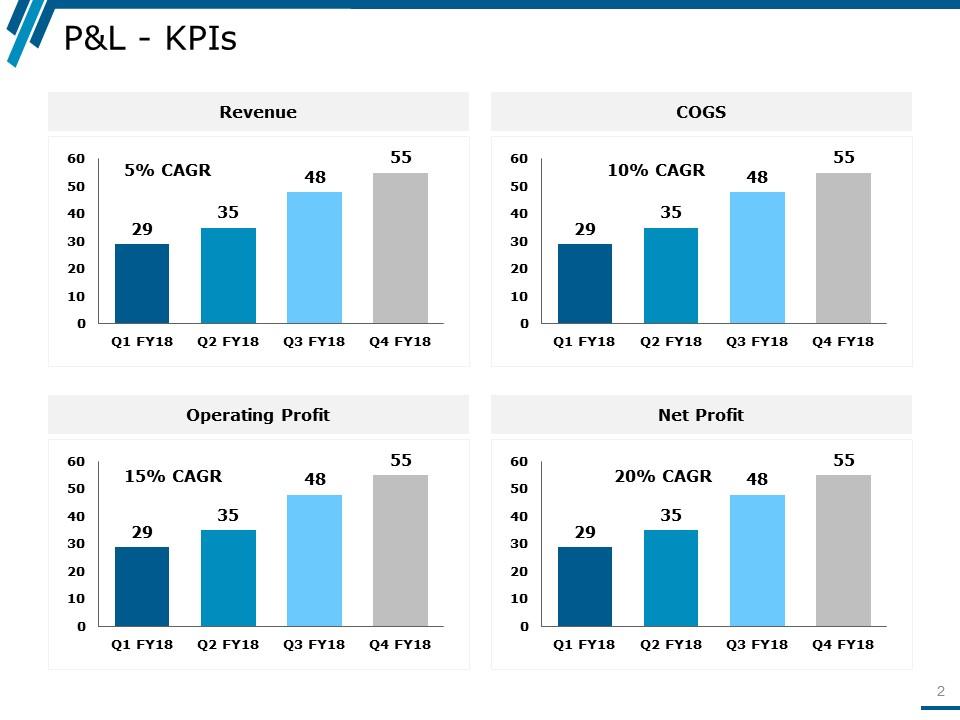
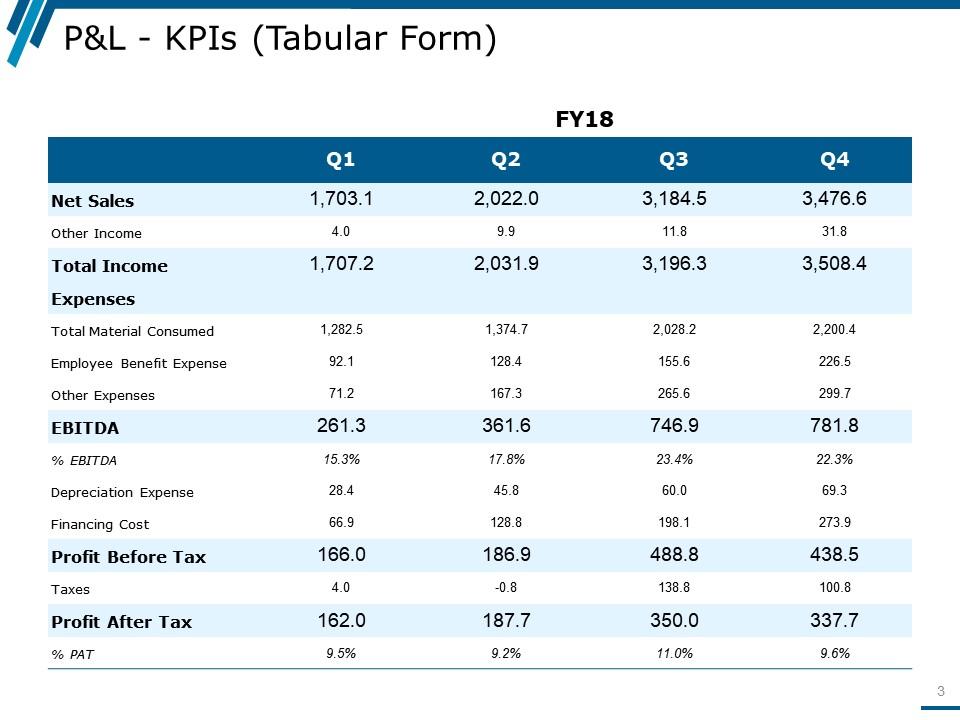

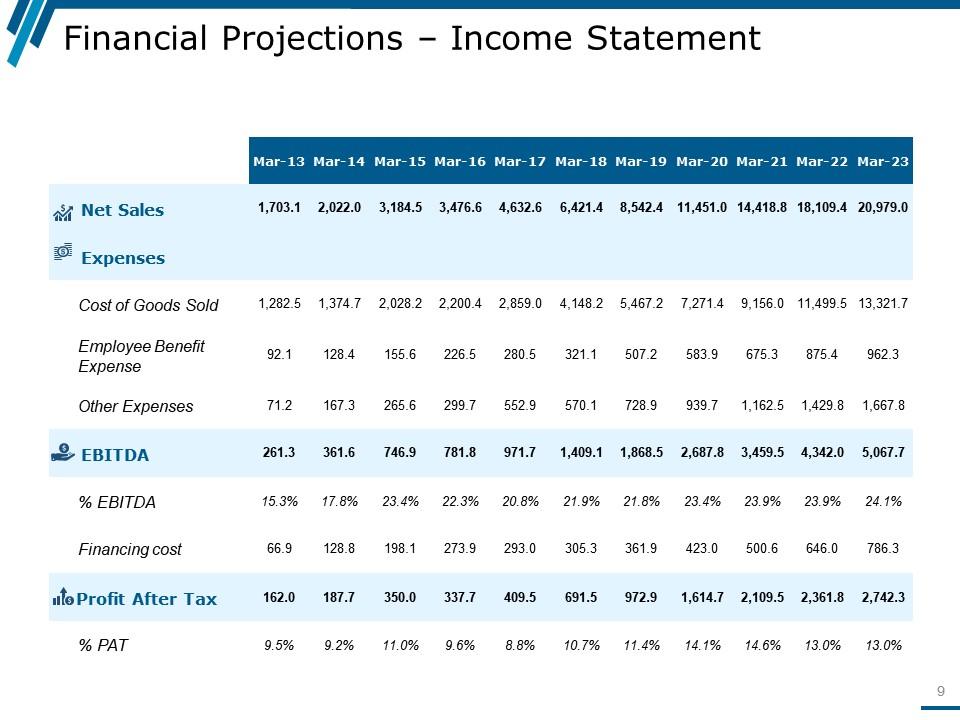
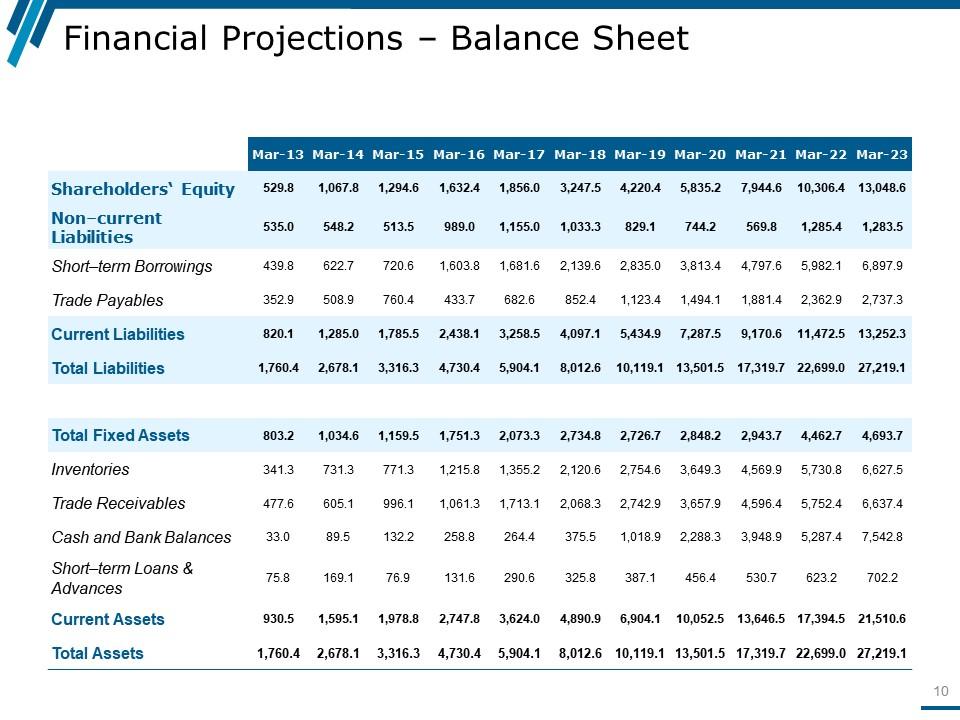
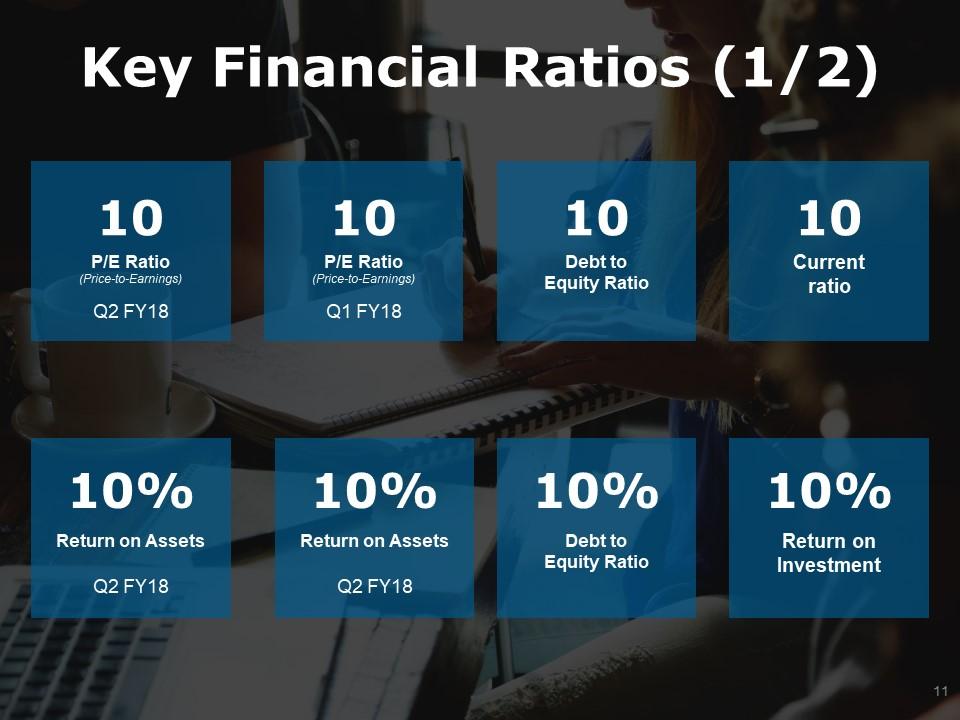
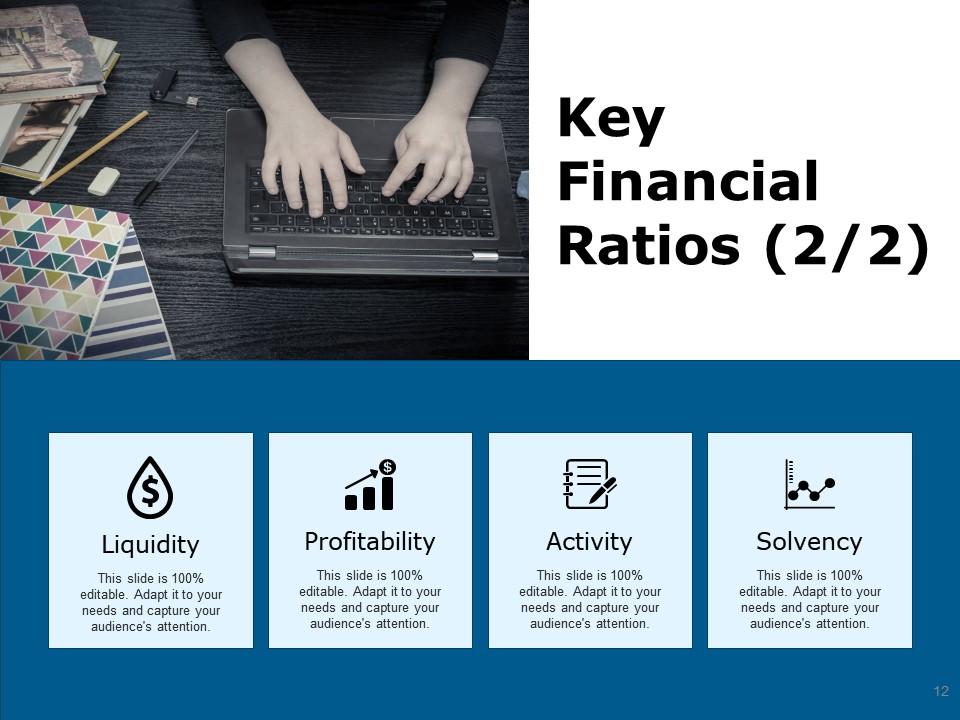
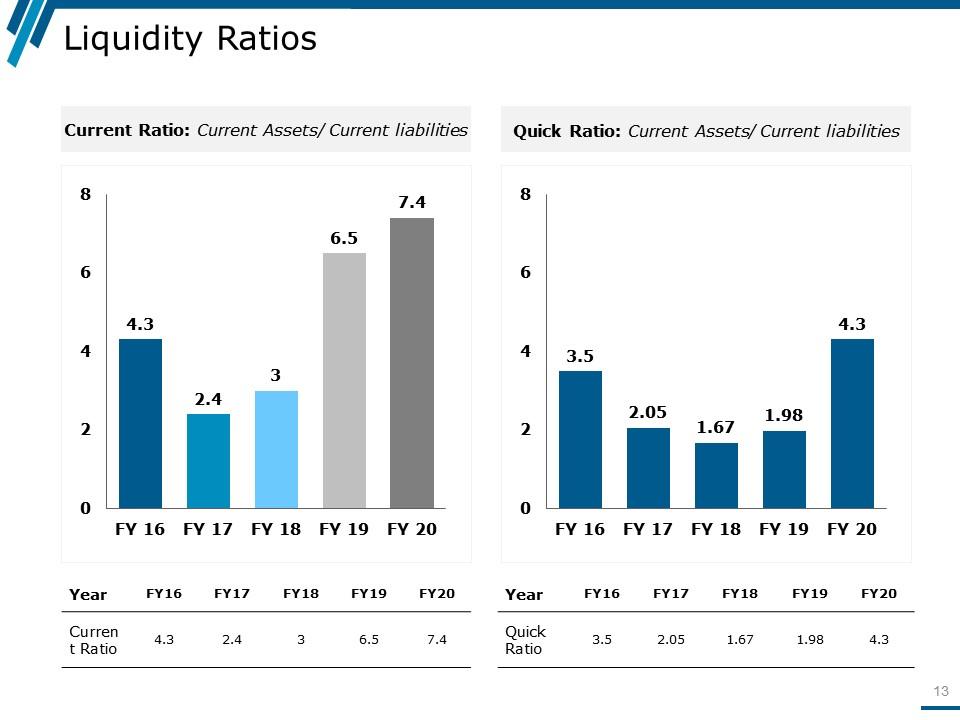
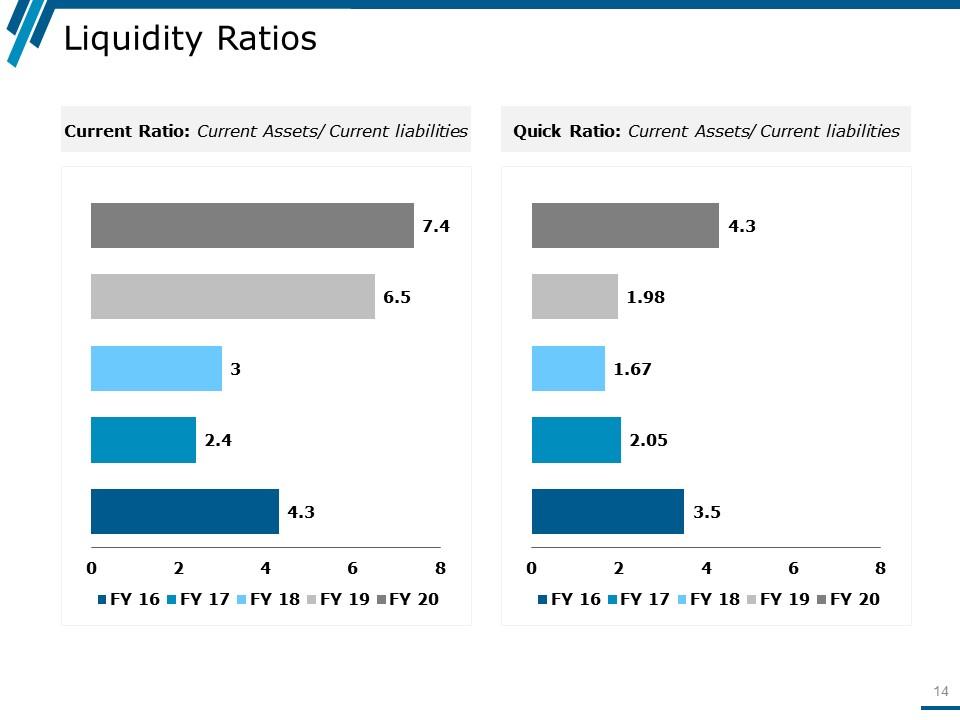
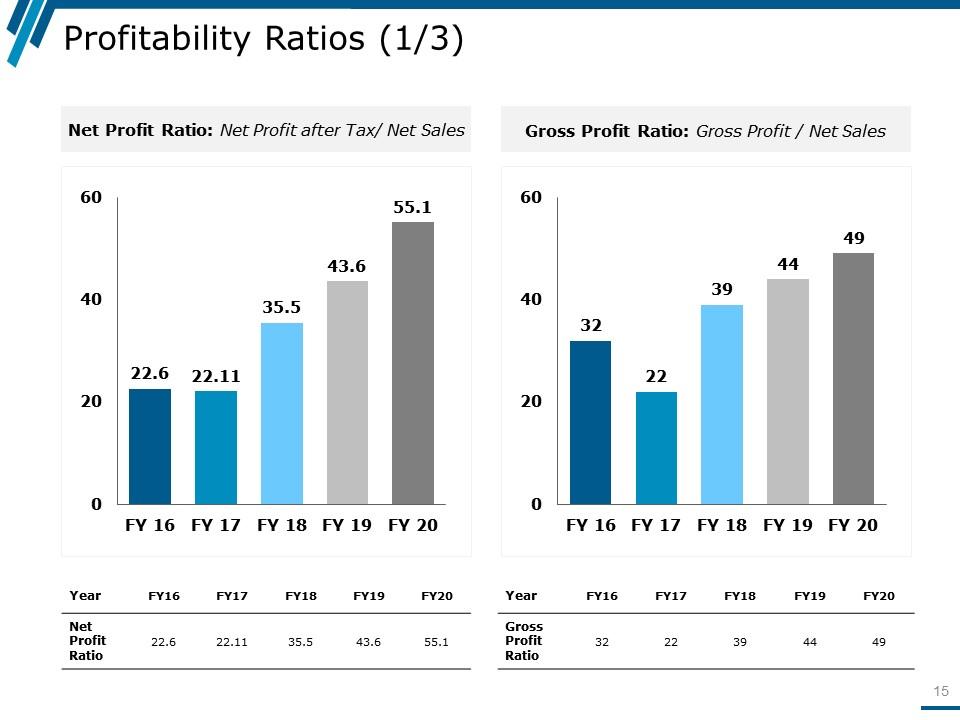
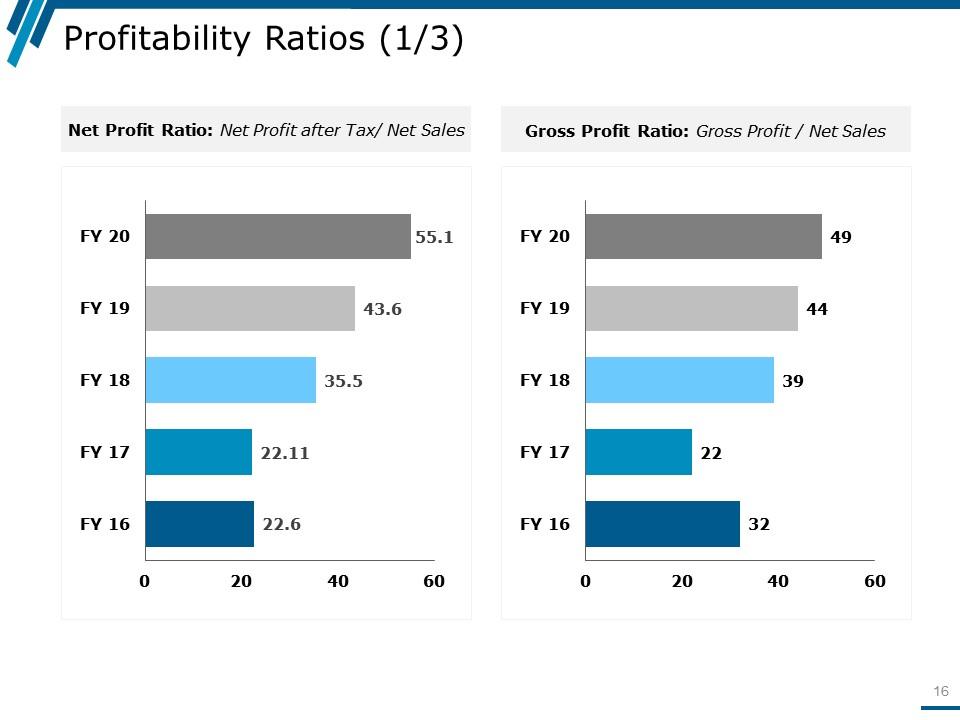
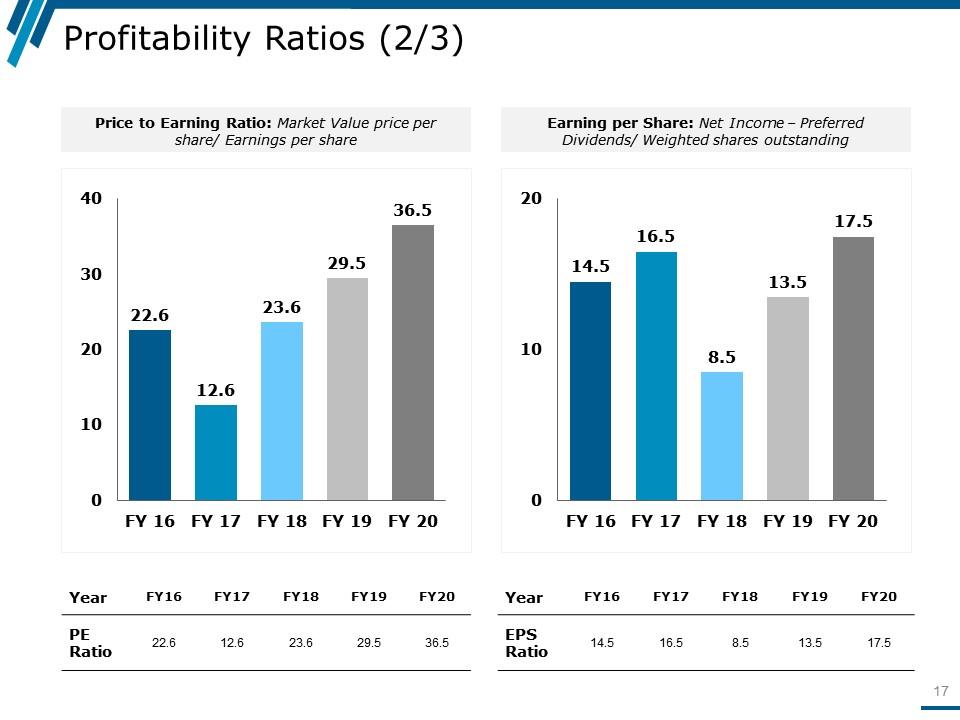
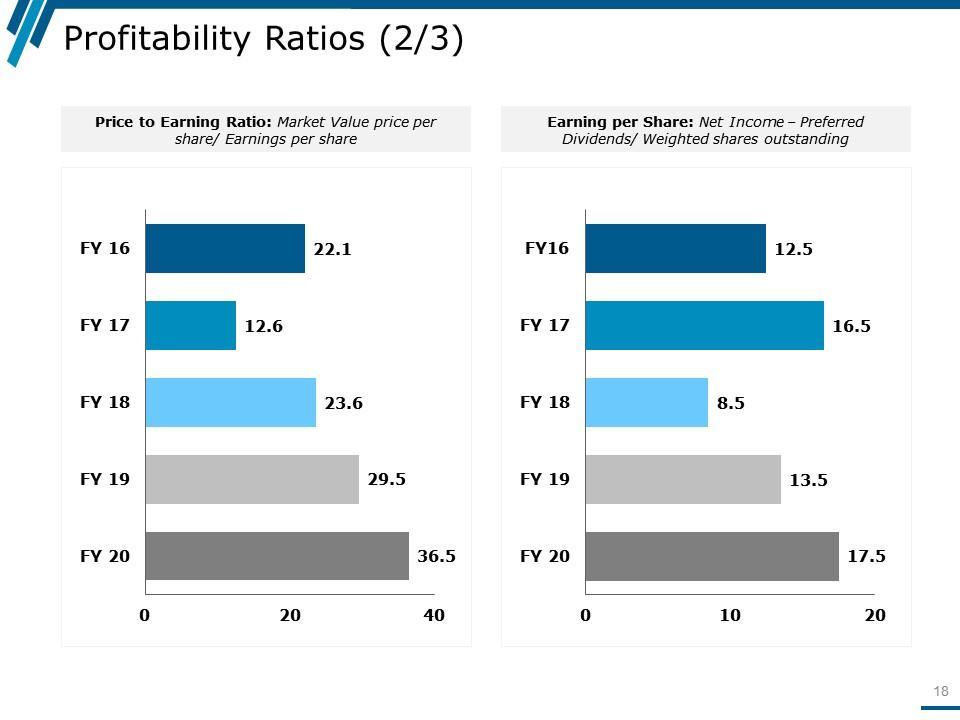
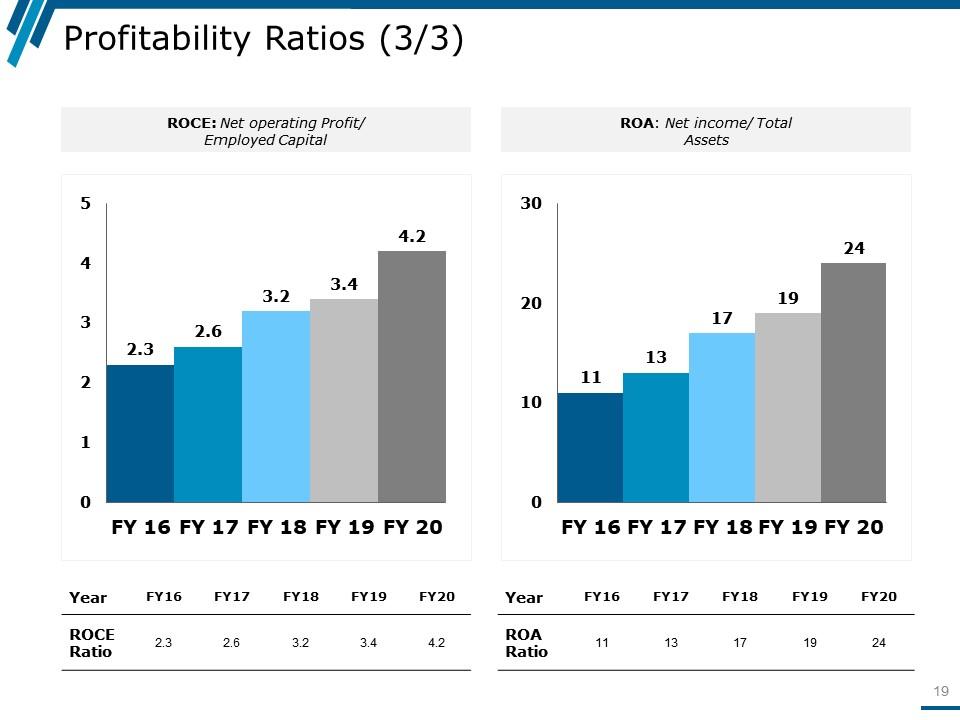

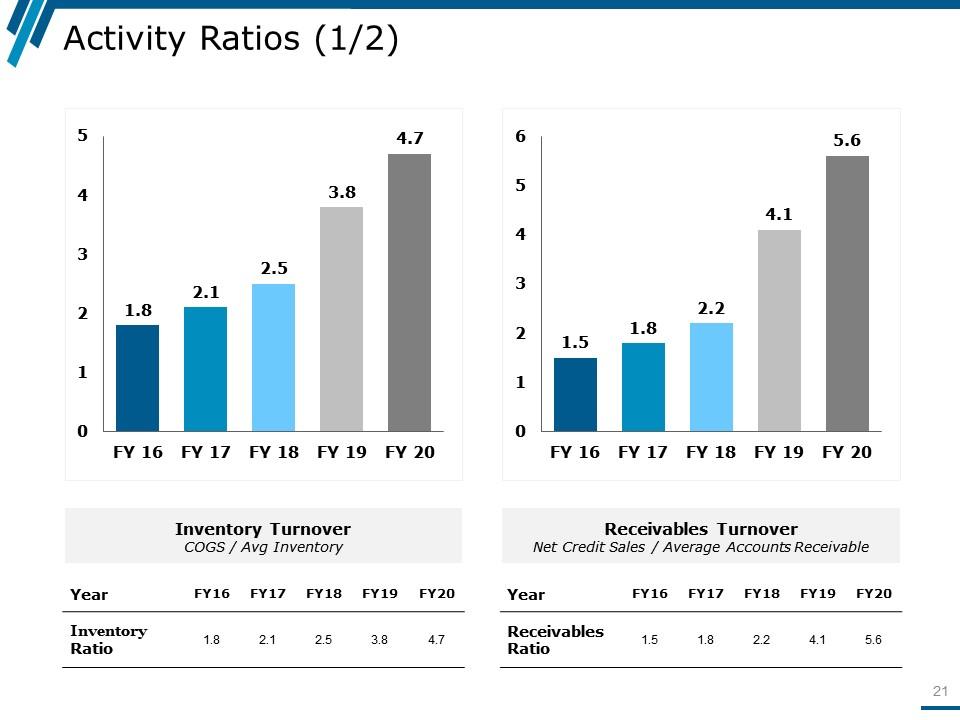
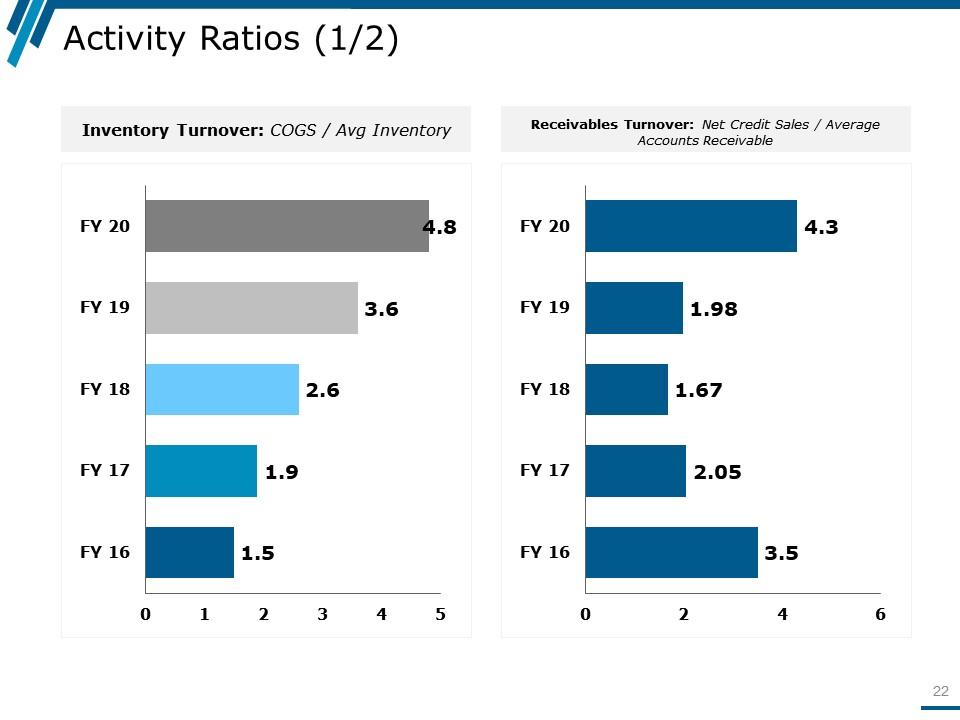
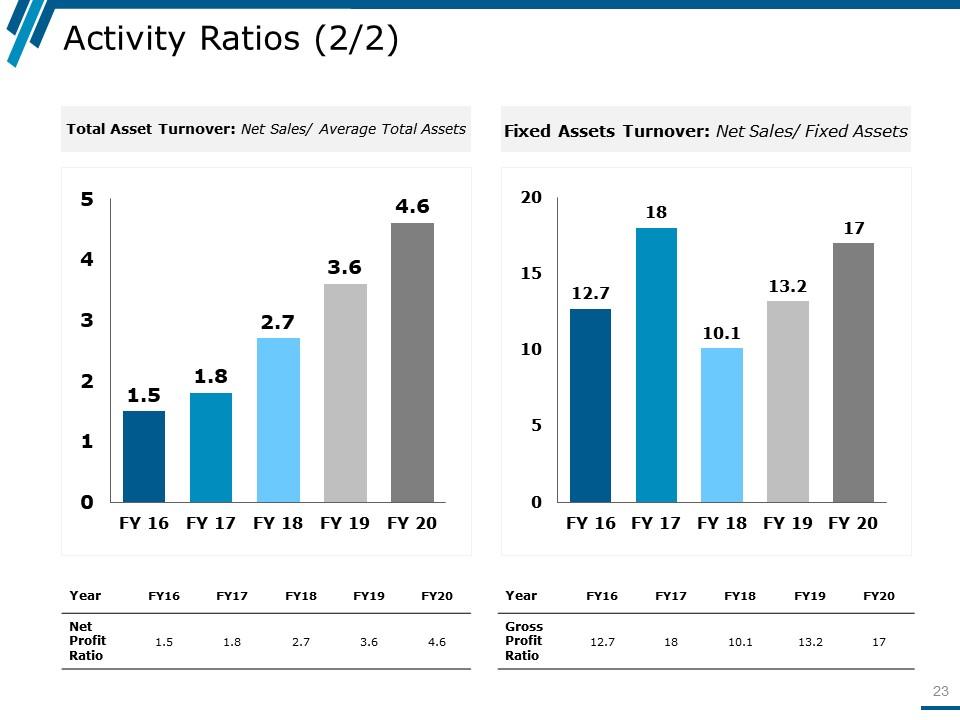
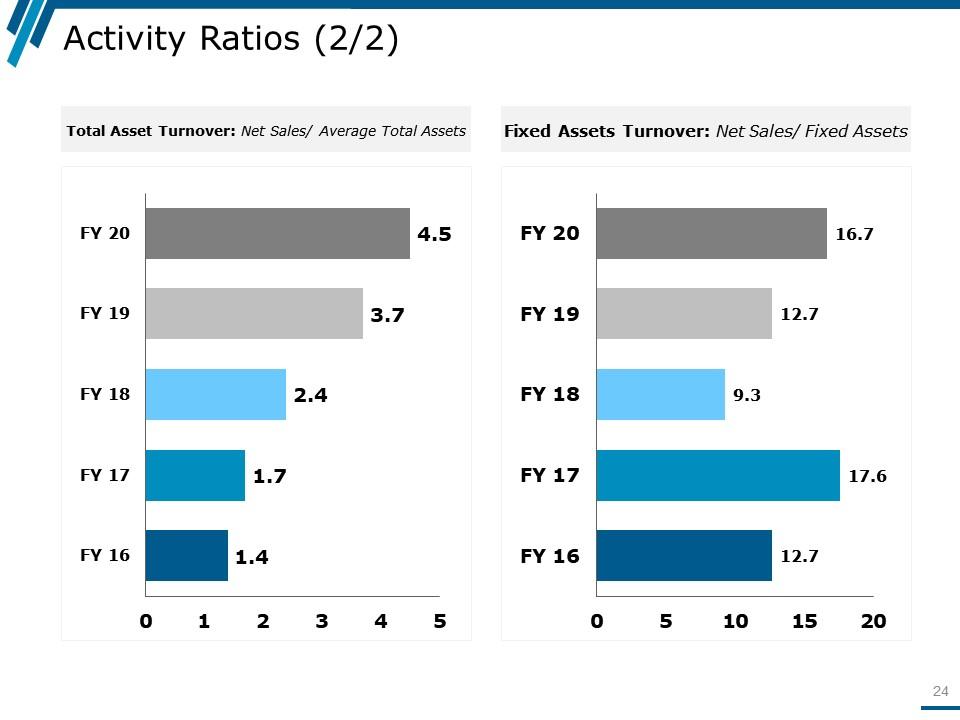
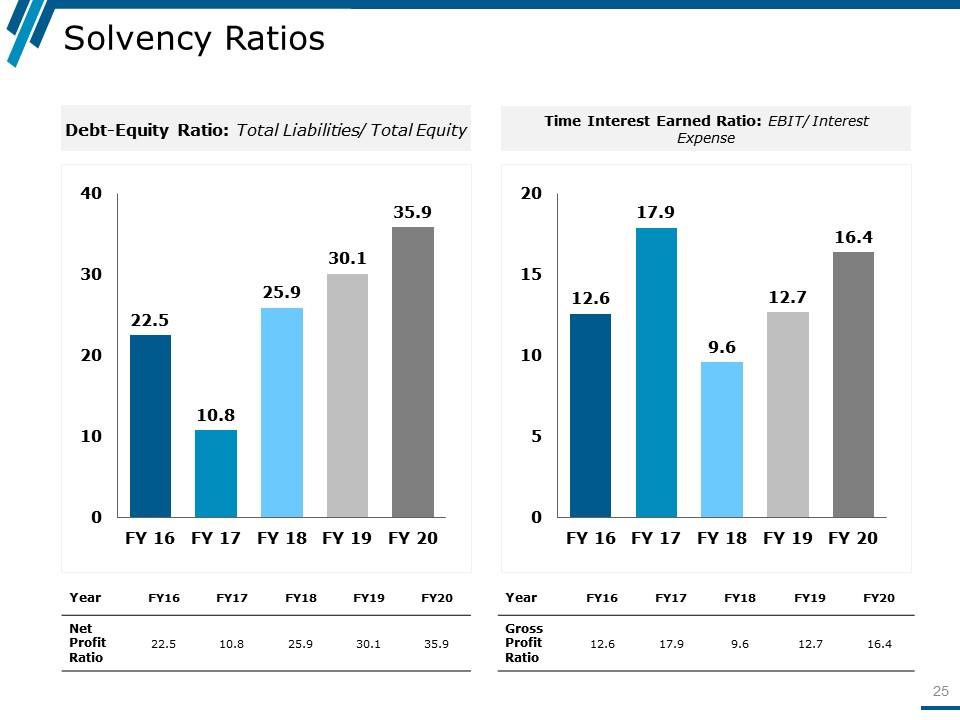
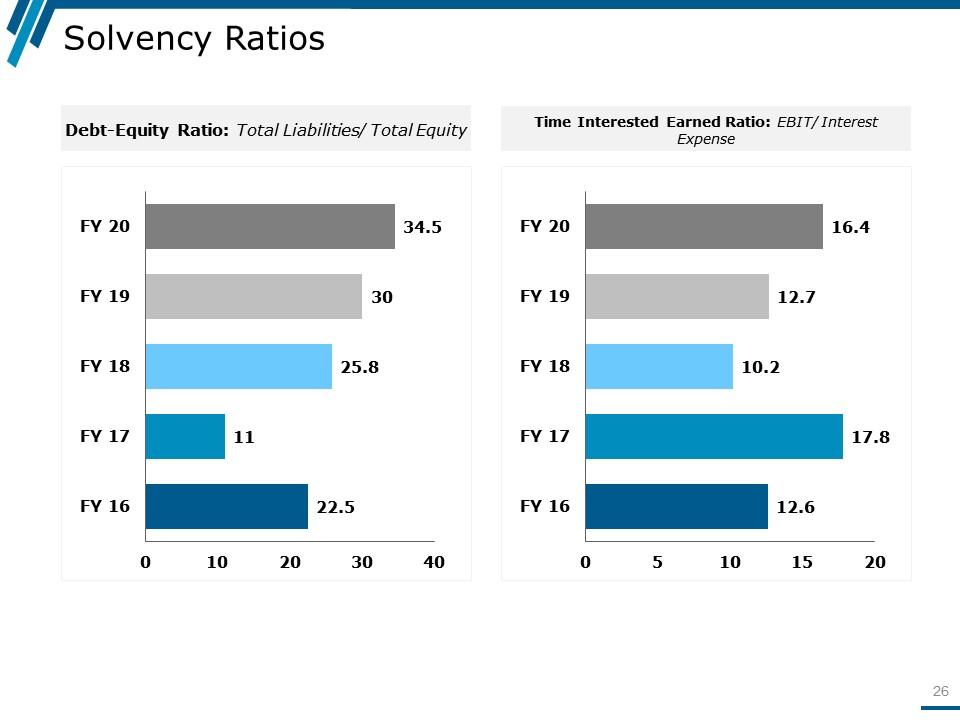
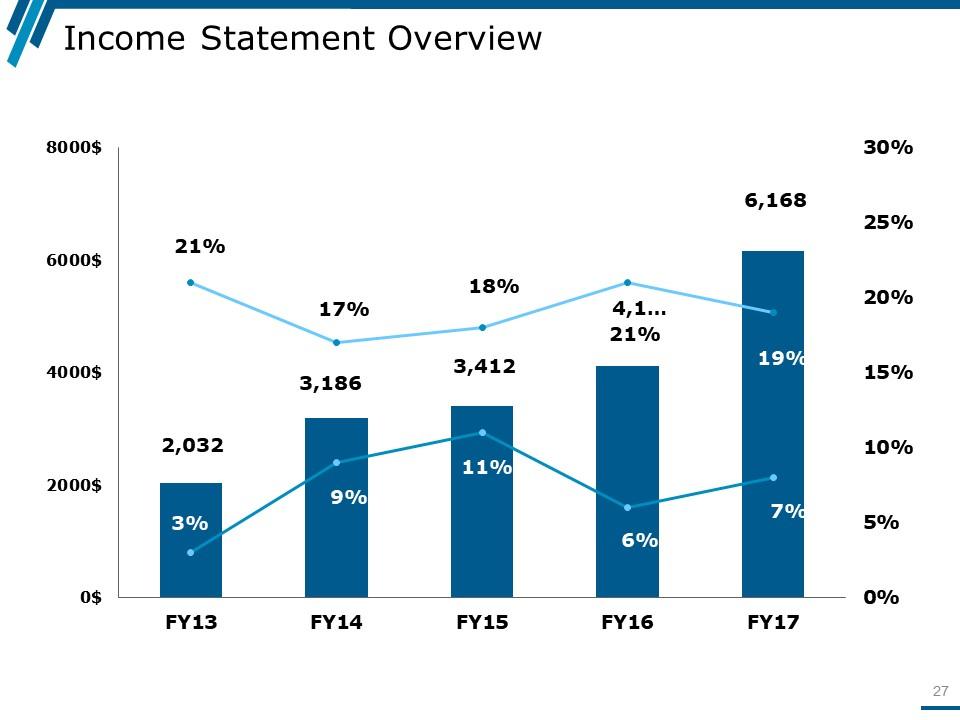
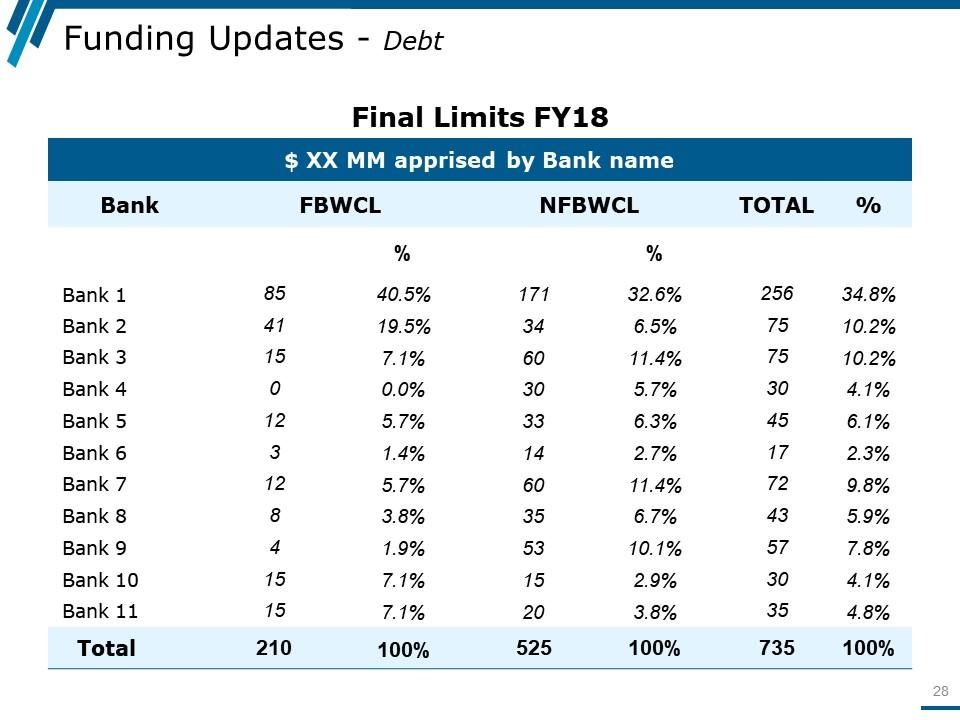
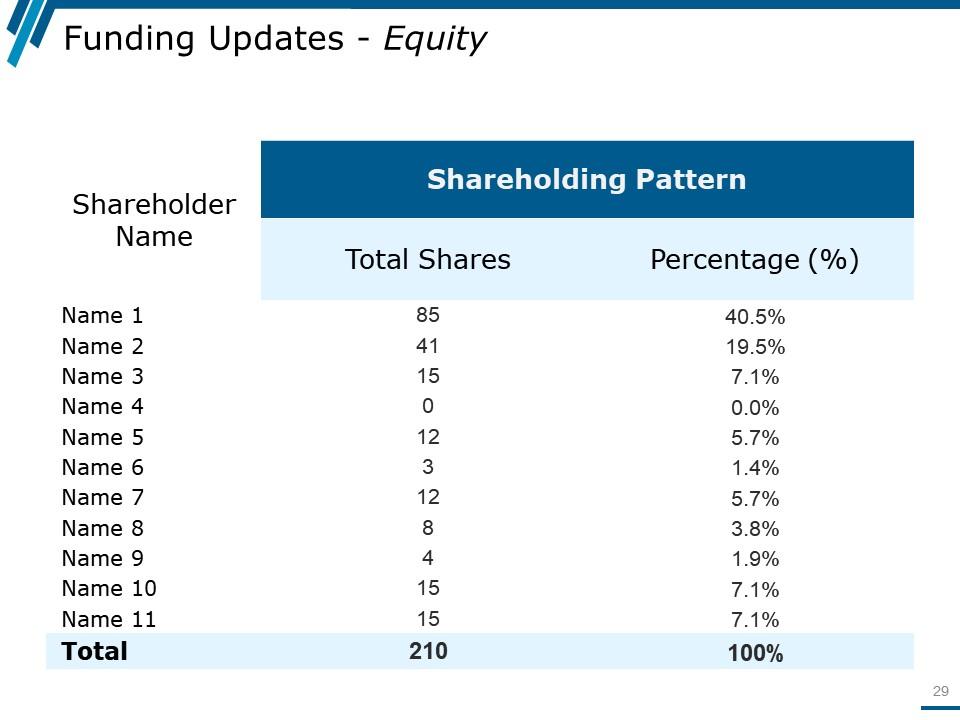


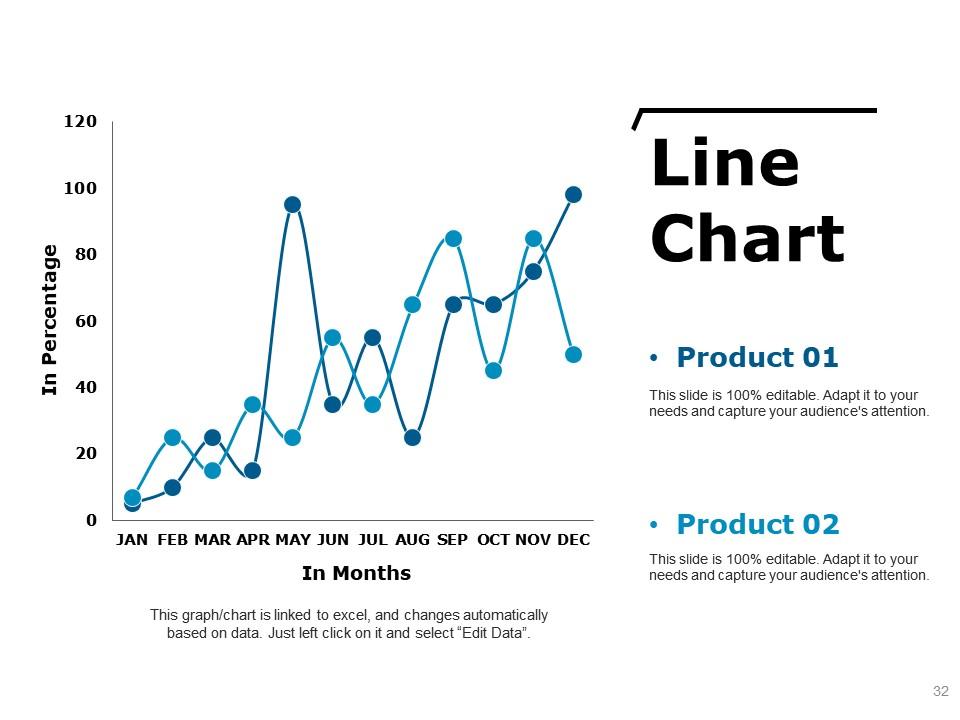
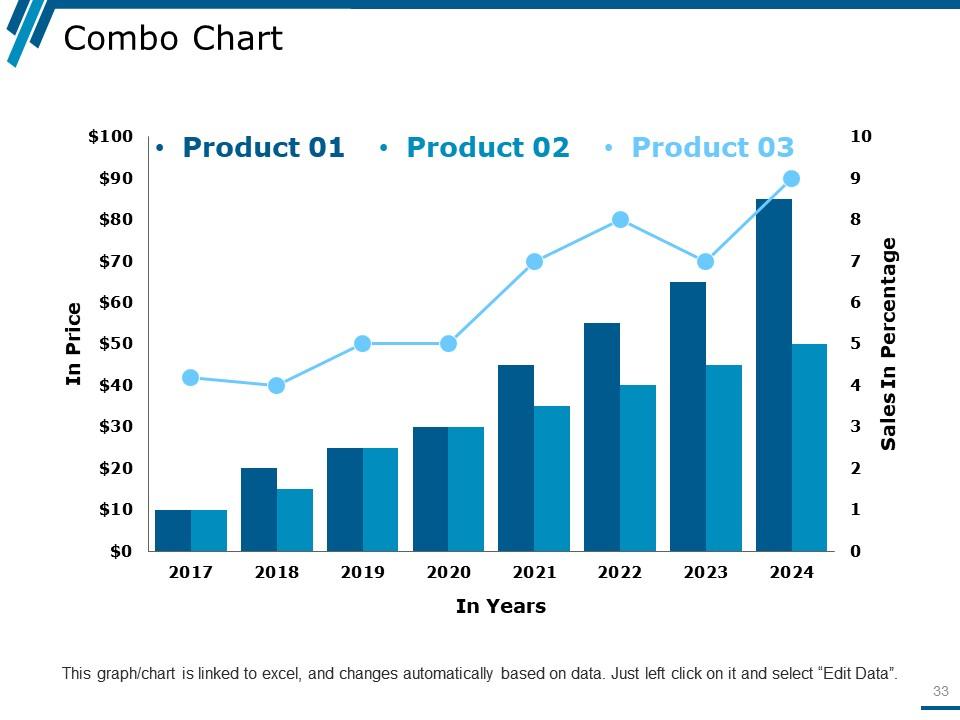
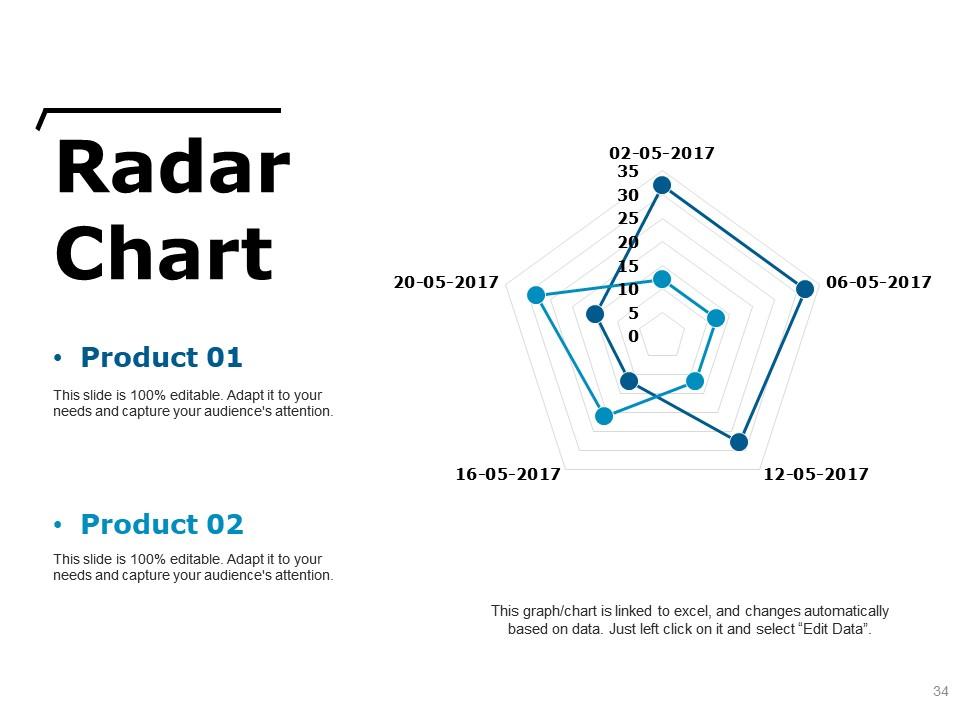
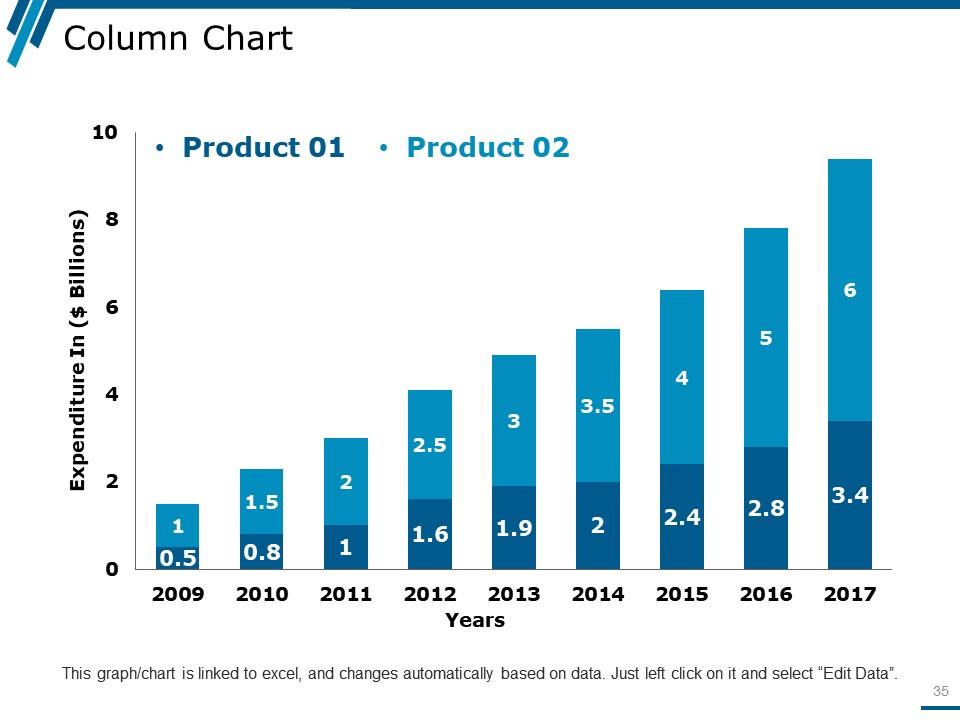
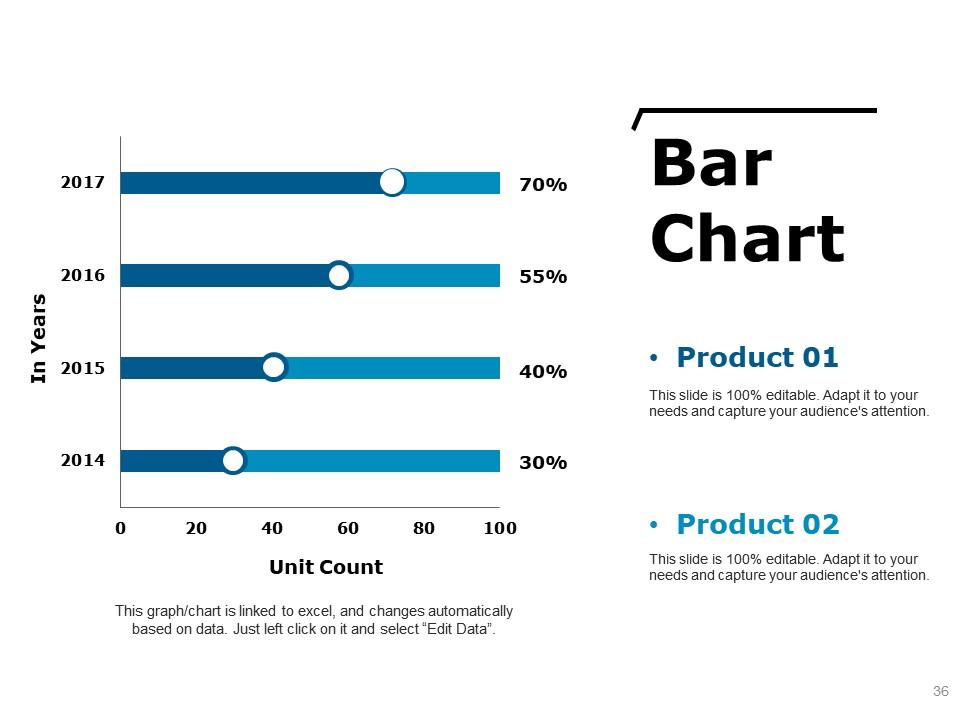





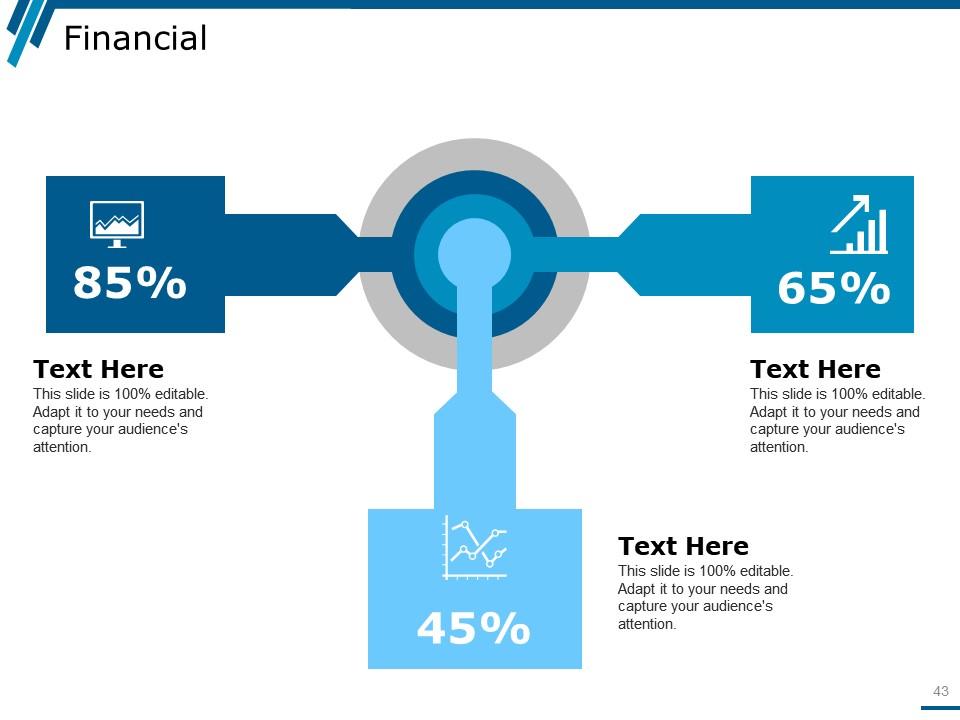

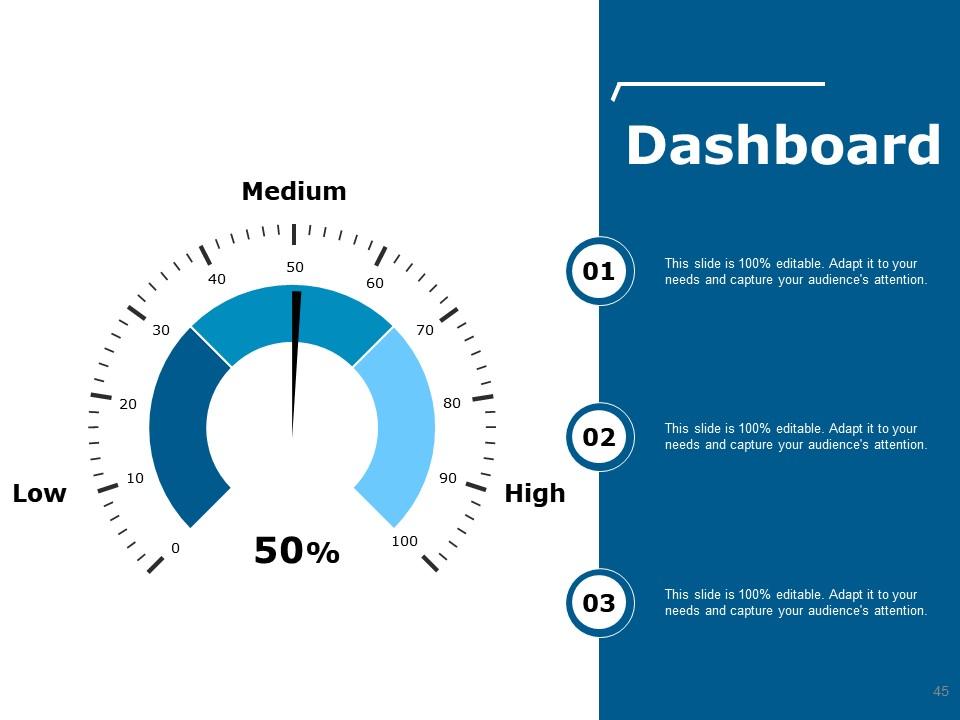
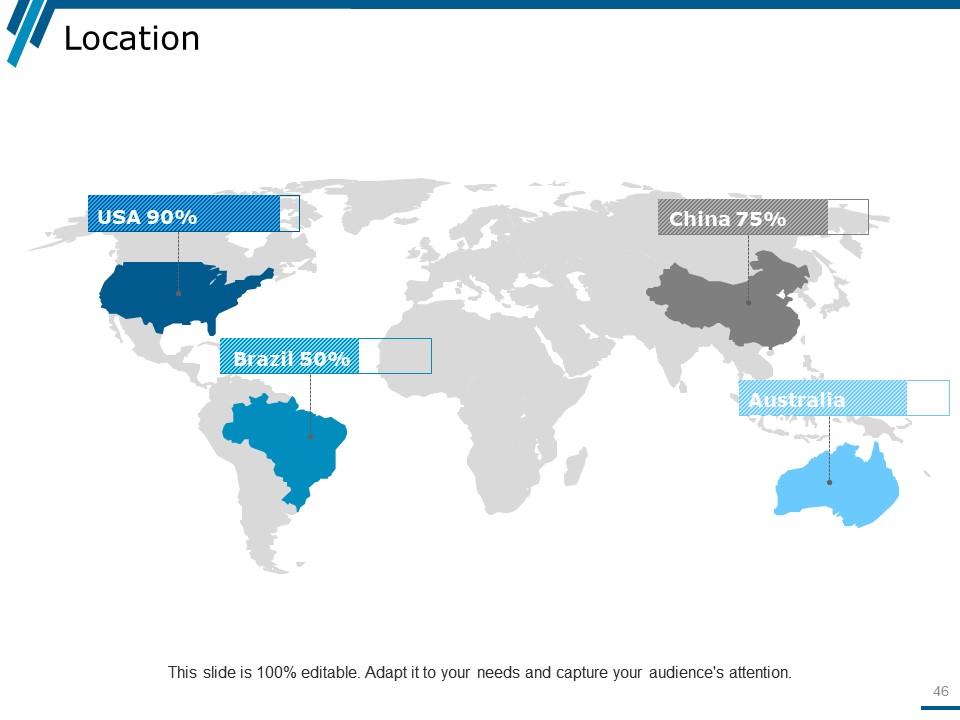
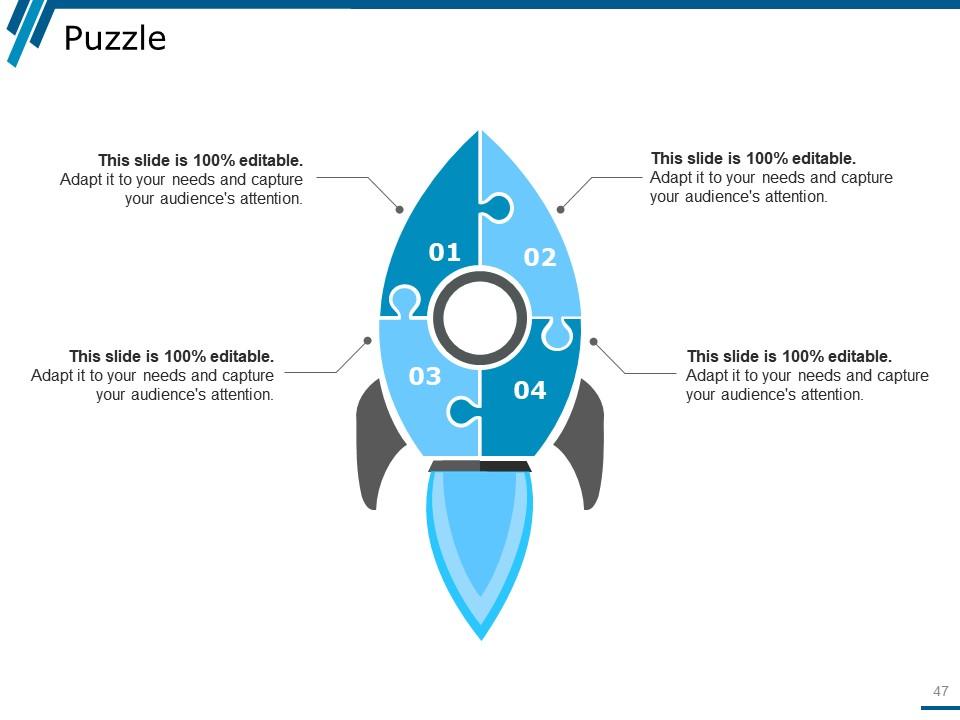
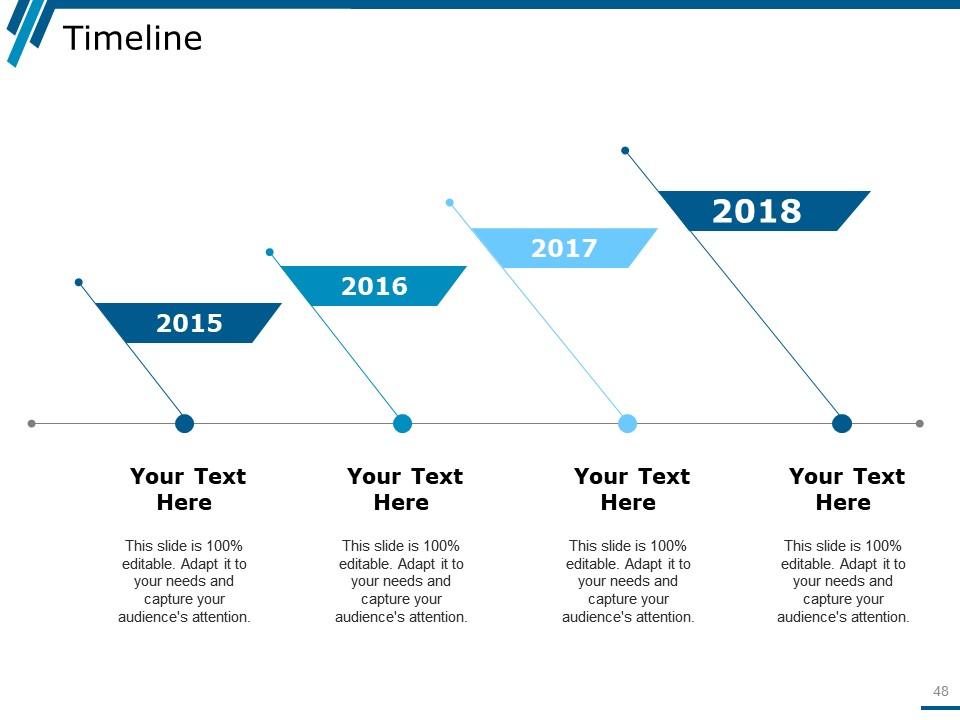
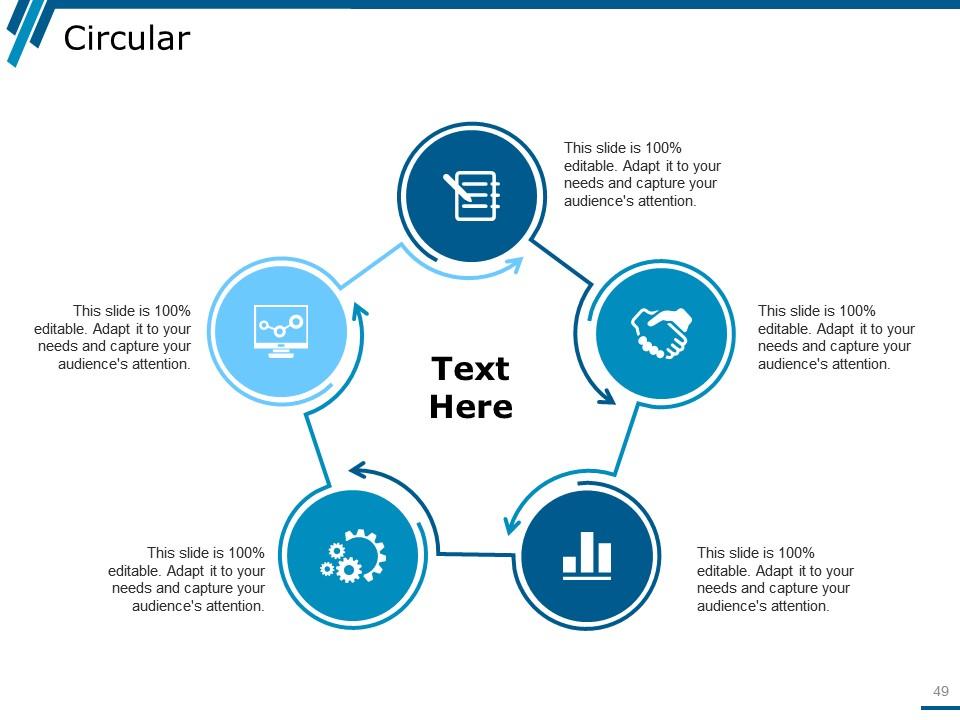



Financial Statements Ratio Analysis Interpretation Powerpoint Presentation Slides
Presenting Financial Statements Ratio Analysis Interpretation PowerPoint Presentation Slides. PowerPoint slides are supported with Google slides. Quick downloading speed and formats can be changed to JPEG and PDF. Perfect for entrepreneurs, sales and corporate person. High resolution presentation themes, does not affect resolution even after resizing. Alter PPT template, font, text, color and design as per your manner. Images do no blur out even when they are projected on wide screen.
Try Before you Buy Download Free Sample Product
Save Hours of Time
100% Editable
Compatible with Google Slides
-
Product Description
-
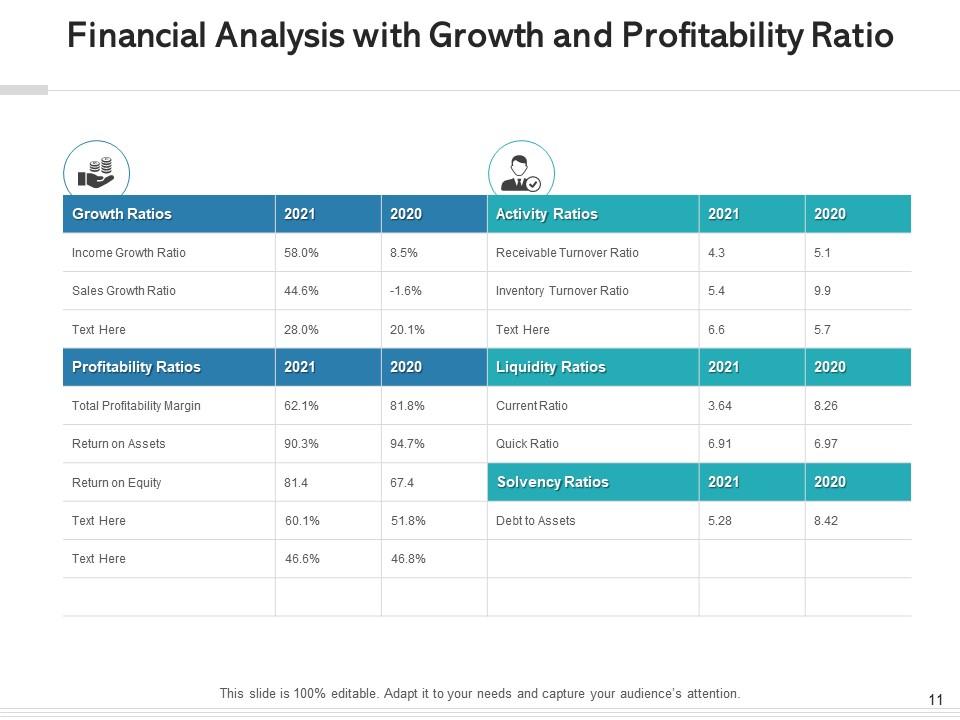
Perform a qualitative analysis of your business efficiency, liquidity and profitability with our financial statements ratio analysis interpretation PowerPoint presentation slides. This financial statement ratio analysis PPT has been designed by our team of professional designers to showcase financial statements of companies which involves economic health of business and historical monetary statement. These presentation slides will allow you to measure if your company will pay off debts in near future and check if through its earnings the business will be able to run operations smoothly in long run. This PPT theme of fiscal statement will help you evaluate how your company will manage its assets and liabilities to maximize profits. This Financial Statements Ratio Analysis Interpretation presentation deck will help you measure your ratio analysis types such as solvency ratio, operating performance, risk analysis and growth analysis. This PPT template will provide you useful facts and figures to measure different metrics of the industry and by using these analysis reports you can easily measure competitive positioning and financial stability of an organization. Have great fun with our Financial Statements Ratio Analysis Interpretation Powerpoint Presentation Slides. Every event becomes enjoyable.



Financial ratio analysis inventory accounts receivables shareholders equity interest
Introduce your topic and host expert discussion sessions with this Financial Ratio Analysis Inventory Accounts Receivables Shareholders Equity Interest. This template is designed using high-quality visuals, images, graphics, etc, that can be used to showcase your expertise. Different topics can be tackled using the twelve slides included in this template. You can present each topic on a different slide to help your audience interpret the information more effectively. Apart from this, this PPT slideshow is available in two screen sizes, standard and widescreen making its delivery more impactful. This will not only help in presenting a birds-eye view of the topic but also keep your audience engaged. Since this PPT slideshow utilizes well-researched content, it induces strategic thinking and helps you convey your message in the best possible manner. The biggest feature of this design is that it comes with a host of editable features like color, font, background, etc. So, grab it now to deliver a unique presentation every time.
Try Before you Buy Download Free Sample Product
Save Hours of Time
100% Editable
Compatible with Google Slides
-
Product Description
-
Our Financial Ratio Analysis Inventory Accounts Receivables Shareholders Equity Interest are topically designed to provide an attractive backdrop to any subject. Use them to look like a presentation pro.

Ratio Analysis Financial Statements In Powerpoint And Google Slides Cpb
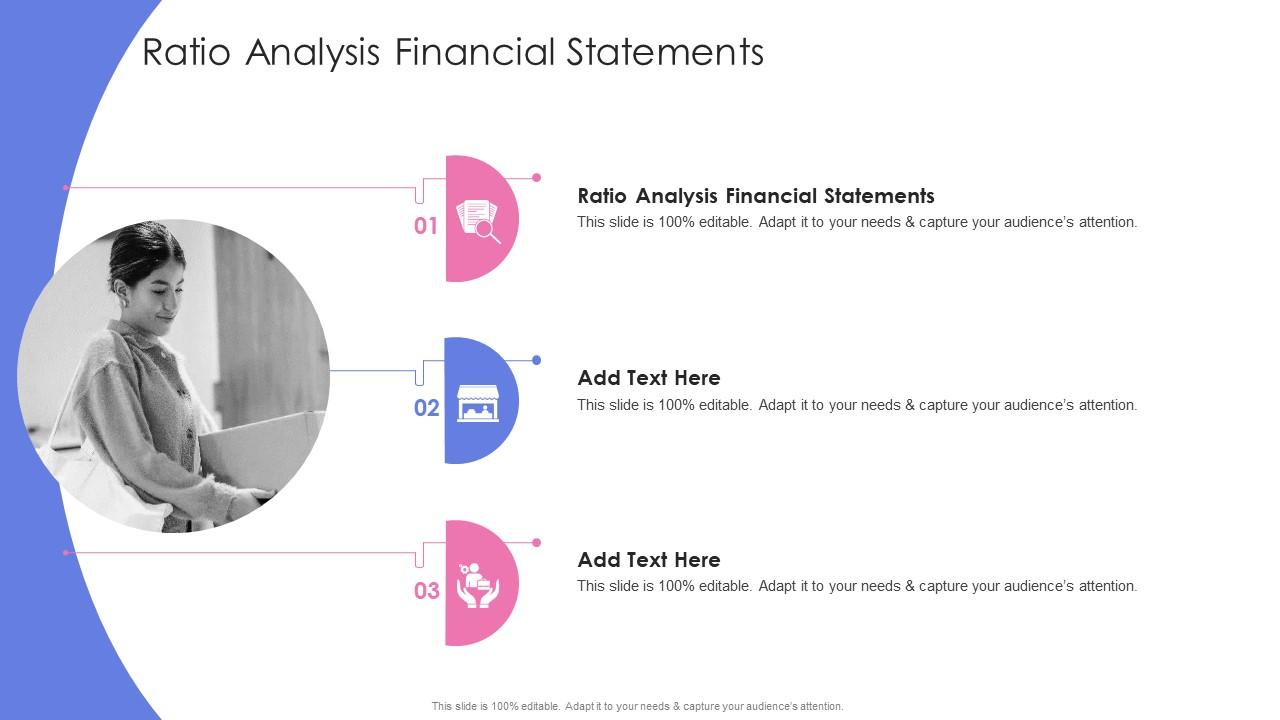
Presenting Ratio Analysis Financial Statements In Powerpoint And Google Slides Cpb slide which is completely adaptable. The graphics in this PowerPoint slide showcase three stages that will help you succinctly convey the information. In addition, you can alternate the color, font size, font type, and shapes of this PPT layout according to your content. This PPT presentation can be accessed with Google Slides and is available in both standard screen and widescreen aspect ratios. It is also a useful set to elucidate topics like Ratio Analysis Financial Statements. This well-structured design can be downloaded in different formats like PDF, JPG, and PNG. So, without any delay, click on the download button now.
Try Before you Buy Download Free Sample Product
Save Hours of Time
100% Editable
Compatible with Google Slides
-
Product Description
-
Our Ratio Analysis Financial Statements In Powerpoint And Google Slides Cpb are topically designed to provide an attractive backdrop to any subject. Use them to look like a presentation pro.
-
Related keywords


Financial ratio analysis banks organizational change management portfolio optimization cpb
We present to you this financial ratio analysis banks organizational change management portfolio optimization cpb. The slideshow can be save din PDF or JPG format. The presentation is fully editable which allows you make changes in the font size, font style and even the font color of the text used. The PPT template can be viewed in standard size display ratio of 4:3 or widescreen display ratio of 16: 9. This deck of five slides is also compatible with Google slides.
Try Before you Buy Download Free Sample Product
Save Hours of Time
100% Editable
Compatible with Google Slides
-
Product Description
-
Inject a dose of humor into the discussion with our Financial Ratio Analysis Banks Organizational Change Management Portfolio Optimization Cpb. Be jovial about it.
-
Related keywords

Financial Ratio And Accounting Analysis Icon
Introducing our premium set of slides with Financial Ratio And Accounting Analysis Icon. Elucidate the three stages and present information using this PPT slide. This is a completely adaptable PowerPoint template design that can be used to interpret topics like Financial Ratio, Accounting Analysis, Icon. So download instantly and tailor it with your information.
Try Before you Buy Download Free Sample Product
Save Hours of Time
100% Editable
Compatible with Google Slides
-
Product Description
-
Our Financial Ratio And Accounting Analysis Icon are topically designed to provide an attractive backdrop to any subject. Use them to look like a presentation pro.


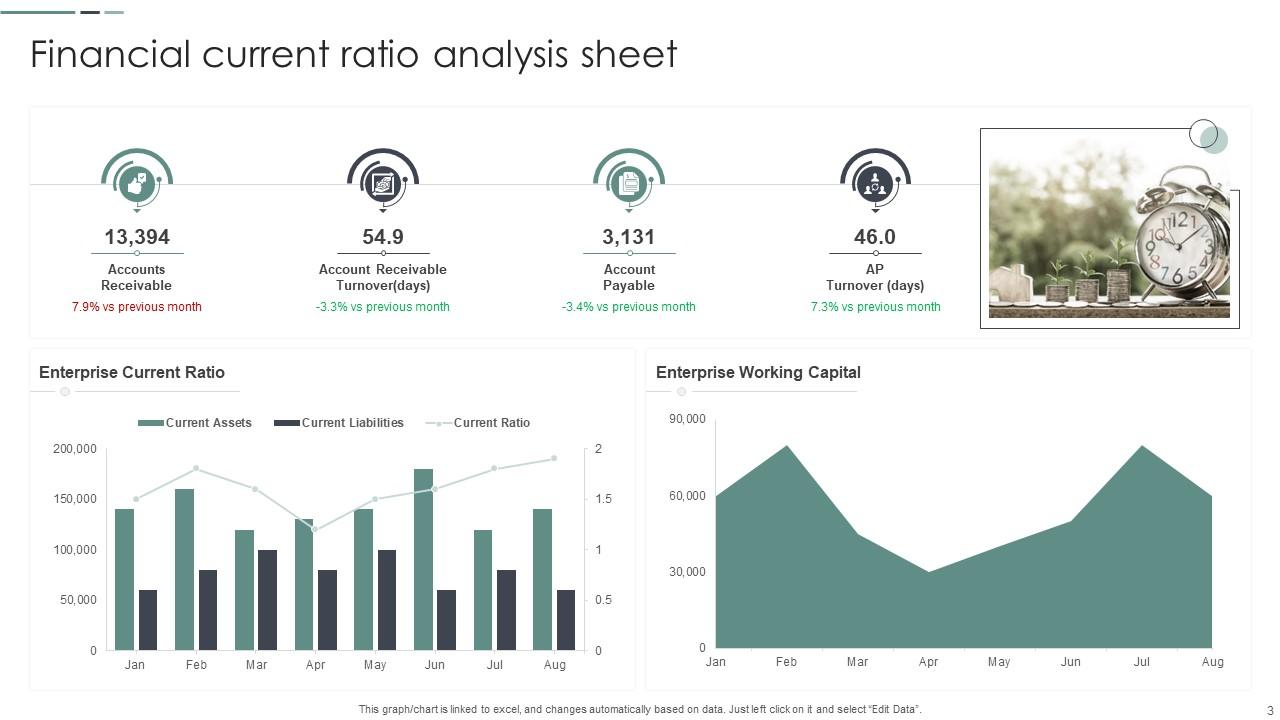


Financial Ratio Analysis Powerpoint Ppt Template Bundles
Deliver a credible and compelling presentation by deploying this Financial Ratio Analysis Powerpoint Ppt Template Bundles. Intensify your message with the right graphics,images,icons,etc. presented in this complete deck. This PPT template is a great starting point to convey your messages and build a good collaboration. The twelve slides added to this PowerPoint slideshow helps you present a thorough explanation of the topic. You can use it to study and present various kinds of information in the form of stats,figures,data charts,and many more. This Financial Ratio Analysis Powerpoint Ppt Template Bundles PPT slideshow is available for use in standard and widescreen aspects ratios. So,you can use it as per your convenience. Apart from this,it can be downloaded in PNG,JPG,and PDF formats,all completely editable and modifiable. The most profound feature of this PPT design is that it is fully compatible with Google Slides making it suitable for every industry and business domain.
Try Before you Buy Download Free Sample Product
Save Hours of Time
100% Editable
Compatible with Google Slides
-
Product Description
-
Our Financial Ratio Analysis Powerpoint Ppt Template Bundles are topically designed to provide an attractive backdrop to any subject. Use them to look like a presentation pro.
-
Related keywords


