

Top 10 Financial Analysis And Roi Presentation PowerPoint Presentation Templates in 2026
Financial analysis and ROI presentations are essential for businesses aiming to make informed decisions based on data-driven insights. Utilizing a PowerPoint (PPT) template specifically designed for financial analysis allows organizations to effectively communicate complex financial information in a clear and engaging manner. These presentations typically include key financial metrics, trend analyses, and projections that help stakeholders understand the potential return on investment (ROI) of various projects or initiatives.In a financial analysis presentation, users can showcase historical data, current performance, and future forecasts, enabling decision-makers to visualize trends and assess risks. The PPT format allows for the integration of charts, graphs, and tables, making it easier to highlight critical data points and facilitate discussions. Moreover, customizable templates ensure that presentations can be tailored to fit the branding and messaging of the organization, enhancing professionalism and coherence.Use cases for financial analysis and ROI presentations are varied. They can be employed during board meetings to present quarterly performance, in pitch decks for investors to highlight growth potential, or in strategic planning sessions to evaluate new project proposals. Ultimately, these presentations play a crucial role in driving strategic decisions and aligning stakeholders on financial goals and expectations.






Project Financial Investment Analysis Reporting Examining Financial Budgeting Ppt Example
This slide showcases financial investment analysis dashboard for project such as total investment, rate of return, group-wise investment, yearly investment etc. Present the topic in a bit more detail with this Project Financial Investment Analysis Reporting Examining Financial Budgeting Ppt Example Use it as a tool for discussion and navigation on Number Of Investment, Reporting Dashboard This template is free to edit as deemed fit for your organization. Therefore download it now.

Try Before you Buy Download Free Sample Product
 Save Hours of Time
 100% Editable
 Compatible with Google Slides
-
Product Description

-
This slide showcases financial investment analysis dashboard for project such as total investment, rate of return, group-wise investment, yearly investment etc.
-
Related keywords

ROI Analysis Of Major Ethical Investing Funds
This slide shows the returns on investments on investing in seven best ethical funds of USA. It includes seven best ethical funds such as Parnassus core equity fund investor shares, iShares ESG Aware MSCI USA ETF, Vanguard FTSE Social Index Fund Admiral Shares etc. Introducing our premium set of slides with ROI Analysis Of Major Ethical Investing Funds. Elucidate the seven stages and present information using this PPT slide. This is a completely adaptable PowerPoint template design that can be used to interpret topics like ROI Analysis, Major Ethical Investing Funds. So download instantly and tailor it with your information.
Try Before you Buy Download Free Sample Product
Save Hours of Time
100% Editable
Compatible with Google Slides
-
Product Description
-
This slide shows the returns on investments on investing in seven best ethical funds of USA. It includes seven best ethical funds such as Parnassus core equity fund investor shares, iShares ESG Aware MSCI USA ETF, Vanguard FTSE Social Index Fund Admiral Shares etc.
-
Related keywords

Comparative Analysis Of Financial Statement Ratios
This slide shows the comparative analysis of various financial ratios. It includes revenue, cost of revenue, gross profit, net profit etc. Presenting our set of slides with Comparative Analysis Of Financial Statement Ratios. This exhibits information on one stages of the process. This is an easy to edit and innovatively designed PowerPoint template. So download immediately and highlight information on Investments Return, Debt Ratios, Gross Profit.
Try Before you Buy Download Free Sample Product
Save Hours of Time
100% Editable
Compatible with Google Slides
-
Product Description
-
This slide shows the comparative analysis of various financial ratios. It includes revenue, cost of revenue, gross profit, net profit etc.

Sales Territory Planning To Enhance Forecasted Return On Investment Analysis Roi Of Sales Territories SA SS
This slide displays return on investment for each territory indicating impact of effective allocation of resources, include territory, total expense, revenue, profit and return on investment. Deliver an outstanding presentation on the topic using this Sales Territory Planning To Enhance Forecasted Return On Investment Analysis Roi Of Sales Territories SA SS. Dispense information and present a thorough explanation of Forecasted Return On Investment, Sales Territories, Revenue Expenses using the slides given. This template can be altered and personalized to fit your needs. It is also available for immediate download. So grab it now.
Try Before you Buy Download Free Sample Product
Save Hours of Time
100% Editable
Compatible with Google Slides
-
Product Description
-
This slide displays return on investment for each territory indicating impact of effective allocation of resources, include territory, total expense, revenue, profit and return on investment.


Non Profit Organization Financial Analysis Dashboard
This slide represents non profit organization financial analysis dashboard which assists to get full insights into important financial metrics such as bank accounts, sales and cash flow. It includes key components such as total income, total expenses, etc. Introducing our Non Profit Organization Financial Analysis Dashboard set of slides. The topics discussed in these slides are Invoices By Customers, Expenses By Vendor, Bank And Credit Card, Total Income. This is an immediately available PowerPoint presentation that can be conveniently customized. Download it and convince your audience.
Try Before you Buy Download Free Sample Product
Save Hours of Time
100% Editable
Compatible with Google Slides
-
Product Description
-
This slide represents non profit organization financial analysis dashboard which assists to get full insights into important financial metrics such as bank accounts, sales and cash flow. It includes key components such as total income, total expenses, etc.
-
Related keywords

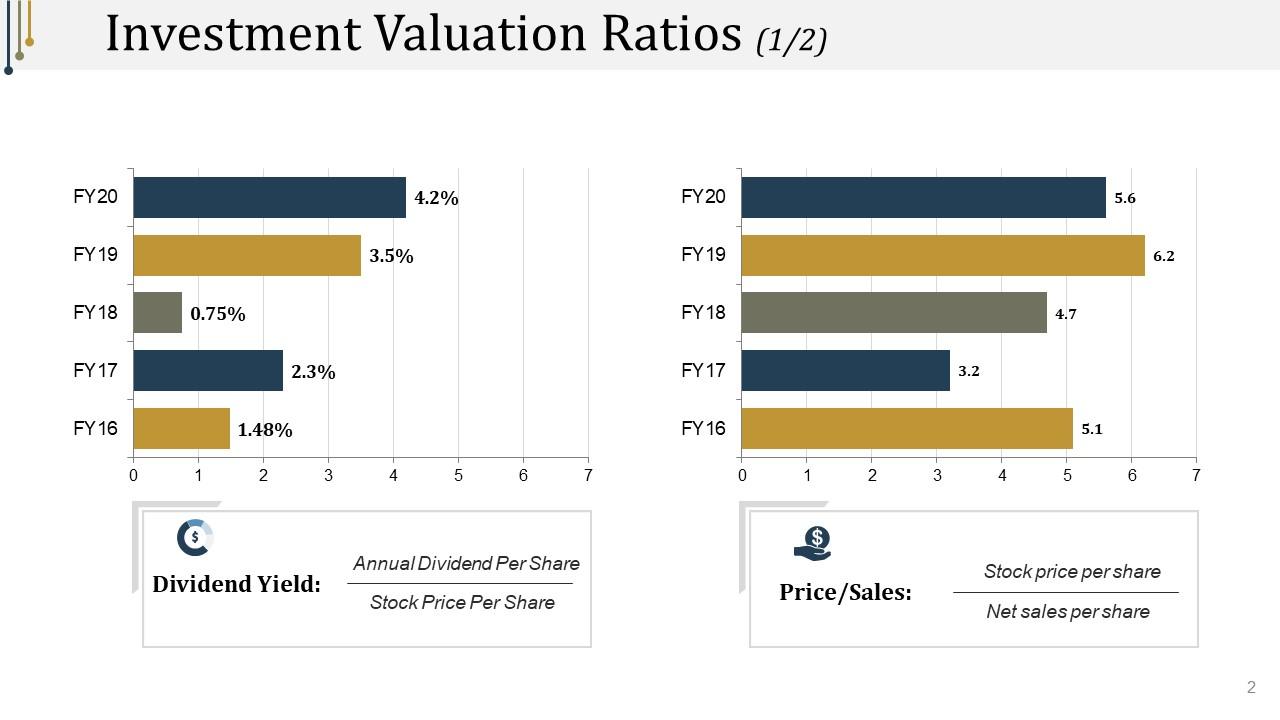
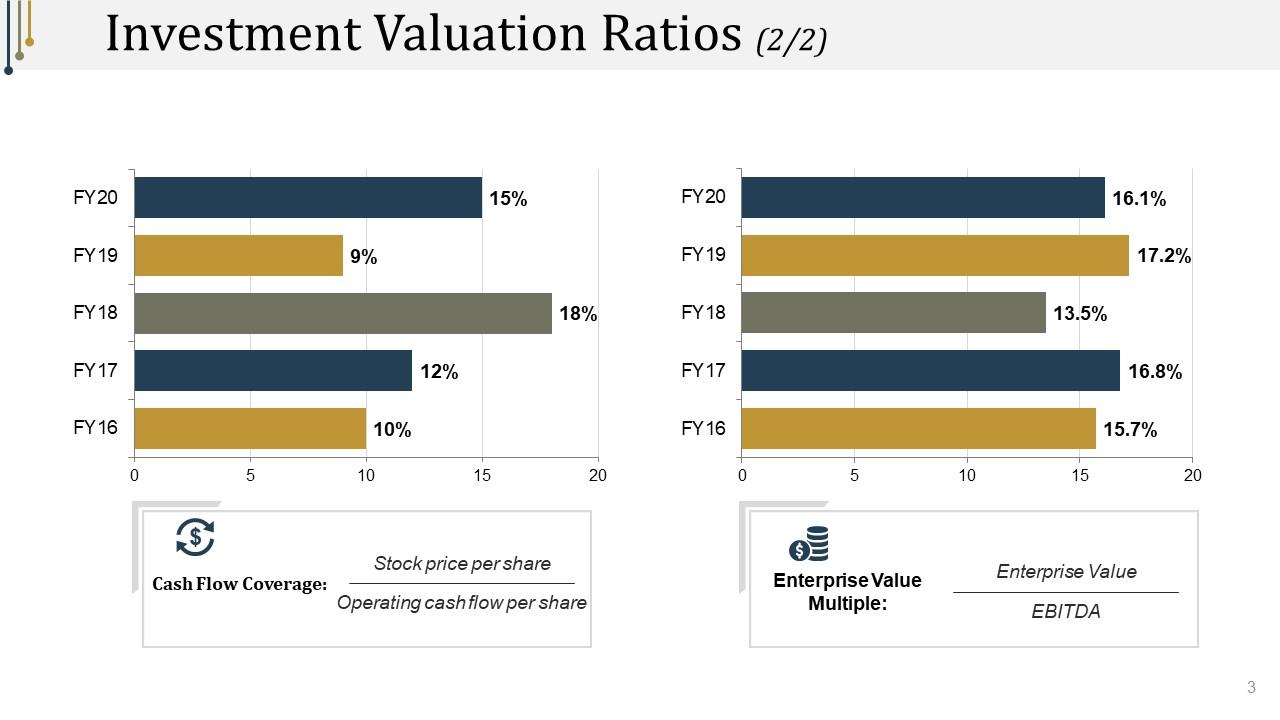


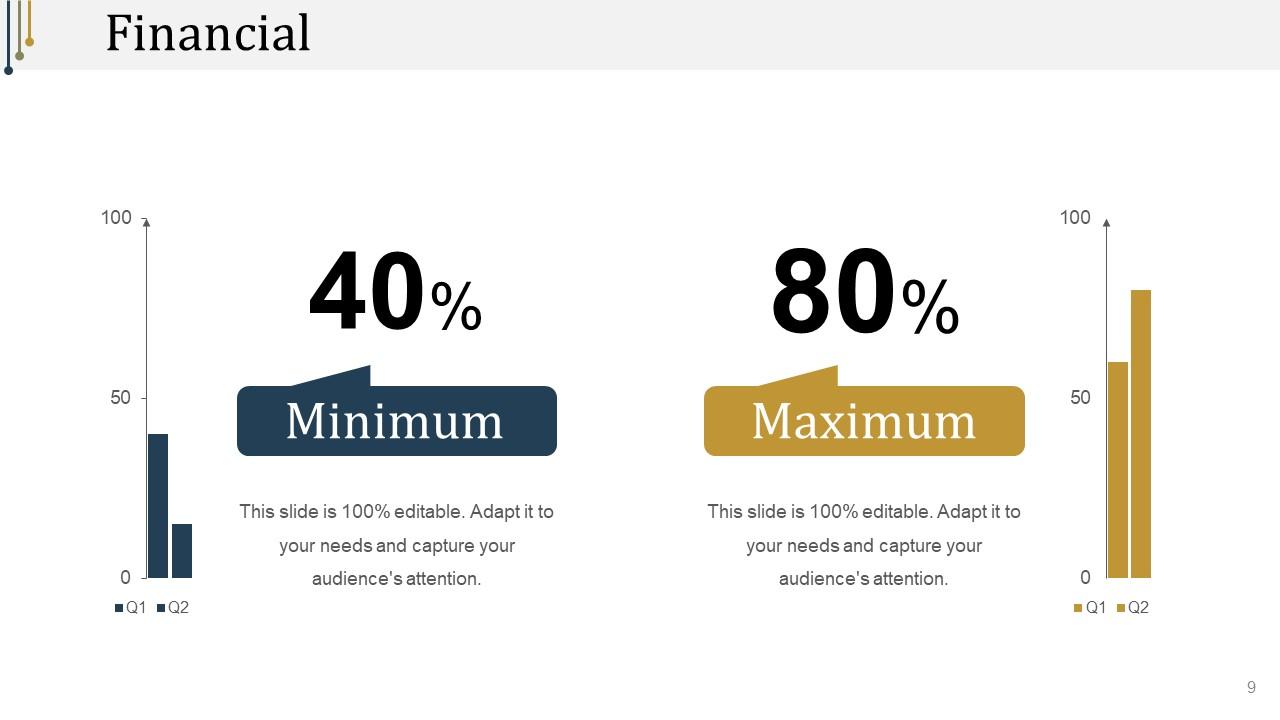

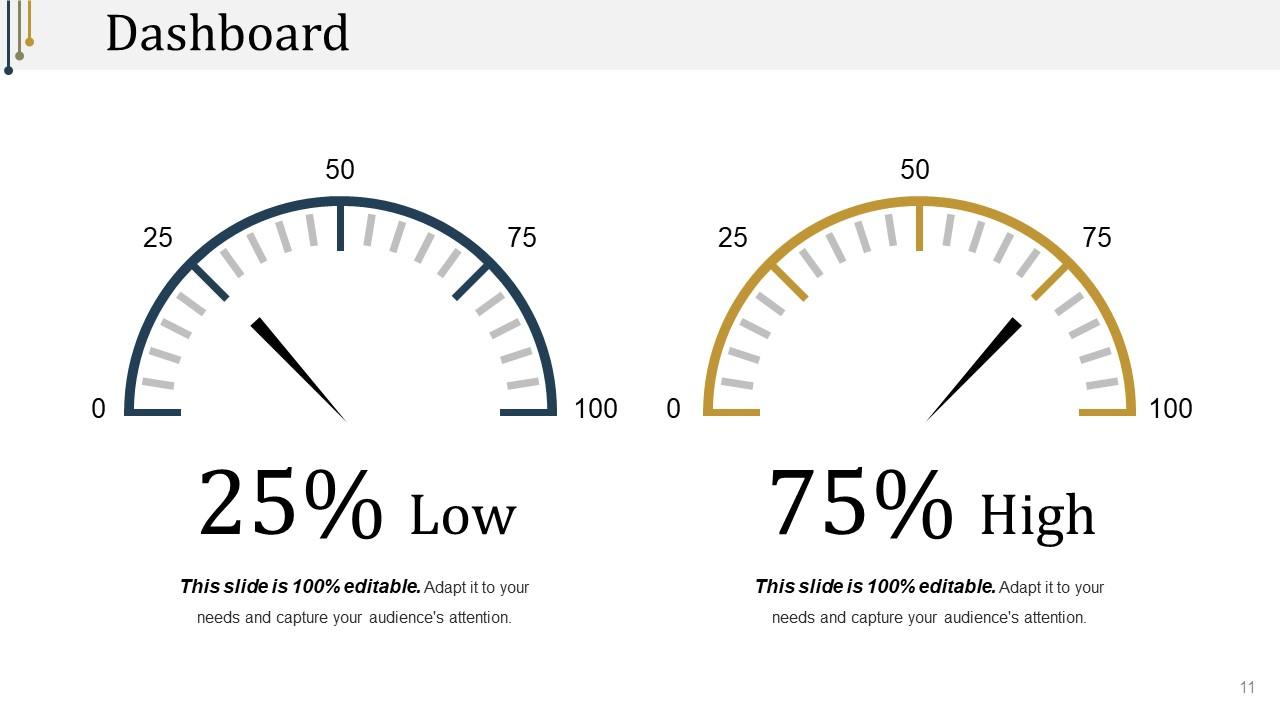

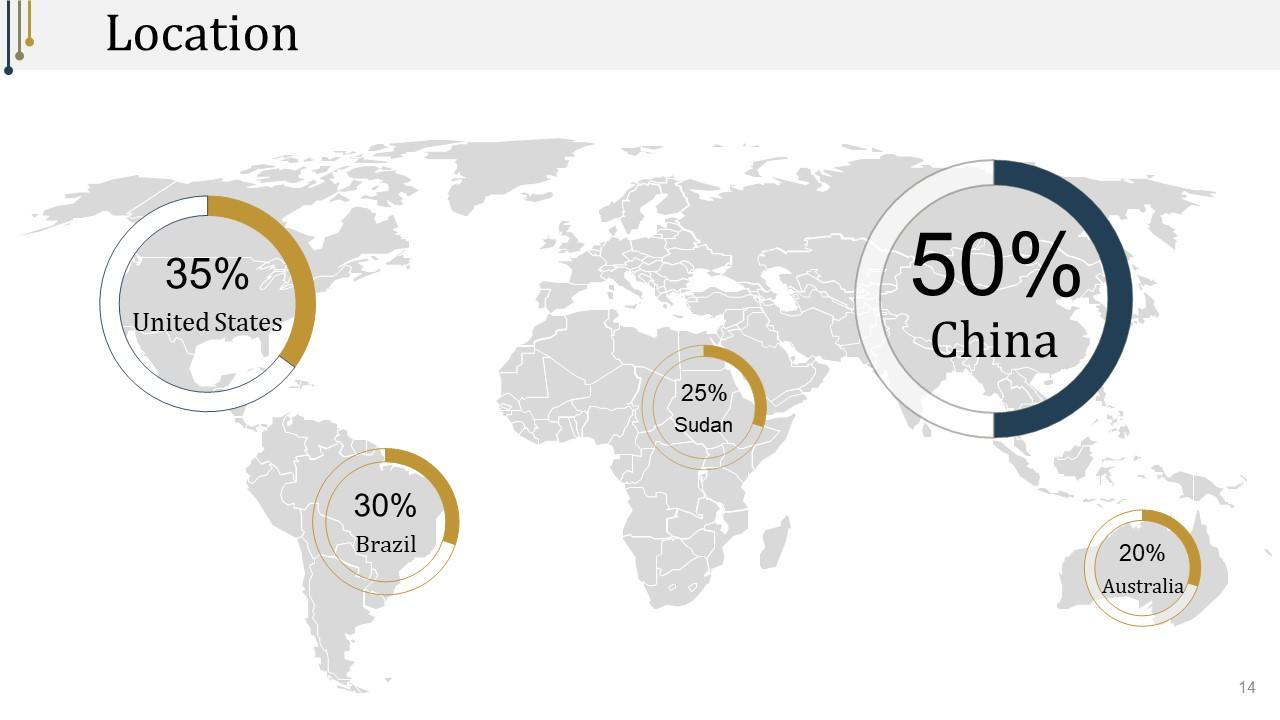
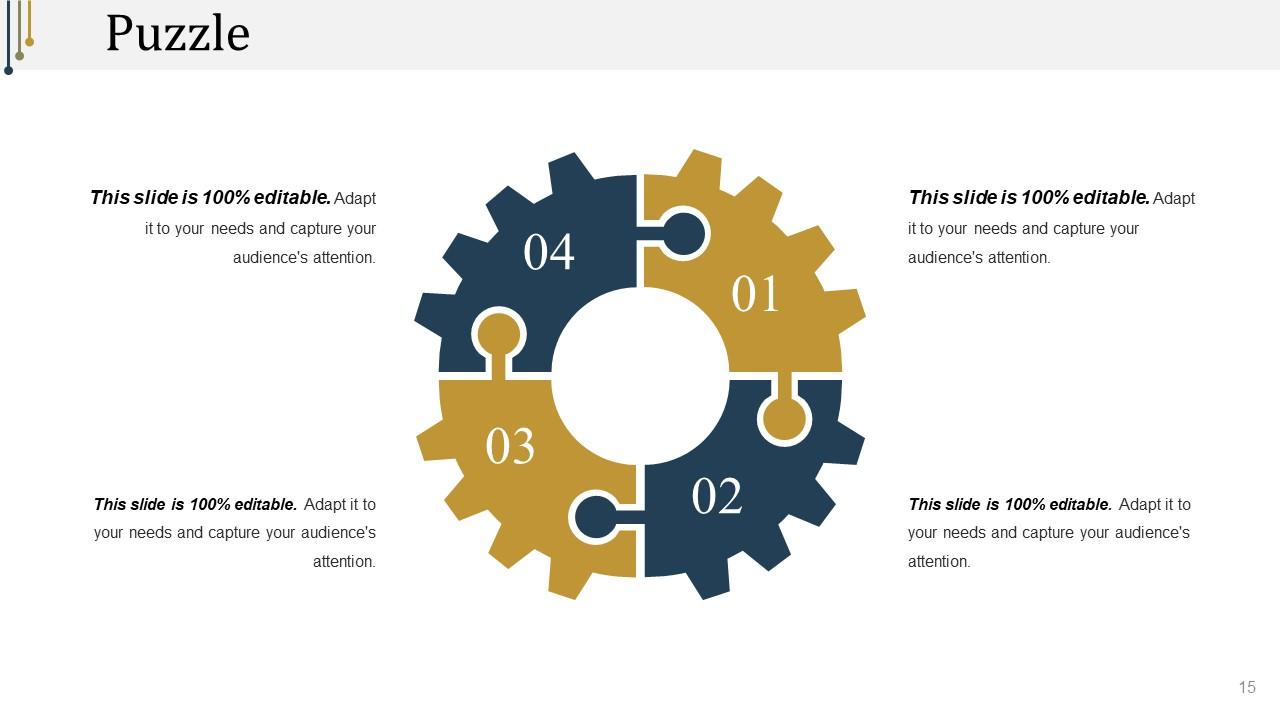
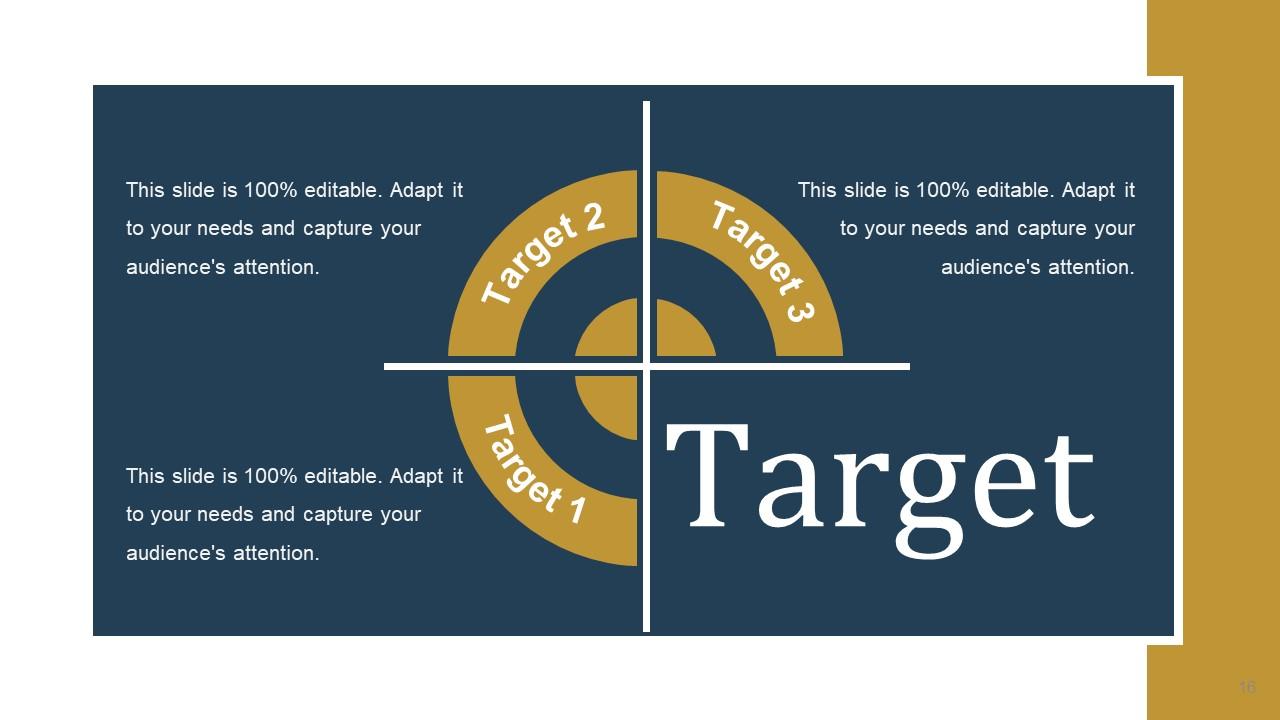
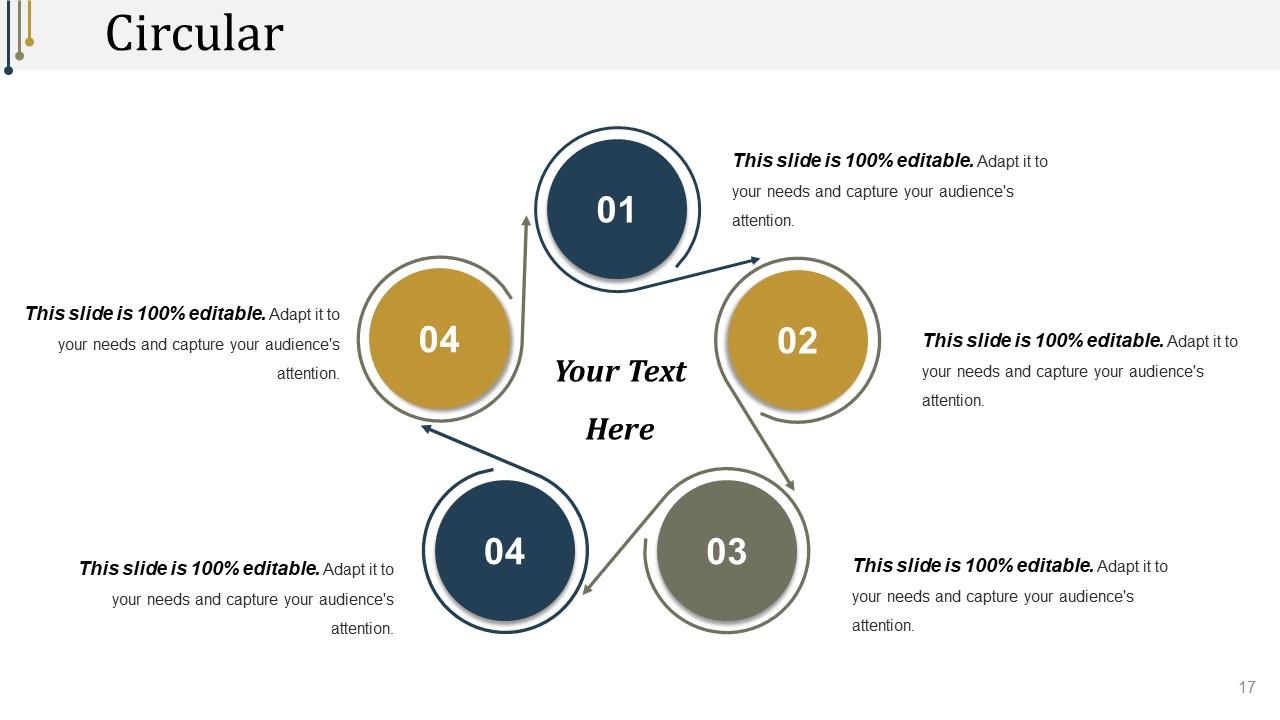


Financial Ratio Analysis And Interpretation Powerpoint Presentation Slides
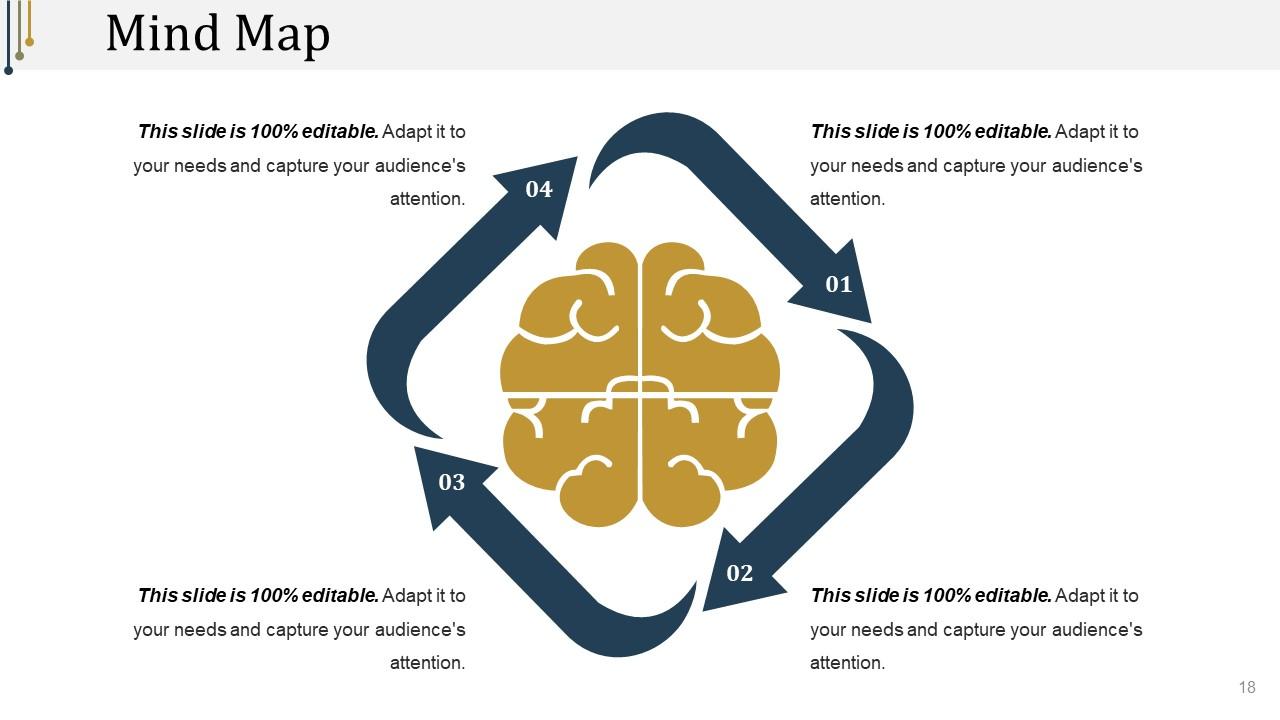
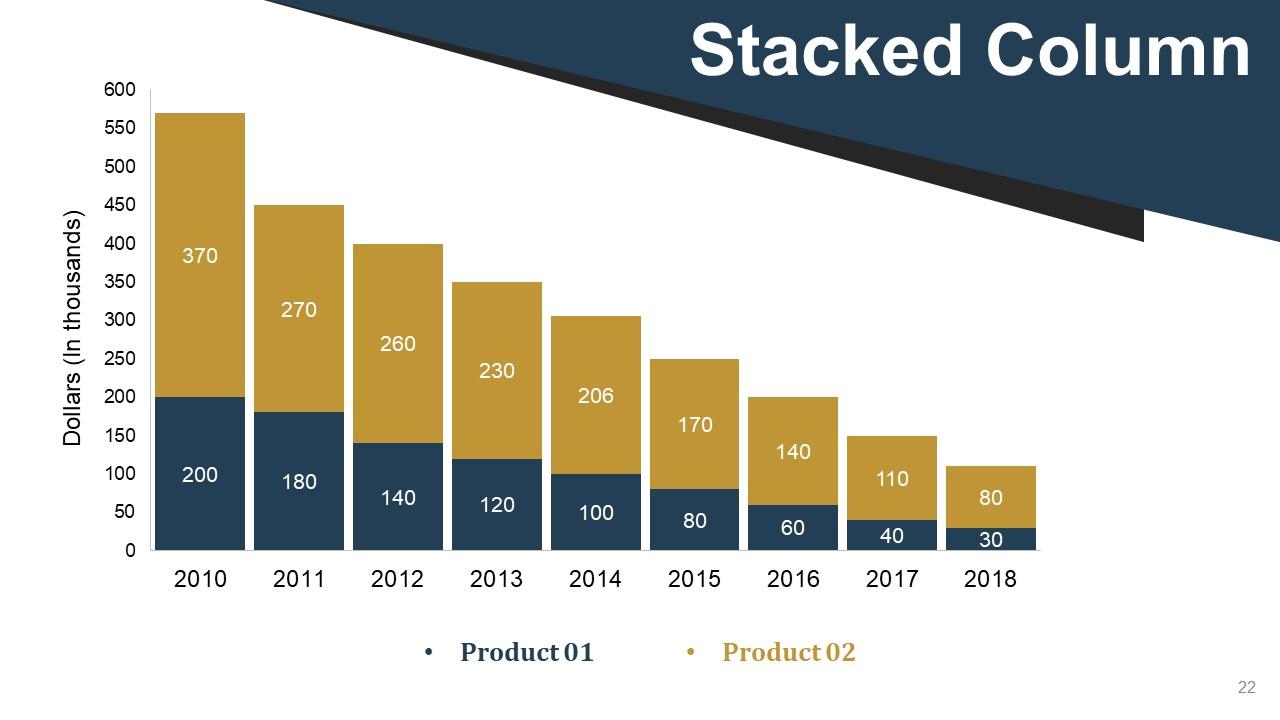
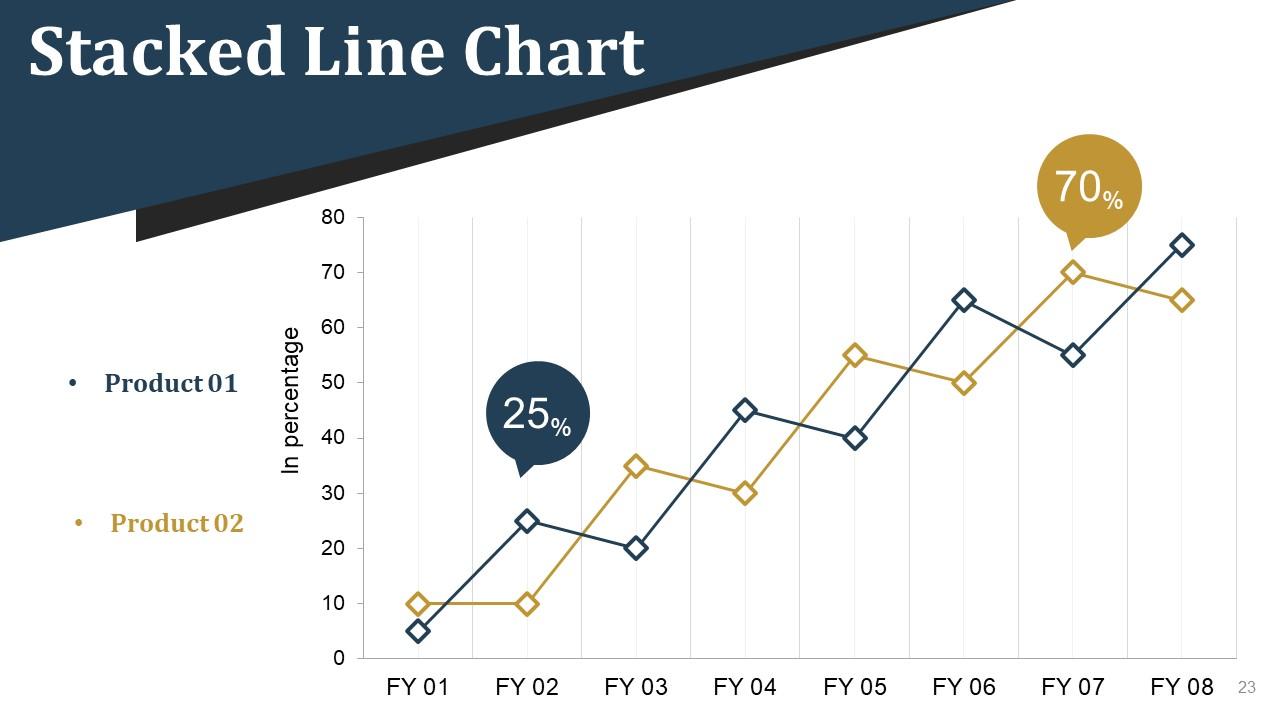
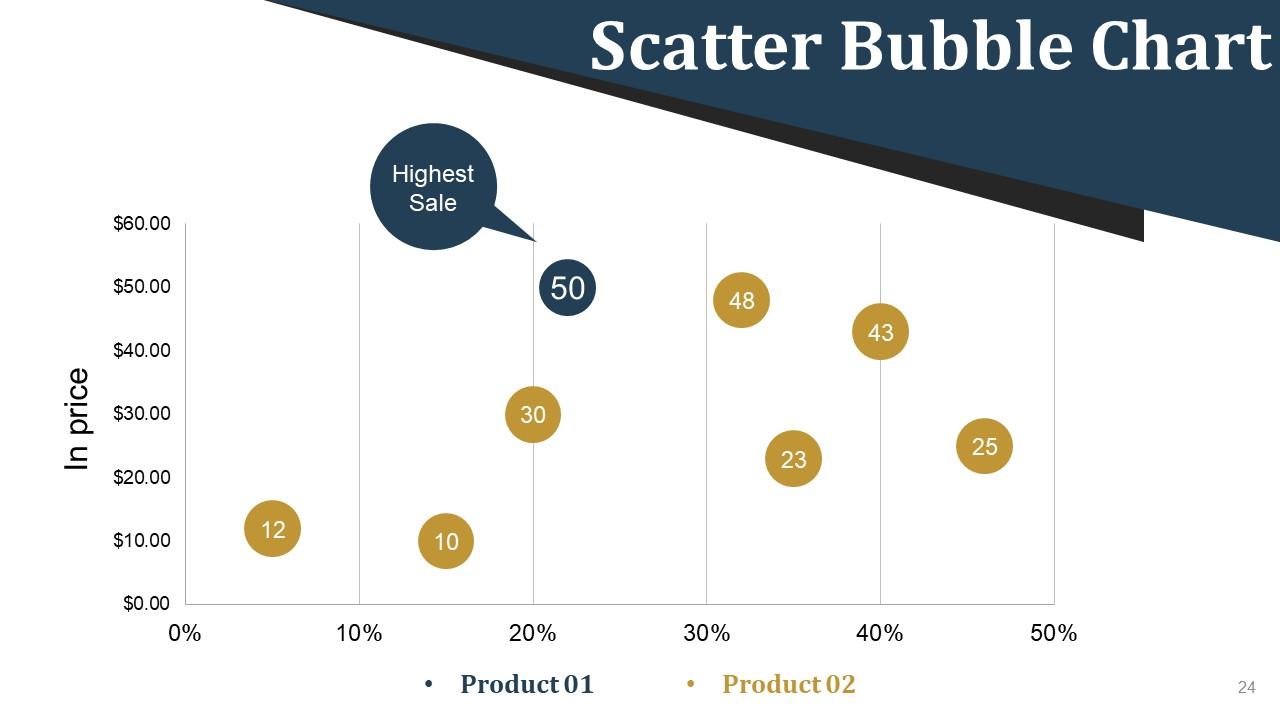
100% editable slides let you edit them to the way you want. A total of 25 deeply researched slides. Instant download option lets you download with a click. Standard and widescreen mode compatibility. Can be viewed in Google Slides also. Suitable for financial department, analysts, business leaders and organisations.The stages in this process are accounting ratio, financial statement, financial ratio analysis and interpretation.
Try Before you Buy Download Free Sample Product
Save Hours of Time
100% Editable
Compatible with Google Slides
-
Product Description
-
Once you have got your hands on the financial statements of your company, you’ll need to know exactly how to analyse and interpret it. This is where our content-ready financial ratio analysis and interpretation PowerPoint presentation slides will be useful. The financial analysis PowerPoint designs cover ratio analysis in the form of dashboards, timelines, graphs and line charts. Our predesigned PPT templates give emphasis on investment valuation ratios, comparison of financial data, budgeting and forecasting. These presentation visuals can also be used for accounting analysis, financial modelling, market value ratio analysis, liquidity ratio analysis, balance sheet reports, and more. Over the years, analysts have developed myriad of tools and techniques which serves as the basis for financial statement analysis. So, download our financial ratio analysis and interpretation PowerPoint presentation slides right away to get full advantage of the financial statement. Counter the factors delaying decisions with our Financial Ratio Analysis And Interpretation Powerpoint Presentation Slides. Identify the exact dilemma existing.


Financial analyst icon preparing roi report
Presenting this set of slides with name Financial Analyst Icon Preparing ROI Report. This is a three stage process. The stages in this process are Financial Analyst Icon Preparing ROI Report. This is a completely editable PowerPoint presentation and is available for immediate download. Download now and impress your audience.
Try Before you Buy Download Free Sample Product
Save Hours of Time
100% Editable
Compatible with Google Slides
-
Product Description
-
Our Financial Analyst Icon Preparing ROI Report are topically designed to provide an attractive backdrop to any subject. Use them to look like a presentation pro.
-
Related keywords


Sales Improvement Plan Dashboard With Product Classification And Financial Analysis
This slide shows sales improvement plan dashboard for product classification and financial analysis which can be referred by companies which want to make quick decisions by having overview of organized and compiled data. It includes details such as comparison chart, state wise sales, total sales, adjusted margin, operational expenses, etc.. Introducing our Sales Improvement Plan Dashboard With Product Classification And Financial Analysis set of slides. The topics discussed in these slides are Sales Improvement Plan, Dashboard, Product Classification, Financial Analysis. This is an immediately available PowerPoint presentation that can be conveniently customized. Download it and convince your audience.
Try Before you Buy Download Free Sample Product
Save Hours of Time
100% Editable
Compatible with Google Slides
-
Product Description
-
This slide shows sales improvement plan dashboard for product classification and financial analysis which can be referred by companies which want to make quick decisions by having overview of organized and compiled data. It includes details such as comparison chart, state wise sales, total sales, adjusted margin, operational expenses, etc..


New market penetration analysis powerpoint presentation slides
Presenting new market penetration analysis PowerPoint deck with slides. This complete presentation comprises of total of 24 PPT slides. It covers topics related to the market research for new product development. Our PowerPoint professionals have incorporated appropriate diagrams, layouts, templates and icons related to the topic. The best part is that these templates are completely customizable. Edit the colour, text and icon as per your need. Click the download button below to grab this complete PPT deck on new market penetration analysis.
Try Before you Buy Download Free Sample Product
Save Hours of Time
100% Editable
Compatible with Google Slides
-
Product Description
-
Conduct a thorough market research for new product using New Market Penetration Analysis PowerPoint Presentation Slides. Identify and evaluate the market need, market size, competition, and more with the help of content-ready new market penetration PowerPoint presentation slideshow. This ready-made PowerPoint complete deck comprises of templates like market segmentation, product market mapping, market research for new product, competitive opportunity, market landscape, market attractiveness, and more. Use new market penetration analysis PPT slides to create a plan to introduce your product in the market. These new market penetration analysis PowerPoint slides will help you assess the competitive market and product mapping for a product to be entered in a market successfully. These templates are completely customizable. You can edit the template as per your convenience. Edit the color, text, icon, and font size as per your need. Grab this new market penetration analysis PowerPoint templates to develop and introduce your new product in the market without any hassles. Introduce changes that assure improvement with our New Market Penetration Analysis Powerpoint Presentation Slides. Gain from being able to introspect.


Sales roi analysis presentation background images
Presenting sales roi analysis presentation background images. This is a sales roi analysis presentation background images. This is a one stage process. The stages in this process are report outcome, define success factors, identify potential benefits, confirm guidelines.
Try Before you Buy Download Free Sample Product
Save Hours of Time
100% Editable
Compatible with Google Slides
-
Product Description
-
Create the impression you intended with our Sales Roi Analysis Presentation Background Images. Convey your brainwave exactly as you had imagined.