

Top 10 Financial Reporting Dashboard PowerPoint Presentation Templates in 2026
A Financial Reporting Dashboard is an essential PowerPoint (PPT) tool designed to provide a visual representation of a company's financial performance. This template allows users to consolidate complex financial data into easily digestible formats, facilitating better decision-making for stakeholders. By utilizing various charts, graphs, and tables, the dashboard captures key performance indicators (KPIs) such as revenue, expenses, profit margins, and cash flow, presenting them in a cohesive layout.The use cases for a Financial Reporting Dashboard in PPT are extensive. Businesses can employ it during quarterly or annual financial reviews to summarize performance trends and highlight areas needing attention. It is also beneficial for presenting financial forecasts and budgets, enabling stakeholders to visualize expected outcomes against historical data. Moreover, finance teams can use the dashboard in meetings with investors or board members to communicate financial health effectively. The customizable nature of the PPT template allows users to tailor the dashboard to their specific needs, ensuring that the most relevant metrics are highlighted. This adaptability makes it a versatile tool for financial analysts, accountants, and executives, ultimately supporting strategic planning and performance management within organizations.


Executing reporting kpi dashboard snapshot showing income sales by product vendor expenses
Presenting this set of slides with name - Executing Reporting Kpi Dashboard Snapshot Showing Income Sales By Product Vendor Expenses. This is a four stage process. The stages in this process are Executive Reporting, Executive Analysis, Executive Performance.

Try Before you Buy Download Free Sample Product
 Save Hours of Time
 100% Editable
 Compatible with Google Slides
-
Product Description

-
Our Executing Reporting Kpi Dashboard Showing Income Sales By Product Vendor Expenses are bound to fit your budget. They enable effective cost control.


One page visual analysis of company financial performance report ppt pdf document
Here we present One Page Visual Analysis Of Company Financial Performance Report PPT PDF Document one pager PowerPoint template. The data visualization PowerPoint one pager template can be utilized by organizations to present their companys stats in a crisp and clear format. It gives you various sections that will aid you in presenting your companys product wise sale depicting the various categories your firm deals in. Additionally, assessing the result of regional sales has now become easy, thanks to this professionally curated one pager PowerPoint quarterly sales template. Conducting a comparative analysis has now become possible because of this creatively designed one pager PPT slide design which gives you access to compare the revenue and the quantity produced. Talk about the top 4 markets where your brand is performing well and throw some light over the products that yields you higher revenue. Grab this One Page Visual Analysis Of Company Financial Performance Report PPT PDF Document one pager template now.
Try Before you Buy Download Free Sample Product
Save Hours of Time
100% Editable
Compatible with Google Slides
-
Product Description
-
This document titled One Page Visual Analysis Of Company Financial Performance Report PPT PDF Document is an A4 size template designed in Powerpoint and is 100 percent editable. It displays the details in a crisp clear and digestible format while also being visually appealing. With this document you will be able to provide a comprehensive view to your audience with minimal effort. One Page Visual Analysis Of Company Financial Performance Report PPT PDF Document will save you precious time and help you communicate your message with your viewers.








Financial planning and reporting KPI dashboard
This slide represents a dashboard highlighting the report prepared by the financial planning team. It includes net product revenue, gross margin, cost of goods sold etc. Introducing our Financial planning and reporting KPI dashboard set of slides. The topics discussed in these slides are Net Product Revenue, Quarter Analysis, Gross Margin. This is an immediately available PowerPoint presentation that can be conveniently customized. Download it and convince your audience.
Try Before you Buy Download Free Sample Product
Save Hours of Time
100% Editable
Compatible with Google Slides
-
Product Description
-
This slide represents a dashboard highlighting the report prepared by the financial planning team. It includes net product revenue, gross margin, cost of goods sold etc.


Dashboard For Monitoring And Reporting Financial Budgets
This slide brings forth dashboard for monitoring and reporting the financial budgets of various branches of an enterprise emphasis on income and expenditure by each branch. The key performing indicators are actual vs budgeted revenue, revenue distribution by branches etc. Introducing our Dashboard For Monitoring And Reporting Financial Budgets set of slides. The topics discussed in these slides are Current Revenue, Current Operating Income This is an immediately available PowerPoint presentation that can be conveniently customized. Download it and convince your audience.
Try Before you Buy Download Free Sample Product
Save Hours of Time
100% Editable
Compatible with Google Slides
-
Product Description
-
This slide brings forth dashboard for monitoring and reporting the financial budgets of various branches of an enterprise emphasis on income and expenditure by each branch. The key performing indicators are actual vs budgeted revenue, revenue distribution by branches etc.
-
Related keywords


Financial Report Dashboard For Assessing Business Profits
This slide showcases the financial report dashboard for evaluating business profits of a firm. The purpose of this slide is to depict the financial performance of firm through the analysis of various indicators such as total profit margin, OPEX ratio, Net profit margin, etc. Introducing our Financial Report Dashboard For Assessing Business Profits set of slides. The topics discussed in these slides are Financial, Dashboard, Business. This is an immediately available PowerPoint presentation that can be conveniently customized. Download it and convince your audience.
Try Before you Buy Download Free Sample Product
Save Hours of Time
100% Editable
Compatible with Google Slides
-
Product Description
-
This slide showcases the financial report dashboard for evaluating business profits of a firm. The purpose of this slide is to depict the financial performance of firm through the analysis of various indicators such as total profit margin, OPEX ratio, Net profit margin, etc.


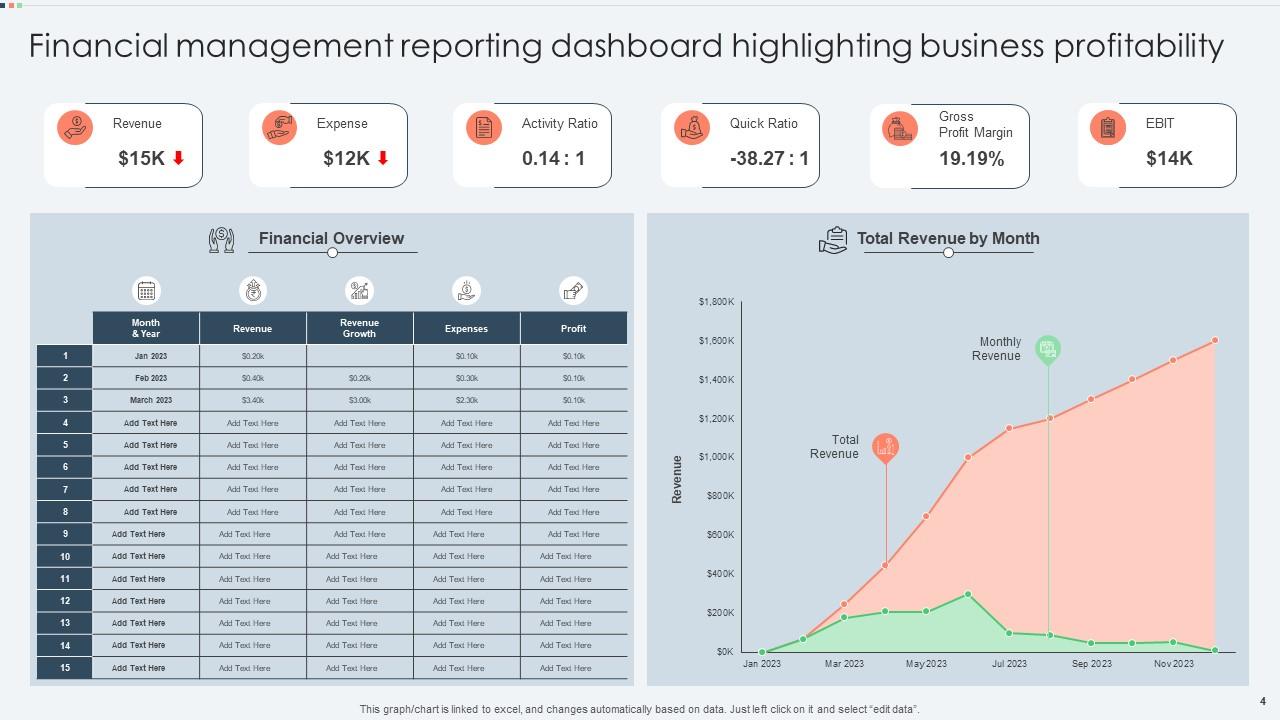
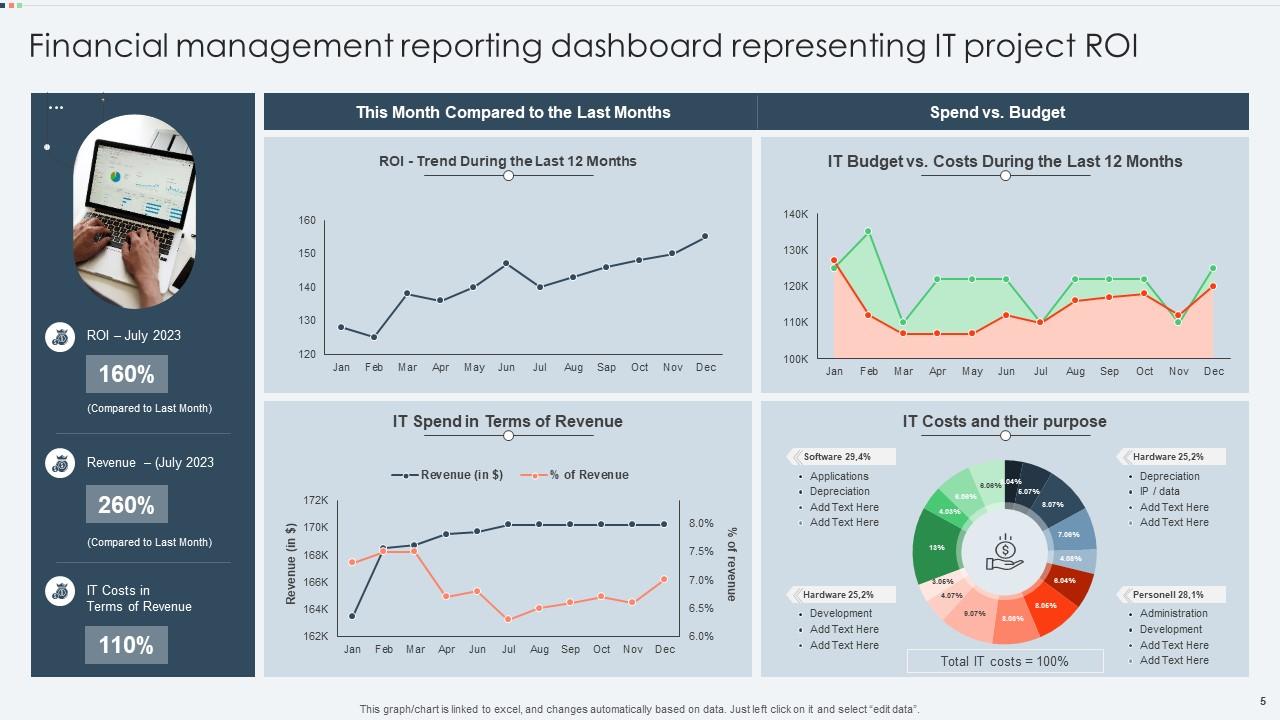


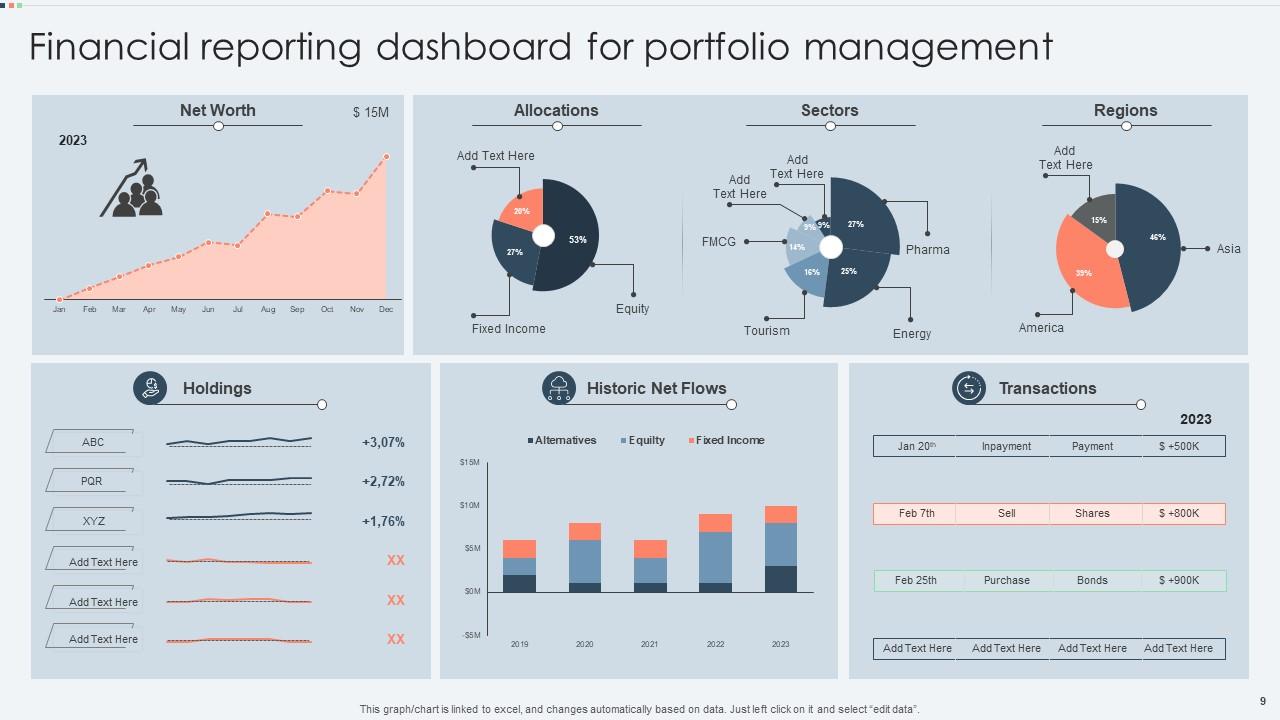


Financial Management Reporting Dashboard Powerpoint Ppt Template Bundles
Engage buyer personas and boost brand awareness by pitching yourself using this prefabricated set. This Financial Management Reporting Dashboard Powerpoint Ppt Template Bundles is a great tool to connect with your audience as it contains high-quality content and graphics. This helps in conveying your thoughts in a well-structured manner. It also helps you attain a competitive advantage because of its unique design and aesthetics. In addition to this, you can use this PPT design to portray information and educate your audience on various topics. With eleven slides, this is a great design to use for your upcoming presentations. Not only is it cost-effective but also easily pliable depending on your needs and requirements. As such color, font, or any other design component can be altered. It is also available for immediate download in different formats such as PNG, JPG, etc. So, without any further ado, download it now.
Try Before you Buy Download Free Sample Product
Save Hours of Time
100% Editable
Compatible with Google Slides
-
Product Description
-
Our Financial Management Reporting Dashboard Powerpoint Ppt Template Bundles are topically designed to provide an attractive backdrop to any subject. Use them to look like a presentation pro.
-
Related keywords
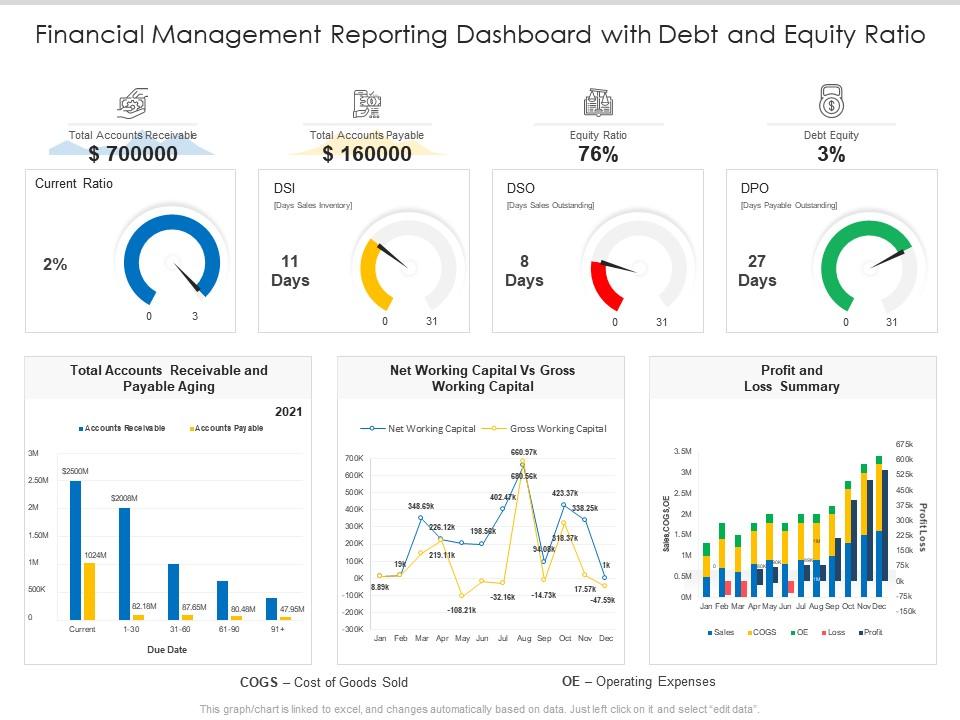

Financial management reporting dashboard with debt and equity ratio
Presenting our well-structured Financial Management Reporting Dashboard With Debt And Equity Ratio. The topics discussed in this slide are Equity Ratio, Debt Equity, Gross Working Capital. This is an instantly available PowerPoint presentation that can be edited conveniently. Download it right away and captivate your audience.
Try Before you Buy Download Free Sample Product
Save Hours of Time
100% Editable
Compatible with Google Slides
-
Product Description
-
Our Financial Management Reporting Dashboard With Debt And Equity Ratio are topically designed to provide an attractive backdrop to any subject. Use them to look like a presentation pro.
-
Related keywords


Financial reporting dashboard snapshot with assets and labilities
Introducing our Financial Reporting Dashboard Snapshot With Assets And Labilities set of slides. The topics discussed in these slides are Liquidity Ratio, Working Capital Ratio, Current Liabilities. This is an immediately available PowerPoint presentation that can be conveniently customized. Download it and convince your audience.
Try Before you Buy Download Free Sample Product
Save Hours of Time
100% Editable
Compatible with Google Slides
-
Product Description
-
Our Financial Reporting Dashboard With Assets And Labilities are topically designed to provide an attractive backdrop to any subject. Use them to look like a presentation pro.
-
Related keywords


Small Business Financial Report Dashboard
This slide highlights the financial report dashboard for a small business firm. The purpose of this slide is to depict the financial performance of a small business firm through the analysis of various indicators such as current ratio, month-end cash reserves, outstanding daily payables, etc. Presenting our well structured Small Business Financial Report Dashboard. The topics discussed in this slide are Business, Financial, Dashboard. This is an instantly available PowerPoint presentation that can be edited conveniently. Download it right away and captivate your audience.
Try Before you Buy Download Free Sample Product
Save Hours of Time
100% Editable
Compatible with Google Slides
-
Product Description
-
This slide highlights the financial report dashboard for a small business firm. The purpose of this slide is to depict the financial performance of a small business firm through the analysis of various indicators such as current ratio, month-end cash reserves, outstanding daily payables, etc.


Financial reporting dashboard snapshot ppt model
Presenting financial reporting dashboard ppt model. This is a financial reporting dashboard snapshot ppt model. This is a three stage process. The stages in this process are business, dashboard, financial, measuring, meter.
Try Before you Buy Download Free Sample Product
Save Hours of Time
100% Editable
Compatible with Google Slides
-
Product Description
-
Establish yourself as a frontrunner with our Financial Reporting Dashboard Snapshot Ppt Model. Be the individual who is always ahead.