

Top 10 Manufacturing Metrics Dashboard Showing Process Cycle Time PowerPoint Presentation Templates in 2026
A Manufacturing Metrics Dashboard showcasing Process Cycle Time is an essential PowerPoint presentation template designed to help organizations visualize and analyze their production efficiency. This dashboard provides a comprehensive overview of key performance indicators related to manufacturing processes, with a specific focus on cycle time. By utilizing this PPT, manufacturers can effectively track the duration of each production cycle, identify bottlenecks, and assess the overall productivity of their operations.The template allows for the integration of real-time data, enabling users to present cycle time metrics in a visually appealing manner. Charts, graphs, and gauges can be customized to represent data trends, comparisons, and targets, making it easier for stakeholders to understand performance at a glance. The dashboard can also highlight variations in cycle times across different production lines or shifts, facilitating data-driven decision-making.Use cases for this Manufacturing Metrics Dashboard include presenting to management during performance reviews, training sessions for new employees, or as part of continuous improvement initiatives. By leveraging this PPT, teams can foster a culture of transparency and accountability, driving efforts to optimize manufacturing processes, reduce waste, and ultimately enhance overall operational efficiency. This empowers organizations to remain competitive in a rapidly evolving industry landscape.





Manufacturing Metrics Dashboard Showing Process Cycle Time
This slide represents the dashboard showing the production manufacturing metrics. It includes key performance indicators such as process cycle time by date, table build, process completion by date, first pass yield, defective components and causes etc. Introducing our Manufacturing Metrics Dashboard Showing Process Cycle Time set of slides. The topics discussed in these slides are Process Cycle, Process Completions, Defective Components. This is an immediately available PowerPoint presentation that can be conveniently customized. Download it and convince your audience.

Try Before you Buy Download Free Sample Product
 Save Hours of Time
 100% Editable
 Compatible with Google Slides
-
Product Description

-
This slide represents the dashboard showing the production manufacturing metrics. It includes key performance indicators such as process cycle time by date, table build, process completion by date, first pass yield, defective components and causes etc.
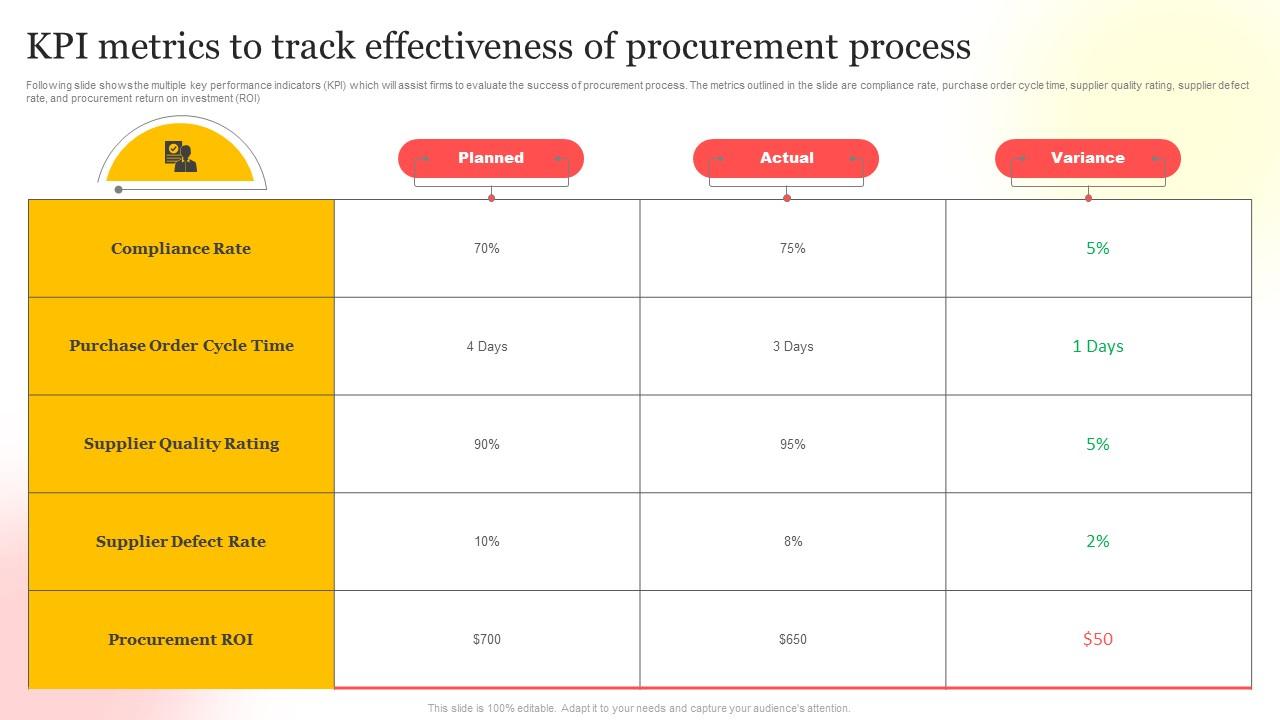
Kpi Metrics To Track Effectiveness Of Procurement Process
Following slide shows the multiple key performance indicators KPI which will assist firms to evaluate the success of procurement process. The metrics outlined in the slide are compliance rate, purchase order cycle time, supplier quality rating, supplier defect rate, and procurement return on investment ROI Presenting our well structured Kpi Metrics To Track Effectiveness Of Procurement Process. The topics discussed in this slide are Effectiveness, Procurement, Process. This is an instantly available PowerPoint presentation that can be edited conveniently. Download it right away and captivate your audience.
Try Before you Buy Download Free Sample Product
Save Hours of Time
100% Editable
Compatible with Google Slides
-
Product Description
-
Following slide shows the multiple key performance indicators KPI which will assist firms to evaluate the success of procurement process. The metrics outlined in the slide are compliance rate, purchase order cycle time, supplier quality rating, supplier defect rate, and procurement return on investment ROI
-
Related keywords




Effective Team Training Program Team Training Kpis And Metrics Dashboard Ppt Example
This slide shows major key performance metrics to ensure the productivity and engagement within the teams for completing the courses on time with respect to the fixed targets . Introducing Effective Team Training Program Team Training Kpis And Metrics Dashboard Ppt Example to increase your presentation threshold. Encompassed with eight stages, this template is a great option to educate and entice your audience. Dispence information on Return On Investment, Training Completion Rate, Registrations Per Training, Training Task Completion, using this template. Grab it now to reap its full benefits.
Try Before you Buy Download Free Sample Product
Save Hours of Time
100% Editable
Compatible with Google Slides
-
Product Description
-
This slide shows major key performance metrics to ensure the productivity and engagement within the teams for completing the courses on time with respect to the fixed targets

Timeline Showing Expected Results Post CDP Implementation Gathering Real Time Data With CDP Software MKT SS V
The following slide depicts milestone timeline highlighting projected benefits after CSP execution to facilitate investment decision and formulate strategies. It includes elements such as accurate performance tracking, personalized campaign, grabbing opportunities, data driven decisions etc. Increase audience engagement and knowledge by dispensing information using Timeline Showing Expected Results Post CDP Implementation Gathering Real Time Data With CDP Software MKT SS V. This template helps you present information on Four stages. You can also present information on Testing And Enhancement, Products, Personalized Campaign Management using this PPT design. This layout is completely editable so personaize it now to meet your audiences expectations.
Try Before you Buy Download Free Sample Product
Save Hours of Time
100% Editable
Compatible with Google Slides
-
Product Description
-
The following slide depicts milestone timeline highlighting projected benefits after CSP execution to facilitate investment decision and formulate strategies. It includes elements such as accurate performance tracking, personalized campaign, grabbing opportunities, data driven decisions etc.
-
Related keywords

Efficient Warehouse Management With Essential Metrices
Following slide shows the key indicators which help in monitoring warehouse performance and enhance daily productivity by evaluating metrices. It includes rate of product return, inventory turnover, picking accuracy and lead time and productivity. Introducing our premium set of slides with Efficient Warehouse Management With Essential Metrices. Ellicudate the five stages and present information using this PPT slide. This is a completely adaptable PowerPoint template design that can be used to interpret topics like Rate Of Product Return, Inventory Turnover, Productivity. So download instantly and tailor it with your information.
Try Before you Buy Download Free Sample Product
Save Hours of Time
100% Editable
Compatible with Google Slides
-
Product Description
-
Following slide shows the key indicators which help in monitoring warehouse performance and enhance daily productivity by evaluating metrices. It includes rate of product return, inventory turnover, picking accuracy and lead time and productivity.


Business innovation business planning ppt powerpoint presentation slides show cpb
Presenting this set of slides with name Business Innovation Business Planning Ppt Powerpoint Presentation Slides Show Cpb. This is an editable Powerpoint four stages graphic that deals with topics like Business Innovation Business Planning to help convey your message better graphically. This product is a premium product available for immediate download and is 100 percent editable in Powerpoint. Download this now and use it in your presentations to impress your audience.
Try Before you Buy Download Free Sample Product
Save Hours of Time
100% Editable
Compatible with Google Slides
-
Product Description
-
Give them a hand with our Business Innovation Business Planning Ppt Powerpoint Presentation Slides Show Cpb. Your assistance will earn their gratitude.


Time to market dashboard of company new product powerpoint template
This slide show graphs related to various metrics that help in measuring the time for introducing new products. Data covered under this dashboard include number of new product, major medium minor release and on time rate over time per type stage and status. This is a Time To Market Dashboard Of Company New Product Powerpoint Template drafted with a diverse set of graphics, that can be reformulated and edited as per your needs and requirements. Just download it in your system and make use of it in PowerPoint or Google Slides, depending upon your presentation preferences.
Try Before you Buy Download Free Sample Product
Save Hours of Time
100% Editable
Compatible with Google Slides
-
Product Description
-
Our Time To Market Dashboard Of Company New Product Powerpoint Template are topically designed to provide an attractive backdrop to any subject. Use them to look like a presentation pro.

Product Supply Chain Performance Management Dashboard
This slide shows the dashboard representing the performance of the supply chain management of an organization. It includes details related to order status, perfect order rate, on time delivery rate, cash to cash cycle time, days receivable and payable outstanding etc. Presenting our well structured Product Supply Chain Performance Management Dashboard. The topics discussed in this slide are Supply Chain, Performance Dashboard, Product Order Details. This is an instantly available PowerPoint presentation that can be edited conveniently. Download it right away and captivate your audience.
Try Before you Buy Download Free Sample Product
Save Hours of Time
100% Editable
Compatible with Google Slides
-
Product Description
-
This slide shows the dashboard representing the performance of the supply chain management of an organization. It includes details related to order status, perfect order rate, on time delivery rate, cash to cash cycle time, days receivable and payable outstanding etc.