

Top 10 Reporting And Analytics PowerPoint Presentation Templates in 2026
Reporting and analytics are essential components in decision making processes across various industries, and PowerPoint presentations serve as a powerful medium for conveying complex data insights in a visually appealing manner. By utilizing customizable PowerPoint templates, organizations can transform raw data into compelling narratives that highlight key performance indicators, trends, and actionable insights. These templates allow users to create dynamic charts, graphs, and infographics that simplify the interpretation of data, making it accessible to diverse audiences.In the realm of reporting, PowerPoint enables teams to present quarterly business reviews, project updates, and performance analyses in a structured format. The flexibility of PPT allows for the integration of multimedia elements, such as videos and interactive dashboards, which can enhance audience engagement and understanding. For analytics, PowerPoint serves as a platform to showcase predictive models, data visualizations, and strategic recommendations, fostering informed discussions among stakeholders.Moreover, the ability to easily edit and customize these presentations ensures that the information remains relevant and up to date, accommodating any last minute changes in data or focus areas. Ultimately, leveraging PPT for reporting and analytics not only streamlines communication but also empowers organizations to make data driven decisions with confidence.



Enterprise Procurement Reporting And Analysis Purchasing Analytics Tools And Techniques
This slide covers procurement reporting and analysis dashboard including KPI and metrices such as spend, transactions, PO, PR and invoice count, invoices information, due dates, spend by payment terms, supplier payment terms etc. Deliver an outstanding presentation on the topic using this Enterprise Procurement Reporting And Analysis Purchasing Analytics Tools And Techniques. Dispense information and present a thorough explanation of On Time Payments, PO Coverage, Contract Coverage using the slides given. This template can be altered and personalized to fit your needs. It is also available for immediate download. So grab it now.

Try Before you Buy Download Free Sample Product
 Save Hours of Time
 100% Editable
 Compatible with Google Slides
-
Product Description

-
This slide covers procurement reporting and analysis dashboard including KPI and metrices such as spend, transactions, PO, PR and invoice count, invoices information, due dates, spend by payment terms, supplier payment terms etc.
-
Related keywords




Operational Analytics Powerpoint PPT Template Bundles
Deliver a lucid presentation by utilizing this Operational Analytics Powerpoint PPT Template Bundles. Use it to present an overview of the topic with the right visuals, themes, shapes, and graphics. This is an expertly designed complete deck that reinforces positive thoughts and actions. Use it to provide visual cues to your audience and help them make informed decisions. A wide variety of discussion topics can be covered with this creative bundle such as Business Analytics, Operational intelligence, Business intelligence, Operational Reporting, Process analytics. All the twenty one slides are available for immediate download and use. They can be edited and modified to add a personal touch to the presentation. This helps in creating a unique presentation every time. Not only that, with a host of editable features, this presentation can be used by any industry or business vertical depending on their needs and requirements. The compatibility with Google Slides is another feature to look out for in the PPT slideshow.
Try Before you Buy Download Free Sample Product
Save Hours of Time
100% Editable
Compatible with Google Slides
-
Product Description
-
Introducing our comprehensive PowerPoint presentation on Operational Analytics the ultimate solution for businesses seeking to harness the power of data-driven decision-making. This dynamic PPT delves into the realms of Business Analytics, offering deep insights into key operational processes. Unleash the potential of Operational Intelligence to optimize workflows and improve performance. Dive into the world of Business Intelligence and discover how to leverage data for strategic planning and enhanced productivity. Seamlessly integrate Operational Reporting, enabling real time monitoring of critical metrics. With Process Analytics, uncover hidden inefficiencies and streamline operations for unparalleled efficiency. Whether you are a seasoned data expert or a novice, this presentation empowers everyone to transform raw data into actionable intelligence, driving success across all aspects of your enterprise.
-
Related keywords


Statistical Analytics Report Showing Evolution Of Sales Industry
The following slide showcases a comprehensive analytical report highlighting the evolution of sales industry over the years. It provides information about sales cycle, state of the sales industry, etc. Presenting our well structured Statistical Analytics Report Showing Evolution Of Sales Industry. The topics discussed in this slide are Sales Industry, Organizations, Technologies. This is an instantly available PowerPoint presentation that can be edited conveniently. Download it right away and captivate your audience.
Try Before you Buy Download Free Sample Product
Save Hours of Time
100% Editable
Compatible with Google Slides
-
Product Description
-
Our Statistical Analytics Report Showing Evolution Of Sales Industry are topically designed to provide an attractive backdrop to any subject. Use them to look like a presentation pro.
-
Related keywords
Nyc accident analytics report dashboard snapshot powerpoint template
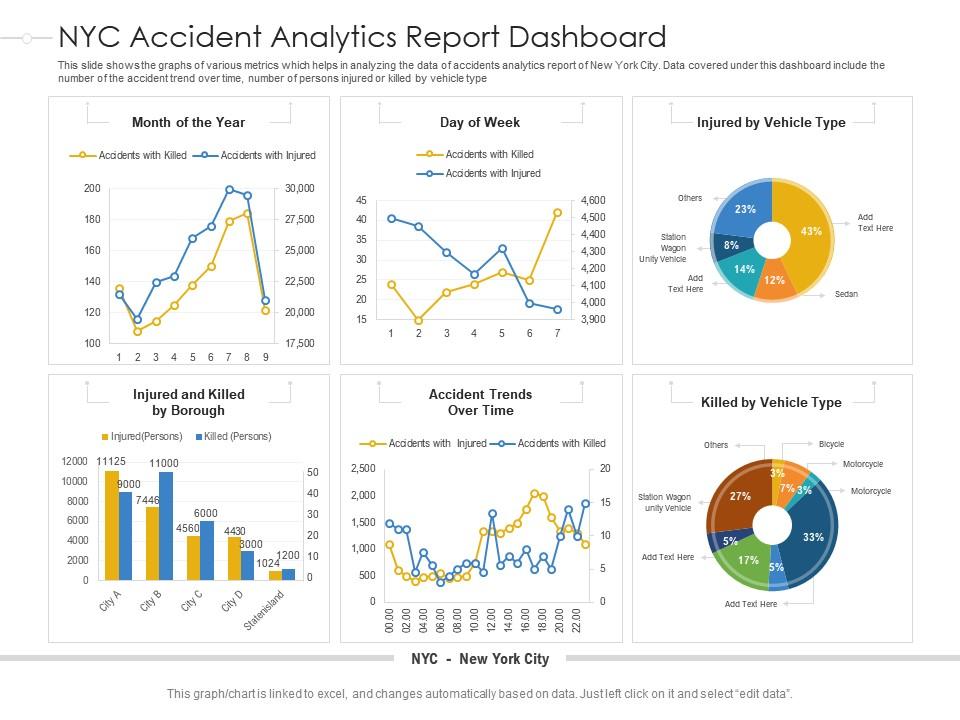
This slide shows the graphs of various metrics which helps in analyzing the data of accidents analytics report of New York City. Data covered under this dashboard snapshot include the number of the accident trend over time, number of persons injured or killed by vehicle type. This is a NYC Accident Analytics Report Dashboard Snapshot Powerpoint Template drafted with a diverse set of graphics, that can be reformulated and edited as per your needs and requirements. Just download it in your system and make use of it in PowerPoint or Google Slides, depending upon your presentation preferences.
Try Before you Buy Download Free Sample Product
Save Hours of Time
100% Editable
Compatible with Google Slides
-
Product Description
-
Our NYC Accident Analytics Report Dashboard Snapshot Powerpoint Template are topically designed to provide an attractive backdrop to any subject. Use them to look like a presentation pro.


Reporting analytics ppt powerpoint presentation gallery grid cpb
Presenting this set of slides with name Reporting Analytics Ppt Powerpoint Presentation Gallery Grid Cpb. This is an editable Powerpoint three stages graphic that deals with topics like Reporting Analytics to help convey your message better graphically. This product is a premium product available for immediate download and is 100 percent editable in Powerpoint. Download this now and use it in your presentations to impress your audience.
Try Before you Buy Download Free Sample Product
Save Hours of Time
100% Editable
Compatible with Google Slides
-
Product Description
-
Build a connect with our Reporting Analytics Ppt Powerpoint Presentation Gallery Grid Cpb. They will be good conduits for your thoughts.


Website Monthly Usage Analytics Report Dashboard
This slide depicts website usage analytics report for tracking performance. It involves number of users, sessions, bounce rate and average session duration. Introducing our Website Monthly Usage Analytics Report Dashboard set of slides. The topics discussed in these slides are Website Monthly Analytics, Report Dashboard. This is an immediately available PowerPoint presentation that can be conveniently customized. Download it and convince your audience.
Try Before you Buy Download Free Sample Product
Save Hours of Time
100% Editable
Compatible with Google Slides
-
Product Description
-
This slide depicts website usage analytics report for tracking performance. It involves number of users, sessions, bounce rate and average session duration.
-
Related keywords


Website Analytics Report Powerpoint Ppt Template Bundles
If you require a professional template with great design,then this Website Analytics Report Powerpoint Ppt Template Bundles is an ideal fit for you. Deploy it to enthrall your audience and increase your presentation threshold with the right graphics,images,and structure. Portray your ideas and vision using twelve slides included in this complete deck. This template is suitable for expert discussion meetings presenting your views on the topic. With a variety of slides having the same thematic representation,this template can be regarded as a complete package. It employs some of the best design practices,so everything is well-structured. Not only this,it responds to all your needs and requirements by quickly adapting itself to the changes you make. This PPT slideshow is available for immediate download in PNG,JPG,and PDF formats,further enhancing its usability. Grab it by clicking the download button.
Try Before you Buy Download Free Sample Product
Save Hours of Time
100% Editable
Compatible with Google Slides
-
Product Description
-
Our Website Analytics Report Powerpoint Ppt Template Bundles are topically designed to provide an attractive backdrop to any subject. Use them to look like a presentation pro.
-
Related keywords


Digital Marketing Audit Of Website Web Analytics Audit Report
This slide highlights the web analytics audit report with website conversation rate, type of website visitors, site traffic website open rate by browser and purchase by device type. Present the topic in a bit more detail with this Digital Marketing Audit Of Website Web Analytics Audit Report. Use it as a tool for discussion and navigation on Website Conversion, Conversion Rate, Purchase Device. This template is free to edit as deemed fit for your organization. Therefore download it now.
Try Before you Buy Download Free Sample Product
Save Hours of Time
100% Editable
Compatible with Google Slides
-
Product Description
-
This slide highlights the web analytics audit report with website conversation rate, type of website visitors, site traffic website open rate by browser and purchase by device type.


Onsite web analytics powerpoint layout
Presenting onsite web analytics powerpoint layout. This is a onsite web analytics powerpoint layout. This is a one stage process. The stages in this process are marketing, business, technology, analytics, management.
Try Before you Buy Download Free Sample Product
Save Hours of Time
100% Editable
Compatible with Google Slides
-
Product Description
-
Cut to the chase with our Onsite Web Analytics Powerpoint Layout. Your thoughts will avoid false assumptions.