

Top 10 Risk And Governance Kpi Dashboard PowerPoint Presentation Templates in 2026
Introducing our Risk and Governance KPI Dashboard, a fully editable and customizable PowerPoint presentation designed to empower organizations in effectively monitoring and managing their risk and governance frameworks. This comprehensive dashboard provides a visual representation of key performance indicators (KPIs) related to risk management, compliance, and governance, enabling stakeholders to gain insights at a glance. With its user-friendly design, you can easily tailor the content to align with your organization's specific objectives and risk appetite.Use cases for the Risk and Governance KPI Dashboard are vast and varied. Organizations can utilize it during board meetings to present risk assessments and governance performance, facilitating informed decision-making. It serves as an essential tool for compliance officers to track adherence to regulatory requirements, ensuring that all necessary measures are in place. Additionally, project managers can leverage the dashboard to monitor risks associated with ongoing projects, allowing for proactive mitigation strategies. By integrating this KPI dashboard into your reporting processes, you can foster a culture of transparency and accountability, ultimately driving better governance practices and enhancing organizational resilience. Transform your risk management approach today with our customizable Risk and Governance KPI Dashboard!


Enterprise risk management dashboard for improving governance system
Introducing our Enterprise Risk Management Dashboard For Improving Governance System set of slides. The topics discussed in these slides are Risk Rating Breakdown, Risk Heat Map, Action Plan Breakdown. This is an immediately available PowerPoint presentation that can be conveniently customized. Download it and convince your audience.

Try Before you Buy Download Free Sample Product
 Save Hours of Time
 100% Editable
 Compatible with Google Slides
-
Product Description

-
Our Enterprise Risk Management Dashboard For Improving Governance System are topically designed to provide an attractive backdrop to any subject. Use them to look like a presentation pro.



Public Governance Risk Rating And Analysis Software Dashboard
This slide covers the status report of risks and security breaches in government initiated public services. It includes risk analysis progress, risk assessment matrix, risk rating and action plan breakdown.Introducing our Public Governance Risk Rating And Analysis Software Dashboard set of slides. The topics discussed in these slides are Risks Analysis Progress, Action Plan Breakdown, Response Progress. This is an immediately available PowerPoint presentation that can be conveniently customized. Download it and convince your audience.
Try Before you Buy Download Free Sample Product
Save Hours of Time
100% Editable
Compatible with Google Slides
-
Product Description
-
This slide covers the status report of risks and security breaches in government initiated public services. It includes risk analysis progress, risk assessment matrix, risk rating and action plan breakdown.
-
Related keywords




Dashboard For Tracking Project Status And Governance Effectiveness
This slide highlights the dashboard for tracking project status and effectiveness of adopted governance framework. The purpose of this slide is to help the project management track and assess the progress of any project through evaluation of indicators such as project timeline, risk analysis, resource allocation, etc. Presenting our well structured Dashboard For Tracking Project Status And Governance Effectiveness. The topics discussed in this slide are Governance, Effectiveness, Dashboard. This is an instantly available PowerPoint presentation that can be edited conveniently. Download it right away and captivate your audience.
Try Before you Buy Download Free Sample Product
Save Hours of Time
100% Editable
Compatible with Google Slides
-
Product Description
-
This slide highlights the dashboard for tracking project status and effectiveness of adopted governance framework. The purpose of this slide is to help the project management track and assess the progress of any project through evaluation of indicators such as project timeline, risk analysis, resource allocation, etc.
-
Related keywords


Revenue Performance And Risk KPI Dashboard Snapshot
This slide illustrates graphical representation of risk key performance indicators. It includes revenue performance of business units with their risk expenditure and people KRIs like employee job satisfaction, customer satisfaction etc. Introducing our Revenue Performance And Risk KPI Dashboard set of slides. The topics discussed in these slides are KPI Dashboard, Revenue Performance of Business Units, Risk Management Expenditure by Business Units. This is an immediately available PowerPoint presentation that can be conveniently customized. Download it and convince your audience.
Try Before you Buy Download Free Sample Product
Save Hours of Time
100% Editable
Compatible with Google Slides
-
Product Description
-
This slide illustrates graphical representation of risk key performance indicators. It includes revenue performance of business units with their risk expenditure and people KRIs like employee job satisfaction, customer satisfaction etc.


Corporate Risk KPI And Control Dashboard Snapshot With Expenditure
This slide illustrates corporate risk key performance indicators. It includes graphs of inherent risks, overdue risks, risk control data. Introducing our Corporate Risk KPI And Control Dashboard Snapshot With Expenditure set of slides. The topics discussed in these slides are Key Risk Indicators, Organization Risk Profiler, Overdue Risk, Risk Control, Inherent Risk. This is an immediately available PowerPoint presentation that can be conveniently customized. Download it and convince your audience.
Try Before you Buy Download Free Sample Product
Save Hours of Time
100% Editable
Compatible with Google Slides
-
Product Description
-
This slide illustrates corporate risk key performance indicators. It includes graphs of inherent risks, overdue risks, risk control data.
-
Related keywords


Warehouse KPI Dashboard Supply Chain Risk Management Ppt Template Risk SS
The following slide showcases key performance indicator KPI dashboard which includes key metrics such as warehouse operating cost, perfect order rate, total shipments by country, on time shipment. Present the topic in a bit more detail with this Warehouse KPI Dashboard Supply Chain Risk Management Ppt Template Risk SS. Use it as a tool for discussion and navigation on Warehouse KPI Dashboard, Warehousing Operating Costs, Total Shipments. This template is free to edit as deemed fit for your organization. Therefore download it now.
Try Before you Buy Download Free Sample Product
Save Hours of Time
100% Editable
Compatible with Google Slides
-
Product Description
-
The following slide showcases key performance indicator KPI dashboard which includes key metrics such as warehouse operating cost, perfect order rate, total shipments by country, on time shipment.
-
Related keywords
Cyber Security Risk Dashboard Snapshot With KPI Metrics
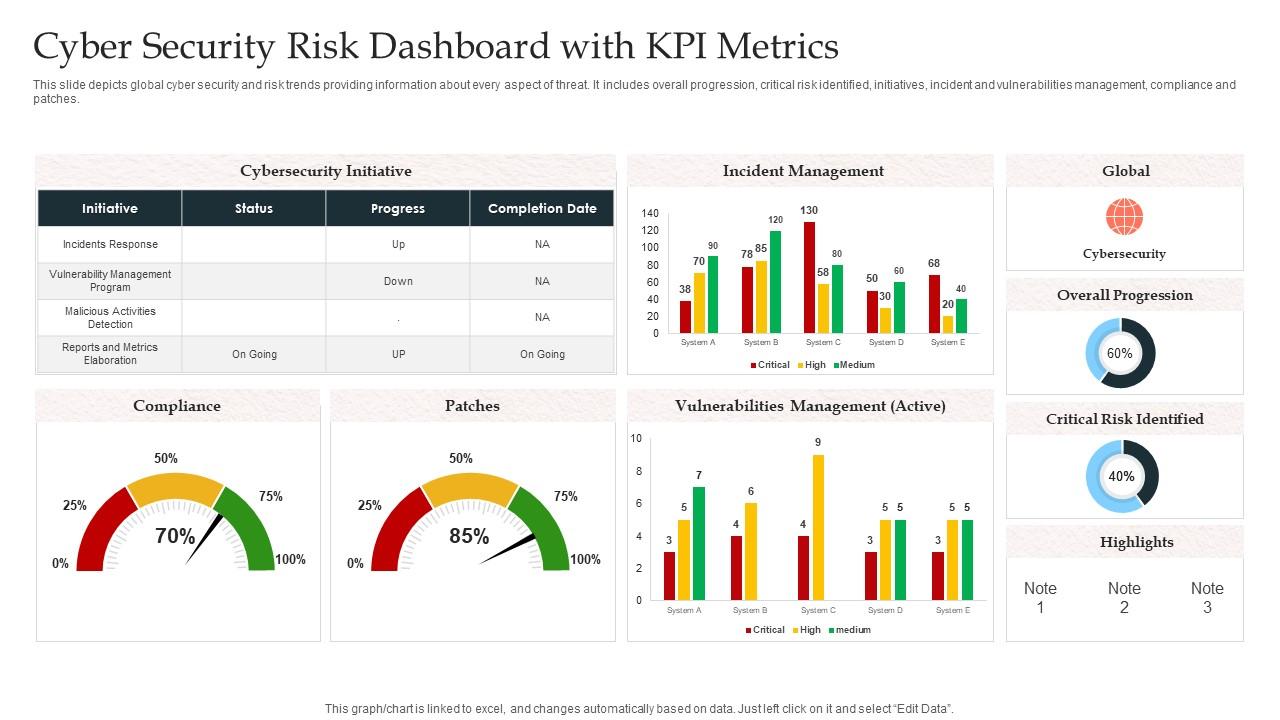
This slide depicts global cyber security and risk trends providing information about every aspect of threat. It includes overall progression, critical risk identified, initiatives, incident and vulnerabilities management, compliance and patches. Introducing our Cyber Security Risk Dashboard Snapshot With KPI Metrics set of slides. The topics discussed in these slides are Incident Management, Global, Cybersecurity, Vulnerabilities Management. This is an immediately available PowerPoint presentation that can be conveniently customized. Download it and convince your audience.
Try Before you Buy Download Free Sample Product
Save Hours of Time
100% Editable
Compatible with Google Slides
-
Product Description
-
This slide depicts global cyber security and risk trends providing information about every aspect of threat. It includes overall progression, critical risk identified, initiatives, incident and vulnerabilities management, compliance and patches.
-
Related keywords


Risk Management KPI Dashboard Snapshot With Exposure Levels
This slide illustrates graphical representation of risk key performance indicators. It includes risk levels, risk exposure and impact of risks on business. Presenting our well structured Risk Management KPI Dashboard Snapshot With Exposure Levels. The topics discussed in this slide are Risk Level of Business Units, Risk Exposure of Business Units. This is an instantly available PowerPoint presentation that can be edited conveniently. Download it right away and captivate your audience.
Try Before you Buy Download Free Sample Product
Save Hours of Time
100% Editable
Compatible with Google Slides
-
Product Description
-
This slide illustrates graphical representation of risk key performance indicators. It includes risk levels, risk exposure and impact of risks on business.
-
Related keywords


Credit Risk Management KPI Dashboard Operational Risk Management Strategic
This slide represents the key metrics dashboard representing the management of credit risks by the organization. It includes details related to key risk indicators, exposure by credit rating, sectors etc. Present the topic in a bit more detail with this Credit Risk Management KPI Dashboard Operational Risk Management Strategic. Use it as a tool for discussion and navigation on Regulatory Parameters, Trend Report, Exposure By Sectors. This template is free to edit as deemed fit for your organization. Therefore download it now.
Try Before you Buy Download Free Sample Product
Save Hours of Time
100% Editable
Compatible with Google Slides
-
Product Description
-
This slide represents the key metrics dashboard representing the management of credit risks by the organization. It includes details related to key risk indicators, exposure by credit rating, sectors etc.


Project status kpi dashboard snapshot showing progress and risk matrix
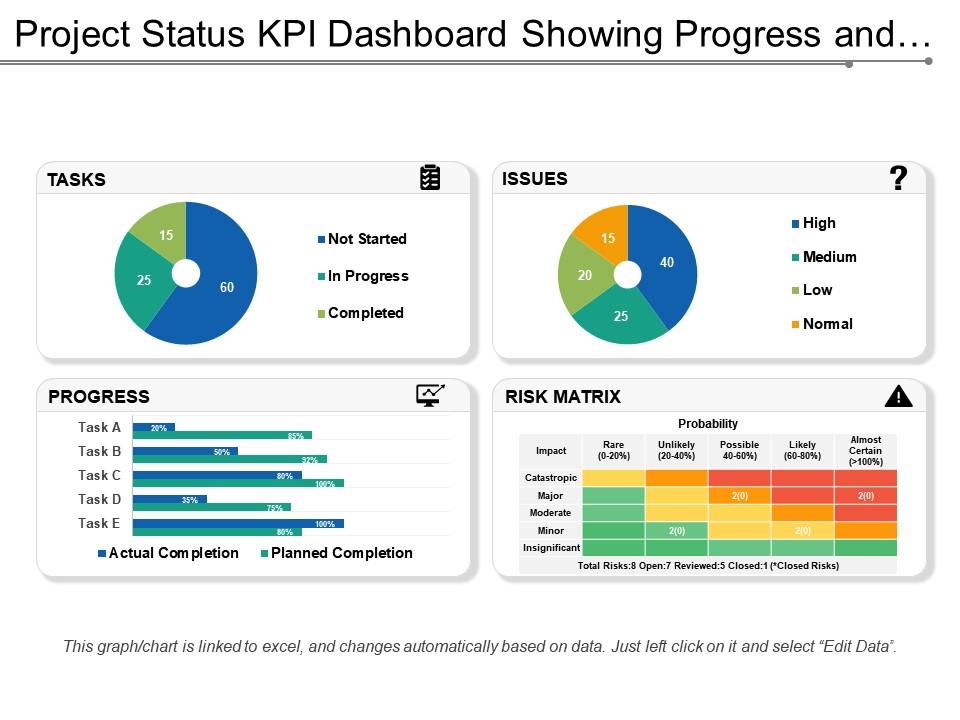
Presenting project status KPI dashboard snapshot showing progress and risk matrix PowerPoint template. Simple data input like company logo, name or trademark. This PowerPoint theme is fully supported by Google slides. Picture quality of these slides does not change even when projected on large screen. This formats can be easily changed to JPEG and PDF applications. This template is suitable for marketing, sales persons, business managers and entrepreneurs. Adjust PPT layout, font, text and color as per your necessity
Try Before you Buy Download Free Sample Product
Save Hours of Time
100% Editable
Compatible with Google Slides
-
Product Description
-
Download and showcase the accurate monitoring of several key data points throughout the lifecycle of a particular project with our excel linked project status KPI dashboard showing progress and risk matrix. This presentation slide of project status KPI dashboard showing progress and risk matrix has been designed by our team of professionals and can be useful to display KPI's, KPI types, project dashboards and to provide a brief summary of a project. This project management KPI dashboards PowerPoint slide helps you give direction to the team and data points presented in this slide makes interpretation easy to understand .Our project status KPI dash board can be used to get the current status of the project or its past performance, and can also serve as a means to detect future risks. With the help of this KPI for project management office slide, where colored status bar across the top of the template can be used as indicator to show information like if the project is on track (green), at risk (yellow) or needs attention (red). Get among the achievers with our Project Status Kpi Dashboard Showing Progress And Risk Matrix. Deal with them on an equal footing.


